Development of User Story and Design Thinking Integration Teaching Model for Software Engineering Education

Author: Muhammad Ihsan Zul, Suhaila Mohd. Yasin, Dadang Syarif Sihabudin Sahid
Journal: International Journal of Information Technology and Computer Science @ijitcs
Article in issue: 2 Vol. 18, 2026.
Free access
User stories (US) play a vital role in requirement engineering, yet they often encounter challenges such as ambiguity, inefficiency, and low quality. Many Indonesian universities face difficulties in equipping students with practical skills essential for crafting effective US, despite efforts to align curricula with industry standards. Moreover, existing approaches that integrate design thinking (DT) into educational settings are limited, as they either do not adequately emphasize the US or do not yet address the unique needs of educational contexts. This study presents an innovative US-DT integrated teaching model to enhance students’ experience developing industry-relevant user stories. Utilizing an action research methodology, the study incorporates surveys and literature reviews to guide the model's development. The model was tested with a sample of Indonesian software engineering undergraduate students, focusing on evaluating their satisfaction levels through metrics such as perceived usefulness (PU), learning motivation (LM), learning satisfaction (LS), and perceived ease of use (PEOU). The impact of the model was assessed via the Mann-Whitney U Test and Cliff’s Delta effect size, comparing it against regular teaching methods. Results demonstrate significant improvements in PU, LM, and LS, indicating effectiveness, although PEOU remains a key limitation requiring further refinement. Future research should focus on improving PEOU by refining teaching strategies, optimizing session management, introducing preparatory workshops, and extending the model’s application to different student groups to validate and broaden its educational impact. The findings suggest that adapting US and DT from industry can notably enrich student learning experiences.
User Story, Design Thinking, Requirement Engineering, Teaching Model, Learning Satisfaction
Short address: https://sciup.org/15020277
IDR: 15020277 | DOI: 10.5815/ijitcs.2026.02.04
Text of the scientific article Development of User Story and Design Thinking Integration Teaching Model for Software Engineering Education
The user story (US) is a critical element in the requirements engineering (RE) process, particularly within Agile Software Development (ASD). It functions as a communication bridge between development teams and stakeholders by capturing system requirements concisely and user-centered. However, in practice, the US often faces several complex challenges. These include ambiguity in requirement definitions [1-4], inefficiencies in team coordination [5,6], and difficulties in maintaining the quality of the resulting user stories [7,8]. These problems are observed globally and are prevalent in Indonesia, where software development teams report similar difficulties [9]. Such challenges are primarily influenced by the skills and expertise of the development team, directly affecting the overall effectiveness of the software development process.
Many universities, especially those offering software engineering programs, align their curricula with professional expectations in Indonesia to meet industry demands. This effort aims to ensure graduates are well-prepared for real-world software development, particularly regarding RE skills. However, a persistent gap between academic training and professional needs remains, indicating that curriculum alignment alone is insufficient. Higher education institutions must adopt innovative teaching strategies to equip students with practical, industry-relevant competencies [10]. In light of this need, several studies have sought to improve students' ability to apply US effectively by integrating innovative approaches into RE education, such as literature review of current RE education benefits from practical, student-centered methods like project-based learning and stakeholder involvement, but lacks a unified teaching framework [10,11], and projectbased learning in RE helps students apply theory to practice but still reveals learning gaps that need to be addressed through better instructional support [12,13]. These studies mention that enhancing teaching and instructional support is important for RE education.
One such approach that has gained attention to enhance RE activities is design thinking (DT) [14,15]. Known for its human-centered and iterative nature, DT has been proven effective in helping teams solve complex and ambiguous problems [16]. Large technology companies, including IBM [17] and SAP [18], have adopted DT because of its flexibility and success in addressing the evolving needs of software development processes. The incorporation of DT into software development practices has been leveraged across various industries, particularly through its integration with agile methodologies such as Scrum [19]. This approach aims to enhance the quality of RE by effectively addressing and managing ambiguity issues [20].
Although several models have been proposed to integrate DT with RE practices, most have not explicitly focused on US development or their use in educational settings. For instance, the Artifact Model for Domain-independent Requirements Engineering (AMDiRE) developed by Hehn et al. [21,22] integrates DT and RE but centers primarily on artifact generation and lacks direct application in teaching US. Similarly, the model by Alhazmi and Huang [23] integrates DT with Scrum and explores how DT activities can support the creation of user stories and product backlogs. However, this model lacks detailed validation of outcomes and was not designed with educational contexts in mind. Another model, Indriasari et al. [24] developed, focuses on digital banking development, combining DT with Co-Creation. Yet, it limits the use of DT to the ideation phase and does not fully integrate it into the generation of RE documents. Like the previous examples, this model lacks thorough validation and was not intended for classroom use. This reveals a gap in the literature: the absence of an educational model that guides students in applying DT principles to generate high-quality US. This study aims to fill that gap by developing a model for students in Indonesia to learn US writing based on DT principles. Unlike other models focused on RE, this research explicitly targets US development in educational settings.
The model is developed and implemented in the classroom using an action research approach. This form of pedagogical action research highlights its importance in allowing educators to examine and improve their teaching approach [25]. By focusing on real classroom needs, this approach enhances educational practices and generates relevant and applicable insights to the research context. Additionally, it encourages active engagement with changes in educational practices.
Furthermore, through this action research, this study equips students with the skills needed to craft the USs that reflect the expectations of real-world software development. It aims to enhance students’ confidence, practical ability, and satisfaction with their learning experiences. This contributes to preparing them more effectively for future challenges in the industry [26], [27], particularly in the context of software development in Indonesia. To guide this research, the following questions are posed:
• RQ1: How can a US teaching model be developed by integrating the user story and design thinking?
• RQ2: To what extent does the proposed integrated user story teaching model enhance student learning satisfaction compared to previous models?
• RQ3: What aspects of the proposed integrated user story teaching model contribute the most to student learning satisfaction, and which areas require improvement?
2. Materials and Methods
2.1. Action Research
This paper is structured as follows: Section 2 explores the development of a teaching model for US learning that integrates DT through an action research approach. Section 3 presents the results that indicate student satisfaction with statistical analysis. Section 4 discusses potential improvements based on statistical insight. Section 5 summarizes key findings and links them to the RQs. Finally, Section 6 mentions some limitations that can help guide future research.
The action research in this study was conducted using Kemmis and McTaggart’s spiral model [28], a well-established framework that is applied in various educational studies [26,29]. This model was chosen because it has several advantages in the field of education when compared to other models, such as Elliot, which focuses on education curriculum [30];
Stringer [31] and Participatory Action Research [32], which focuses on social change; and Lewin [33] and Insider [34] for organizational transformation. In detail, Kemmis and McTaggart’s Spiral model consists of four stages: planning, action, observation, and reflection. The planning phase identifies the problem and develops an action plan, followed by the action phase, where the plan is implemented to enhance practices. Data is then collected in the observation phase to evaluate the impact of changes, and the reflection phase assesses results to refine plans.
This study was conducted in two cycles; the first cycle examined the US teaching model through a survey of 142 Informatics Engineering students. Based on the Learning Satisfaction Model and PLS-SEM method, the analysis revealed that perceived ease of use (PEOU) significantly affects perceived usefulness (PU) and learning motivation (LM), which are vital for student satisfaction. The findings indicate that improving perceived ease of use and usefulness can enhance learning satisfaction in US teaching contexts [35]. The second cycle follows up on the results obtained in the first cycle. The second cycle included model development, action, observation, and reflection. Model development consisted of a survey on RE in Indonesia, a study of the DT and US models, and the development of a new integration teaching model, along with an implementation plan detailing the target group and schedule. The action and observation phase included implementing the teaching model, conducting a learning satisfaction survey, and analyzing the satisfaction results. In the reflection phase, insights from feedback were gathered to refine and improve the teaching model for future iterations. The overall overview of this action research is shown in Fig. 1.
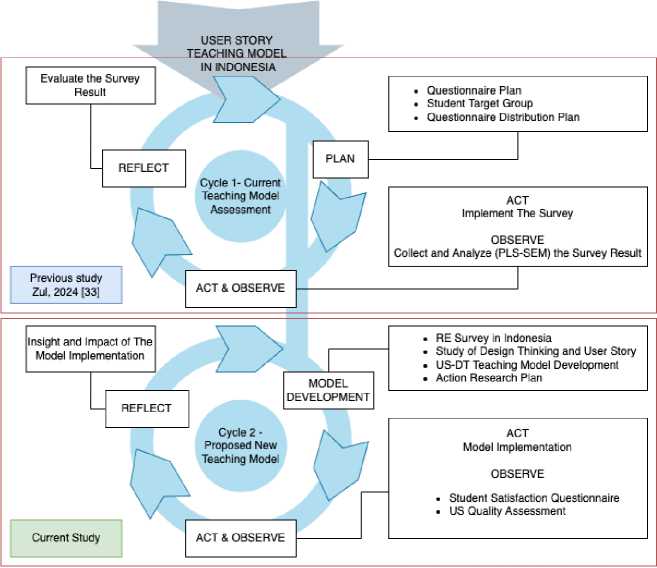
Fig.1. Action research method
A more detailed description of each stage in the second cycle is discussed in the following sub-sections
-
2.2. Model Development
Model development is applied through several stages, including (1) a Survey of the implementation of RE in education in Indonesia, (2) a study of the DT model, (3) a study of the US model, and (3) proposed model development. The following sub-section will discuss each stage.
Survey of Requirement Engineering Teaching in Indonesia
A survey was conducted to identify teaching models for RE in Indonesia. We surveyed 100 lecturers from various universities in different provinces, ensuring diverse representation through random selection. The survey's results informed the development of a teaching model specifically for the Indonesian RE context. Of the 100 lecturers targeted, 40 responded, yielding a 40% response rate. Although the response rate for the survey was 40%, the demographic distribution of respondents represents three major islands in Indonesia: Java, Sumatra, and Sulawesi. The survey specifically targeted higher education institutions implementing ASD in their curriculum, which may introduce selection bias. However, it is important to note that the survey results were not intended for generalizable statistical inference. Instead, they were used to justify the design and duration of the proposed teaching model, and to provide descriptive insights into the respondents' understanding of RE and US.
The survey results reveal that most respondents (82%) held a Master’s degree, while 18% held a Doctorate. The lecturers aged 25 to 55 had an average of 5 years of teaching experience in software engineering courses. The respondents are from 11 provinces, representing 27 higher education institutions in Indonesia. This survey reveals that RE is predominantly taught in specific courses, typically with a three-credit load. The majority of these courses combine both theoretical and practical components (58%), with the remaining consisting solely of theory (40%) or practical components exclusively (2%). This indicates that SE courses are delivered through a dual approach, incorporating theoretical and practical sessions within or across different classes. Additionally, most RE courses follow a Project and Project-Based Learning approach (83%), while the rest implement more traditional instructional methods (17%). Regarding final projects, a significant portion of lecturers (70%) assign group projects to students, fostering collaboration and teamwork.
The most commonly applied and recommended software engineering methodology in these courses is Agile Software Development (57%), followed by Waterfall (23%), DevOps (15%), and others (5%). Regarding the RE curriculum structure, the RE topic is taught predominantly in 3-4 sessions per semester, with a few respondents indicating that it is covered in only two sessions. When asked about using the US in RE, 78% of respondents reported being familiar with it, while 22% indicated they were unaware of this approach. This highlights a strong recognition of the US as part of RE practices among educators.
Based on this survey, four key points can be utilized to develop the US-DT integration teaching model, particularly in learning settings. First, the model should be developed through a combination of theoretical and practical activities in the classroom. Second, the learning process should be conducted in the form of projects or through project-based learning. Third, Agile software development is relevant to software engineering education, as discussed in this study, particularly in Indonesia. Fourth, the teaching of the US within RE should be conducted in a maximum of four sessions, each lasting 150 minutes.
Design Thinking Model
DT is a human-centered approach to problem-solving that has gained widespread recognition for its ability to foster creativity and innovation in various fields, including education and software engineering. This model emphasizes understanding users' needs and iterating solutions through a process that encourages collaboration and experimentation. Several DT models are available, with one of the most popular being the d.school model. Based on our investigation, the d.school model is also highly popular in educational research, particularly in software engineering education [23,36-39]. The model comprises five key phases: empathize, define, ideate, prototype, and test [40-43]. These phases provide a structured approach to problem-solving and innovation, making it well-suited for both academic and practical applications in software engineering.
User Story
US development is a structured process that includes several key stages. It begins with a discussion to identify opportunities or problems, followed by problem or opportunity validation and creating a simple narrative scenario, such as a wireframe sketch, to envision a solution. This scenario is validated before the actual US is created and organized through US or affinity mapping [44].
In addition to this process, the 3Cs [45] and 4Cs [46] models are proposed for writing the US. This model comprises four elements: Context, Card, Conversation, and Confirmation. The context refers to an EPIC, a larger feature in which groups are related to the US. The Card represents the US, while the Conversation captures discussions among stakeholders, requirement engineers, or students. Lastly, Confirmation refers to the acceptance criteria or verification of the US. The general US mapping has been applied for US development in line with the EPIC. This includes identifying the EPIC for the US at a general level, ordering them from start to finish, and creating the individual US [47]. Subsequent stages involve US analysis, specification, validation, and testing [2]. The overall hierarchical structure for the US generally follows this order: EPIC - US - Task/Subtask/Activities [47,48] - Steps - Detailed Steps [2].
Reflecting the general structure of the US, the US template, known as the Connextra template, has been proposed by Cohn [47] and is widely used in the requirement elicitation process. The US is considered one of the critical practices in this phase, providing a structured way to gather and define requirements [50,51]. A typical US is defined through three dimensions: WHO, WHAT, and WHY, which capture the actor (who is involved), the action (what needs to be done), and the purpose [4,48,52-53]. In detail, the US dimension is constructed around critical elements such as role, task, goal (including hard and soft goals), and capabilities. Various models have been developed to illustrate how the US is formed and structured, emphasizing the importance of linking user roles and tasks with their overarching goals to ensure the development of meaningful and relevant US [48,52-54]. These models help refine the US creation process, ensuring clarity and alignment with the broader objectives of the system being developed. The complete comparison of the US structure from different studies is shown in Fig. 2.
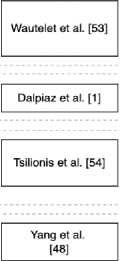
Fig.2. US dimension detail from different studies
Based on Fig. 2, it can be seen that the US elements used in previous studies are almost the same. There are only differences in terms and some details on the WHY dimension. It is observed that Role, Task, and Goal are the key elements of US in detail.
User Story and Design Thinking Integration
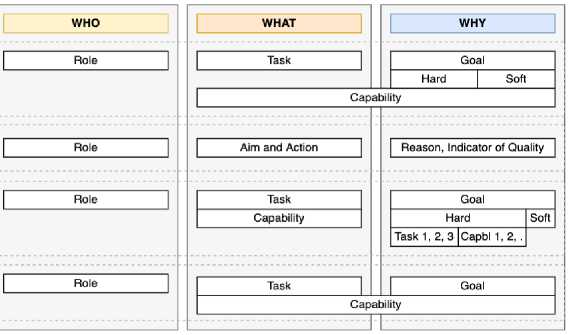
The US development model used in this integration draws upon references from several foundational studies in the field [2,44,46,47,55,56]. To further explore the relationship between the US and DT, these models were visualized in a chart to study the intersection between the US and DT. The visual representation was created based on the researchers’ gathered models, offering a clearer understanding of how the US and DT processes align.
Fig. 3 shows the intersection framework between US and DT, aligning the phases of both approaches. The DT process, which includes empathizing, defining, ideating, prototyping, and testing, is mapped to various US development models. The process starts with discussions in the empathize phase, followed by problem definition and validation in the define phase. EPICs are created, developed, and discussed in the ideation phase. In the prototype phase, the USs are generated, culminating in validation during the test phase. This visualization highlights how DT and US models work together, offering a structured approach to RE activities.
Fig.3. US and DT intersection
Next, the integration model was developed regarding the intersection model. The proposed integration model outlines the activities involved in the DT process during the US creation, ensuring that each phase—empathize, define, ideate, prototype, and test—contributes to the development of the US. In addition, the outline details specific teaching activities, including the duration of each session, meeting schedules, and the roles of key participants, such as the lecturer, client/user, and students. Each activity in the DT process is supported by specific tools designed to facilitate the output of that phase, helping to generate ideas, organize information, and validate the US. The complete illustration of the integration model is shown in Fig. 4.
|
PHASE |
Empathize |
Define |
Ideate |
Prototype |
Test |
||||||
|
Diverge |
Converge |
||||||||||
|
Activity |
Interview |
Brainstorming |
Brainwriting |
Brainstorming/ Priority Map |
USER STORY Brainwriting |
USER STORY Evaluation |
|||||
|
Tool s.Tem plate |
User Journey Map + Persona |
How Might We (HMW) |
Brainwriting |
Affinity Map |
Lotus Blossom/Affinity Map |
User Acceptance/Validation |
|||||
|
Output |
Client/User Journey Map |
Problem Statement (HMW) |
Ideas |
EPIC/Feature |
User Story - Task -Acceptance Criteria |
Validation Document |
|||||
|
Detail Teaching Activities |
15 Minutes Brief Introduction (Interview and User Journey Map) 30 Minutes Interview 90 Minutes User Journey Map Creation |
10 Minutes brief introduction to HMW 20 Minutes HMW Creation 5 Minutes HMW validation by the user |
10 Minutes brief introduction to Affinity Map 20 Minutes Brainwriting Activity |
10 Minutes brief introduction to the activity 30 Minutes - Affinity Map Creation 5 Minutes of validation by the user |
30 Minutes brief introduction to USER STORY (user story, epic, acceptance criteria) 70 Minutes USER STORY Creation -EPIC Mapping |
5 Minutes EPIC Affinity Map validation by user -Gallery Walk Method |
|||||
|
Duration |
135 Minutes |
35 Minutes |
60 Minutes |
50 Minutes |
100 Minutes |
50 Minutes |
|||||
|
Material |
User Journey Map Template Sticky Note, Metacard, Ballpoint |
HMW Template Sticky Note, Metacard, Ballpoint |
Affinity Map Template Sticky Note, Metacard, Ballpoint, Double Tip |
SCAMPER Template Sticky Note. Metacard, Ballpoint, Double Tip |
EPIC - USER STORY Template Sticky Note, Metacard, Ballpoint, Double Tip |
EPIC - USER STORY Template Sticky Note, Metacard, Ballpoint, Double Tip |
|||||
|
Person |
Lecturer, Student, User/Client |
Student, Lecturer, Client |
Student. Lecturer |
Student, Lecturer, Client |
Student. Lecturer |
Student, Lecturer, Client |
|||||
|
1st meeting |
2nd meeting |
3rd meeting |
|||||||||
Fig.4. US-DT integration teaching model
Specifically, the detailed activities for each phase of the DT process in US development begin with the empathize phase, which focuses on understanding the user's needs through interviews. Interviews are widely used in the empathize phase [57], involving discussions to gather user information. The questions include personal questions about the interviewee and inquiries into their experiences with the problem. This process creates a persona—a fictional character representing the user. A structured list of interview questions can be derived from previous studies [44,58]. In addition, the interview process also generates a User Journey Map (UJM), which captures the touchpoints of the user's experience from start to finish, offering insights into the service from the user's perspective [59]. Concerning tool support, tools like the touchpoint dashboard can help visualize these experiences, and the persona is crucial in mapping out user perspectives [60]. Personas, particularly text-based ones, are favored for clearly representing the end-user, enabling deeper empathy and more accurate product development based on user needs [61,62].
Moving to the define phase, the objective is to formulate clear, actionable problem statements. This is often achieved through brainwriting activities within student groups, focusing on synthesizing the insights gained during the empathize phase. One of the most effective methods for framing problem statements is the How Might We (HMW) template, which has been widely applied in various studies [40,57].
The subsequent ideate phase follows the initial problem identification through HMW statements, focusing on generating solutions. This phase consists of two main stages: divergence and convergence. Brainwriting encourages divergent thinking, allowing students to propose multiple ideas without judgment to foster creativity [63]. These ideas are then organized using affinity mapping to identify similar concepts and innovations [44,64]. Next, ideas are mapped according to potential software features in the convergence stage, forming EPICs related to the US. Subsequently, the affinity map is utilized to select the EPICs that will be incorporated into the development process. This selection is conducted by clustering similar EPICs into specific groups. Each cluster represents a distinct EPIC. From these clusters, EPICs are then selected to be implemented as system features. All generated EPICs will continue referencing the UJM formulated during the Emphasize phase.
In the prototype phase, students develop the US based on the EPICs selected during the ideation stage. The US creation process is facilitated through brainwriting, ensuring collaborative input and idea generation. The structure follows the framework of EPIC > US > User Task/Activity, as outlined in prior studies [47,56]. Each US must include acceptance criteria, which define the conditions that must be met for the story to be considered complete. This ensures clarity in what constitutes a successfully developed US. The final output of the prototype phase is a structured set of US, organized into EPIC > US > Task/Activity.
In the test phase, USs will be validated through the gallery walk activity. In this phase, each student group asses the other group’s work and gives direct feedback during the session [65]. The gallery walk activity shares group outcomes with the whole class [66]. This interactive process allows the groups to gather insights and make necessary revisions to their US for the next iteration, ensuring that the US aligns with the user's needs and expectations.
2.3. Action
The action research plan's action phase, illustrated in Fig. 1, was conducted in a software engineering course during the odd semester of the 2024-2025 academic year. The implementation of the model was carried out over three meetings involving two classes. These meetings were conducted face-to-face in a classroom between October and November 2024. 59 students participated: 34 in the first class and 25 in the second. During the sessions, students worked in groups of four to five members on a case study. The case study was from the industry, specifically PT PCR Solusi Teknologi. The case study focused on developing a Project Tracking System designed to manage and monitor project execution within the company. The company's leader is also present during the Empathize and Define phases, providing insights and experience to enhance the learning experience. This approach has also been applied in several action research studies in SEE [40,67,68].
2.4. Observe
2.5. Reflect
3. Result
3.1. Model Implementation
Based on Fig.4, it can be observed that the implementation of this model is operationalized in the teaching through three meetings. Initially, the first meeting involved forming groups, each consisting of four to five students; this activity was carried out before applying the Teaching Model sessions. Subsequently, students gathered according to their groups and were provided learning tools, including broad markers, flipchart papers, sticky notes, paper glue, and scissors. In each session or stage of DT, the tools and templates used as learning aids were introduced, supported by a presentation using slides lasting approximately 10–15 minutes. Following the introduction, the activity continued with group work sessions aligned with each DT stage. During these workgroup sessions, students were allowed to ask questions flexibly regarding their plans and the outputs they were developing.
Once the workgroup results were obtained, a general discussion of the outcomes was conducted for approximately 5–10 minutes. The discussion focused on identifying areas for improving the activities and the results. This process was operationalized in the teaching across all DT phases, except for the Test phase. Specifically, during the Test phase, validation was conducted using a Gallery Walk approach involving all teams. This validation was directed at the US produced by each group, which was presented using the Lotus Blossom Technique. A detailed explanation of this stage can be found in Subsection 2.2 under "User Story and Design Thinking Integration.
Following the Action phase, students are asked to complete a feedback form using a learning satisfaction instrument. The learning satisfaction model consists of several key factors: perceived ease of use (PEOU), perceived usefulness (PU), learning motivation (LM), and overall learning satisfaction (LS). This model was developed by integrating the Technology Acceptance Model (TAM) with the Learning Motivation Model to capture both the technological and motivational aspects of the learning experience [35]. A total of 21 questions were administered to assess these factors. In addition to the structured questions, open-ended questions were also included to gather students' descriptive feedback on the implementation of the model.
This model facilitated comparing student feedback before (cycle 1) and after the teaching model implementation (cycle 2). The comparison was conducted using a statistical test approach to determine the significance level of the model’s application. The significance level was measured based on the proposed factors. Before conducting the statistical tests, the normality test is performed for the students’ feedback data to select the appropriate statistical test for teaching model comparison in both cycle 1 and cycle 2 in this study.
In the Reflect phase, the results of the statistical tests are analyzed to evaluate student satisfaction. This analysis helps identify the approach's strengths and areas for improvement in future iterations. The evaluations provide valuable insights into how the model impacts student learning in the software engineering course in the US. The findings address RQ2 and RQ3, focusing on opportunities to better refine the US-DT teaching model to support student learning and engagement in subsequent cycles.
The implementation was conducted during the action phase. In the Empathize stage, students conduct interviews with users to identify their current activities in the project, frustrations, needs, and expectations. This process is followed by mapping the current business processes and identifying pain points at each stage. The outcome of this phase includes a Persona and UJM, which represent the users' experiences and requirements. The result can be seen in Fig. 5. (left).
Next, the Define stage, after Emphatize, allows students to formulate a problem statement using the HMW approach. This statement is developed based on the UJM and the pain points identified in the Empathize phase, enabling the determination of key challenges that must be addressed in software development. The result can be seen in Fig. 5. (center). Fig. 5 (right) shows the next stage. During the Ideate stage, there are two phases: Divergence and Convergence. The method employed in this phase is the Affinity Map, which identifies EPICs representing the planned software features. These EPICs are then categorized based on their domain similarities, and from this clustering process, the most critical EPICs necessary for system development are selected.
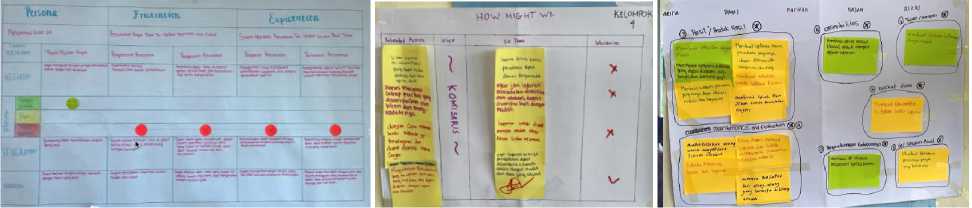
Fig.5. Empathize stage result (left), Define stage result (center), and Ideate stage result (right)
The subsequent stage, the Prototype, is illustrated in Fig. 6 (left). It involves the development of the US based on the selected EPICs. Students create the US using the Connextra template, applying the lotus blossom technique to ensure a well-structured and systematic approach.
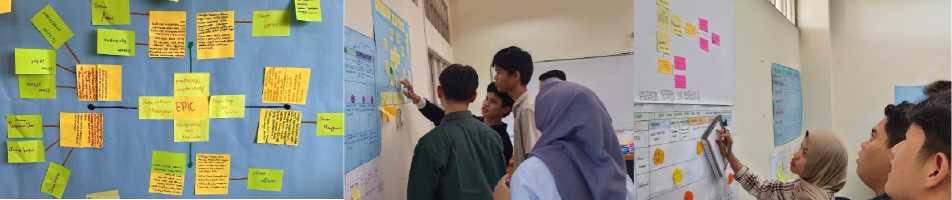
Fig.6. Prototype stage with lotus blossom technique (left) and Test stage with Gallery Walk (right)
Lastly, in the Test stage, validation is carried out using the Gallery Walk approach, in which each group reviews and provides feedback on the work of other groups within the cycle. After receiving feedback, each group revises and refines its User Stories based on the suggestions provided by its peers. Fig. 6 (left) portrays the Gallery Walk approach implementation. The implementation of this model resulted in a set of USs for developing a project tracking system equipped with EPIC. All groups produce 67 US. All of these USs come from the EPIC compiled in the Ideate phase. The list of EPICs and the number of USs in each EPIC can be seen in Table 1.
Table 1. EPIC and the total number of user stories
|
No |
EPIC |
Number of User Story |
|
1 |
User Management |
8 |
|
2 |
Project Data Management |
33 |
|
3 |
Reminder and Notification |
7 |
|
4 |
Reporting and Analysis |
8 |
|
5 |
Finance Management |
5 |
|
6 |
UI and UX Design |
2 |
|
7 |
Securtiy and Control |
2 |
|
8 |
Backup and Maintenance |
2 |
According to Table 1, it is evident that the majority of USs are concentrated in EPIC Project Data Management. This suggests significant user pain points associated with data management within the project tracking system. Consequently, the US compiled by students primarily focuses on this area.
-
3.2. Statistics Test Result
The statistical results were obtained during the observation phase of this action research study. All students received and completed the provided questionnaire, resulting in 59 feedback records that were analyzed to measure the significance level of the model's implementation compared to its pre-implementation phase. As discussed in the 2.2 sub-section, feedback from the previous model implementation comprised 142 respondents. These results were compared with the feedback from the 59 students participating in the US-DT integration teaching model.
The comparison was conducted through statistical tests, beginning with a normality test to determine the data distribution. The normality of the respondents' data, both pre- and post-the model's implementation, was assessed using the Shapiro-Wilk Method [69]. In statistical analysis, testing for normality is a critical step to ensure the validity of subsequent tests [70]. As mentioned before, the data were categorized based on four factors: PEOU, PU, LM, and LS. The result of the Shapiro-Wilk normality test is shown in Table 2, where the first column is the factor being tested for normality, and the second column is the pre-implementation teaching model column with 142 students as respondents.
In comparison, the second column is the post-implementation results for 59 students. The statistic column shows the value of the Shapiro-Wilk normality test with the p-value as a measure of data normality, with a threshold = 0.05. Fig. 10 presents the visualization of the Shapiro-Wilk normality result.
Table 2. Shapiro-Wilk normality test result
|
Factor |
Pre-Implementation (n=142) |
Post-Implementation (n=59) |
||||
|
Statistic |
p-value |
Statistic |
p-value |
Statistic |
p-value |
|
|
PU |
0.94 |
0.0000116 |
Not Normal |
0.89 |
0.00013 |
Not Normal |
|
PEOU |
0.98 |
0.0132363 |
Not Normal |
0.98 |
0.70836 |
Normal |
|
LM |
0.95 |
0.0000331 |
Not Normal |
0.91 |
0.00040 |
Not Normal |
|
LS |
0.96 |
0.0005775 |
Not Normal |
0.95 |
0.01657 |
Not Normal |
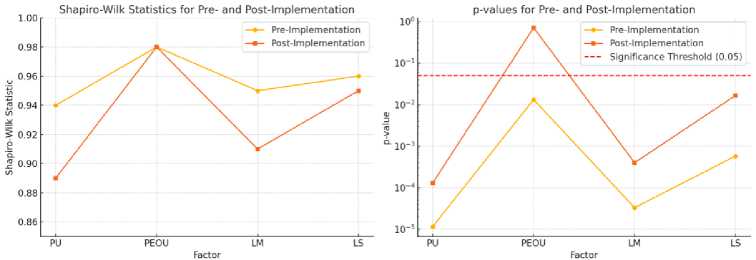
Fig.7. Shapiro-Wilk normality result visualization (left: Shapiro-Wilk Test statistics, right: p-values)
According to the normality test presented in Table 2 and Fig. 11, it is observed that the data used in this study are generally not normally distributed. Although the Shapiro-Wilk statistic approaches 1 (0.89-0.98), most p-values are below 0.05, indicating a deviation from normality. Therefore, it can be concluded that the data do not follow a normal distribution. A non-parametric approach was chosen for the comparative analysis [71]. This decision was based on several key considerations: (2) the survey data were collected using a Likert scale, which represents ordinal data; (2) the sample size was relatively small; and (3) the pre- and post-implementation groups consisted of different student cohorts, making them independent samples [72]. Considering these factors, this study employed the Mann-Whitney U Test as the nonparametric statistical test to compare the outcomes before and after the model implementation. In addition to being nonparametric, the Mann-Whitney U test is suitable for use even when sample sizes are limited and the distributions of the populations are not known [73,74]. The results of the Mann-Whitney U test are presented in Table 3.
Table 3. Mann-whitney u test result
|
Factor |
U Statistic |
p-value |
Significant level |
|
PU |
2155.5 |
0.00000004938 |
Significant difference |
|
PEOU |
4080.5 |
0.77226308764 |
No significant difference |
|
LM |
3158 |
0.00560138836 |
Significant difference |
|
LS |
2880.5 |
0.00044540577 |
Significant difference |
The statistical analysis of the intervention's impact on US learning revealed varying effects across different factors. PU showed a highly significant difference between the group before model implementation and the group after implementation (p-value=4.94e-08), indicating a substantial improvement in students' perception of usefulness. In contrast, PEOU did not exhibit a significant difference (p-value= 0.7723), suggesting that students' perceptions of PEOU remained largely unchanged between the two groups. LM demonstrated a statistically significant increase (p-value=0.0056), implying that the implementation positively influenced students' motivation toward learning in the US. Similarly, LS showed a highly significant difference (p-value=0.00045), confirming that students' satisfaction levels improved considerably after the implementation.
After conducting a statistical test using the Mann-Whitney U test to verify the differences between the pre- and postimplementation phases, it is necessary to assess the magnitude of these differences for each factor. This is also commonly called the effect size or magnitude in statistical analysis. One of the standard measures for calculating the effect size associated with the Mann-Whitney U test is Cliff’s Delta (δ) [75]. Additionally, Cliff’s Delta is a statistical effect size measurement approach specifically employed in non-parametric comparisons to evaluate the magnitude of the observed effect [76].
Thus, Cliff’s Delta result and interpretation can be seen in Table 4. The findings presented in Table 4 indicate that PU exhibited the most substantial effect size, suggesting that the intervention significantly enhanced students' perceptions of PU. In contrast, LS demonstrated a moderate effect, indicating a noticeable improvement in overall satisfaction with the learning experience. Conversely, LM revealed a small effect, which implies that while the intervention had a positive impact on motivation, the magnitude of this effect was relatively minor. Lastly, PEOU showed a negligible effect, indicating that the intervention did not considerably change students' perceptions of ease of use.
Table 4. Cliff’s delta effect size
|
Factor |
Cliff's Delta |
Effect Size Interpretation |
|
PU |
-0.485 |
Large Effect: The teaching model intervention had a strong impact on PU, suggesting that students in the intervention group perceived user story learning as much more useful than those in the regular class. |
|
PEOU |
-0.026 |
Negligible Effect: There is no meaningful difference between the teaching model intervention and regular class in terms of ease of use. |
|
LM |
-0.246 |
Small Effect: The teaching model intervention had a mild positive impact on learning motivation, but the effect is not very strong. |
|
LS |
-0.312 |
Medium Effect: The teaching model intervention moderately improved students' learning satisfaction compared to the regular class. |
-
3.3. Research Questions
Eventually, the reflect phase was conducted to answer the RQs. Thus, the detailed explanation of the answers for the RQs is as follows:
RQ1: How can a US teaching model be developed by integrating the user story and design thinking?
The integration of US and DT for US learning has been described in sub-section 2.2 and successfully implemented, demonstrating the feasibility of combining these two approaches. The survey, literature review, and the study of their intersection were key references in developing the teaching model, ensuring its design was well-grounded in both empirical data and existing research. Specifically, the survey played a crucial role in defining the learning duration and number of meetings, which ranged from three to four sessions, each lasting 150 minutes, equivalent to a three-credit load. This finding highlights the importance of structuring the learning process effectively to optimize student engagement and comprehension.
Furthermore, the literature review provided valuable insights into the overlapping activities between the US and DT, facilitating their integration into a cohesive model. These references became the primary sources for designing the US-DT teaching model, ensuring that the proposed approach aligns with both theoretical and practical perspectives. In addition, the developed model adopts the d.school framework as the foundation for DT while utilizing the EPIC hierarchy—US, Task/Subtask/Activities— for structuring US development. Moreover, the detailed elements of the US are structured based on the WHO, WHAT, and WHY dimensions, ensuring a systematic approach to user-centered RE. Finally, the US-DT teaching model was implemented across three learning sessions, reinforcing its applicability within instructional activities.
RQ2: To what extent does the proposed integrated user story teaching model enhance student learning satisfaction compared to previous models?
RQ2 is addressed by implementing the teaching model on students who served as the target group during the Action and Observe phases of the action research conducted in this study. A statistical analysis was performed following the implementation to assess its impact on student learning outcomes. The Mann-Whitney U Test was employed to analyze the data, as the Shapiro-Wilk normality test indicated that most of the student feedback data was not normally distributed. Additionally, the ordinal nature of the data and the need to compare two independent groups justified its use. The results revealed a significant improvement in PU, LM, and LS, demonstrating the teaching model’s effectiveness. However, PEOU is still an area that needs improvement, as its impact was not statistically significant.
Furthermore, the magnitude of these improvements was assessed using Cliff’s Delta effect size to determine the extent of the model’s impact on the target group. The results showed that, in terms of PU, LM, and LS, the intervention resulted in an effect size of varying magnitudes, ranging from small to large. These findings confirm that the US-DT teaching model significantly affected US learning, reinforcing its role in enhancing student motivation and satisfaction.
RQ3: What aspects of the proposed integrated User Story teaching model contribute the most to student learning satisfaction, and which areas require improvement?
The statistical analysis results indicate that the developed teaching model has a significant impact, with a large effect size (δ=-0.485) for PU. This suggests that students find the teaching model beneficial for improving their understanding and application of the US in software engineering education. Similarly, the model also shows positive effects on LM and LS, although the effect sizes remain within the small to medium range (δ=-0.246 and δ=-0.312). This implies that while the teaching model supports student engagement and satisfaction, there is still room for improvement.
However, PEOU remains a key area requiring enhancement. The results from the Mann-Whitney U Test indicate that the developed teaching model does not yet have a significant impact compared to other factors. Moreover, the effect size (δ=-0.026) suggests that the model has not shown meaningful improvement in usability compared to regular learning approaches. This indicates that the complexity of the model or its integration into the learning process may require refinement to enhance its accessibility and ease of use. These findings imply that, while students recognized the model's benefits, they faced considerable challenges navigating the learning process. Possible contributing factors include introducing unfamiliar tools and terminology, the cognitive complexity of applying design thinking phases, and the limited time allocated for each session. Such factors likely increased students’ cognitive load and hindered their interaction with the learning activities. Further discussion of these findings is provided in the Discussion section.
4. Discussion
The US-DT teaching model was developed systematically, integrating US and DT based on survey data, literature studies, and intersection analysis. As a result, the learning structure, including session duration and frequency, was carefully designed. Additionally, the d.school framework and EPIC hierarchy were applied to ensure that the model aligns with industry practices and supports effective US learning. The model developed in this study is different from previous studies. While those studies focus more broadly on RE, these studies do not explain the details of DT activities incorporated within their model [23], [24]. Study [24] applies one stage of the DT—Idea Generation, which falls under Ideation, while the Empathize and Define stages are approached through Co-Creation. Conversely, research [23] proposes an integration model of DT and ASD using the d.school model; however, it lacks an evaluation of its application. Consequently, this model has not reported the model's outcomes, which were conducted in this study through a sample of students using action research and statistical analysis.
The statistical analysis confirms the model’s benefits, demonstrating significant improvements in perceived PU, LM, and LS, as the Mann-Whitney U test results indicate. Specifically, students perceived the model as helpful, motivating, and satisfying. However, PEOU remains challenging, as it did not exhibit significant improvement relative to the other factors. The Cliff’s Delta analysis consistently confirmed positive effect sizes for PU, LM, and LS, supporting the model’s favorable impact. The strong effects observed in PU, LM, and LS can be attributed to the active learning approach embedded in the US-DT model, which enhances student engagement through collaborative US learning. Various tools and approaches provided students with new learning experiences, making the process more dynamic and supportive.
In contrast, PEOU demonstrated a minimal effect size, suggesting further refinement. Previous studies have emphasized that PEOU, when integrated effectively with PU, can positively influence both constructs [77,78]. Nevertheless, in the context of this study, PEOU remains a challenge despite the large effect size observed for PU. The small effect size suggests that the challenges encountered were not primarily due to the factor itself but rather stemmed from the approach and application of the teaching model. The investigation revealed that PEOU issues emerged as students engaged with the model. Introducing new tools acted as a double-edged sword; while they provided valuable learning opportunities, several students struggled with understanding and applying unfamiliar tools and terminology, particularly during the design thinking phases. This struggle often required additional time for students to grasp the concepts thoroughly. Furthermore, the strict time constraints imposed during each session may have made students feel rushed, limiting their ability to engage deeply with the material. These challenges were confirmed through multiple aftersession discussions. Future implementations should consider extending session durations, incorporating preparatory workshops to familiarize students with key tools and concepts before the main activities, and refining the instructional process to support better students’ comprehension and application of the teaching content.
While the statistical analysis (Mann-Whitney U Test and Cliff’s Delta) demonstrated significant improvements in PU, LM, and LS, and identified challenges in PEOU, it is important to acknowledge that the discrepancy in sample sizes between the pre-implementation and post-implementation groups may have influenced the comparison. Although the Mann-Whitney U test is regarded as robust to variations in group sizes, the imbalance may still impact the overall statistical power and the interpretation of effect sizes, particularly in PEOU, where only low improvements were observed. Therefore, it is advisable to exercise caution when generalizing the findings, and future research should strive for more balanced cohort sizes to enhance comparative validity.
5. Conclusions and Future Work
This study successfully developed and implemented the US-DT teaching model, integrating US and DT to enhance US learning in software engineering education through the action research method. This method was applied systematically by incorporating survey data, literature studies, and an intersection analysis of US and DT, ensuring academic rigor and industry relevance. The model was structured based on the d.school framework for DT and the EPIC hierarchy for US development, with a well-defined learning duration and session structure.
The model has been implemented on 59 students in the software engineering course. The implementation was evaluated by comparing this teaching model with the regular approach using statistical analysis by applying the Mann-Whitney U Test and Cliff’s Delta effect size. The results demonstrated a significant improvement in PU, LM, and LS, confirming the model’s positive impact on student engagement and learning satisfaction. Additionally, Cliff’s Delta effect size analysis further validated these findings, showing that the model had an effect size ranging from small to large for these factors. However, PEOU remained a challenge, as it did not show a significant impact. Further investigation revealed that students struggled with new tools and terminology, particularly in the DT phases, and were also affected by strict session time constraints.
Future research will best focus on improving PEOU by refining teaching strategies, content delivery, and session management to enhance usability. Moreover, it is advisable to extend the duration of sessions by reducing unimportant subsections, introduce preparatory workshops that equip students with essential tools and concepts before the main activities, and enhance the instructional delivery to improve students' understanding and application of the teaching content. Further action research cycles are needed to refine the model to overcome the PEOU challenges. On the other hand, expanding its application to different target groups could provide broader insights into its impact.
6. Limitation
This study offers contributions to software engineering courses, particularly concerning user stories. However, it also has several limitations. First, the sample size was relatively small and confined to a specific educational setting in Indonesia, which could affect the generalizability of the findings. Expanding the sample to include diverse universities could lead to broader validation. Second, the study primarily utilized quantitative analysis methods, specifically the Mann-Whitney U Test and Cliff’s Delta. While these approaches provided important insights, they did not capture qualitative perspectives such as student experiences and challenges. Lastly, the research was conducted over a limited number of learning sessions, which may have influenced the perceived effectiveness of the model. Future research could explore varying session durations to enhance the learning outcomes.
Author Contributions Statement
Muhammad Ihsan Zul – Conceptualization, Literature Survey, Constructed the overall framework, Methodology, Proposed research ideas, Teaching Model Implementation, Data Acquisition, Statistical Analysis, Initial and Final Document Writing.
Suhaila Mohd. Yasin – Conceptualization, Methodology, Supervision, Reviewed and Edited the Manuscript, Final Manuscript Review
Dadang Syarif Sihabudin Sahid – Conceptualization, Methodology, Supervision, Editing, Final Manuscript Review.
All authors have read and agreed to the published version of the manuscript.
Conflict of Interest Statement
The authors declare no conflicts of interest.
Funding Declaration
This research was funded by the Politeknik Chevron Riau Foundation as part of its Staff PhD Program.
Data Availability Statement
None
Ethical Declarations
This study involved undergraduate students as participants. Participation was voluntary, and informed consent was obtained prior to data collection. All data were collected anonymously and used solely for research purposes. The study posed minimal risk to participants and followed institutional ethical guidelines.
Acknowledgments
We sincerely thank the student who contributed to the action research.
Declaration of Generative AI in Scholarly Writing
The authors used generative AI tools solely to assist with language editing and improving the clarity and readability of the manuscript. The use of AI was limited to linguistic support, and all scientific content, analysis, interpretations, and conclusions were developed and verified by the authors. The authors carefully reviewed and revised the manuscript to ensure its accuracy and integrity.
Abbreviations
The following abbreviations are used in this manuscript:
US – User Story
ASD – Agile Software Development
RE – Requirement Engineering
DT – Design Thinking
AMDiRE – Artifact Model for Domain-independent Requirements Engineering
US-DT – User Story – Design Thinking
UJM – User Journey Map
HMW – How Might We
SEE – Software Engineering Education
PEOU – Perceived Ease of Use
PU – Perceived Usefulness
LM – Learning Motivation
LS – Learning Satisfaction
TAM – Technology Acceptance Model
