Digital models for designing high-performance fine-grained concrete compositions using man-made raw materials

Author: Demyanenko О.V., Kopanitsa N.O., Kulikova А.А., Buryanov А.F., Kozlova I.V., Lukyanova N.A.
Journal: Nanotechnologies in Construction: A Scientific Internet-Journal @nanobuild-en
Section: System solutions for technological problems
Article in issue: 5 Vol.17, 2025.
Free access
Introduction. This research focuses on the study of the composition and properties of fine-grained self-compacting concrete, including the development of a methodology for designing their structure. Methods and Materials. The following materials were used: Portland cement CEM I 42.5B; crushed stone screening of 2.5–5 mm fraction from the Kurlek quarry in the Tomsk region; sand from the Tuganskoye deposit was used as fine aggregate; quartz flour was used as microfiller; a complex modifying additive consisting of microcalcite from the Dalnegorsk mining quarry and nanosilicon dioxide obtained by the arc plasma evaporation method. Results and Discussion. The proposed methodology incorporates a computational and experimental approach that enables the selection of optimal combinations of aggregate fractions, fillers, and developed additives to achieve the required grain packing density. The use of statistical methods, such as polynomial approximation and Gaussian process regression, allowed us to identify the relationship between particle size distribution and concrete properties. Optimal ratios of each quartz aggregate fraction from man-made raw materials were determined for specific self-compacting concrete requirements in terms of concrete mix flow and hardened concrete strength. Conclusion. Laboratory tests confirmed the accuracy and effectiveness of the proposed calculations. Self-compacting concrete grade B40 compositions with reduced cement consumption (412 kg/m3) and high-performance` characteristics were developed.
Self-compacting concrete, nanomodifiers, composition design model, packing density, workability, viscosity, segregation, flowability
Short address: https://sciup.org/142246075
IDR: 142246075 | DOI: 10.15828/2075-8545-2025-17-5-547-559
Text of the scientific article Digital models for designing high-performance fine-grained concrete compositions using man-made raw materials
Original article
Demyanenko О.V., Kopanitsa N.O., Kulikova А.А., Buryanov А.F., Kozlova I.V., Lukyanova N.A. Digital models for designing high-performance fine-grained concrete compositions using man-made raw materials. Nanotechnologies in Construction. 2025;17(5):547–559. – EDN: MFKZJP.
Демьяненко О.В., Копаница Н.О., Куликова А.А., Бурьянов А.Ф., Козлова И.В., Лукьянова Н.А. Цифровые модели проектирования составов высокофункционального мелкозернистого бетона с использованием техногенного сырья. Нанотехнологии в строительстве. 2025;17(5):547–559. – EDN: MFKZJP.
Currently, the production of modern building materials urgently requires the development of new types of concrete mixtures capable of achieving high strength, durability, and resource conservation, with improved physical and mechanical properties, such as high strength, durability, and environmental friendliness. Traditional concrete production methods require the use of increased cement content, which increases costs and negatively impacts the environment. The use of coarse aggregates can reduce concrete quality due to inhomogeneity and uneven load distribution. Furthermore, Russia clearly lacks robotic systems for designing and optimizing concrete mixtures.
Existing approaches to designing such mixtures are ineffective and require significant time and material investment. Therefore, a pressing challenge is the development of design methods for self-compacting concrete using highly dispersed aggregates obtained from industrial byproducts. This will reduce production costs, optimize existing mixtures, and improve the properties of the final product. In recent decades, multicomponent composite binders have been widely used in construction. These binders include highly effective modifier additives that improve the structure and properties of concrete, as well as finely dispersed mineral fillers. These components allow the creation of compositions that ensure optimal performance of the finished product.
SYSTEM SOLUTIONS FOR TECHNOLOGICAL PROBLEMS
Developing effective concrete composition design methods aimed at selecting the optimal ratio of dispersed materials is an important task from both a scientific and practical perspective [1–3]. From a theoretical perspective, it is necessary to consider how the properties of the source materials affect such quality parameters of the concrete mix as workability, as well as those of hardened concrete (compressive strength, etc.). The properties of hardened concrete are determined by the type and characteristics of the binder, the type and quality of the aggregate, the ratio of the components, and the structure of the concrete itself. The properties of the binder are regulated by the introduction of various modifying additives, including those that affect the density of the cement stone structure. To achieve a dense and uniform concrete structure, special attention should be paid to the particle size distribution of the aggregates. Therefore, when designing the concrete mix composition, taking into account the particle size distribution of all dispersed components that affect the density of hardened concrete is a pressing issue.
METHODS AND MATERIALS
For the experimental studies, raw materials compliant with regulatory requirements were used.
The choice of raw materials was justified by the need to select components for modifying admixtures that regulate the key properties of self-compacting concrete mix and concrete.
Portland cement CEM I 42.5B from the Topkinsky Cement Plant (GOST 31108-2020) was used as a binder.
The chemical and mineralogical compositions of Portland cement clinker are presented in Table 1.
The large fraction of aggregate used was crushed stone screenings of 2.5-5 mm fraction from the Kurlek quarry in Tomsk region (Table 2), which meets the requirements of GOST 31424-2010.
Sand from the Tuganskoye deposit (JSC TGOK Ilmenite (Rosatom), TU 08.12.11-013-58914756-2020) was used as fine aggregate, meeting the requirements of GOST 2138-91, GOST 8736-2014.
The following were used as microfillers:
– quartz flour (QF), produced by grinding sand from the Tuganskoye deposit according to TU 08.12.110-01458914756-2024. Quartz flour is a secondary product of mining operations (JSC TGOK Ilmenite (Rosatom)). According to X-ray phase analysis, the material is a single-phase low-temperature quartz.
A developed complex additive (CA) was used as a modifier. The complex additive contains the following components:
– microcalcite from the Dalnegorsk quarry (Dalnegorsk, Primorsky Krai), a waste product from marble processing. It is a white powder with a specific surface area of 200 m2/kg and a CaCO3 content of 92.7%;
– nanosized silicon dioxide obtained using the plasmaarc method from quartz sand from the Tuganskoye deposit [4–5]. Specific surface area is 32000 m2/kg, average particle size is 10–300 nm.
The average density of concrete samples was determined in accordance with GOST 12730.1-2020 “Concrete. Methods for Determining Density” [6]. The compressive strength of control and modified samples was determined in accordance with GOST 10180-2012 “Concrete. Methods for Determining Strength Using Control Samples” [7].
Table 1. Portland cement clinker and its main components
|
Chemical analysis of Portland cement, % |
Mineralogical composition of clinker (main constituent phases, %) |
||
|
CaO |
61.9 |
C 3 S |
68.9 |
|
SiO2 |
19.8 |
||
|
Al 2 O 3 |
4.6 |
C 2 S |
12.6 |
|
Fe 2 O 3 |
3.0 |
||
|
MgO |
3.6 |
С3А |
6.0 |
|
SO 3 |
2.8 |
C4AF |
11.4 |
|
R2O |
0.9 |
СаО |
1.1 |
Table 2. Granulometric composition of crushed stone screenings
|
Passing through a sieve |
Sieve cell size, mm |
||||
|
20 |
10 |
5 |
2.5 |
1.25 |
|
|
Partial, % |
– |
– |
41.38 |
68.62 |
0 |
|
Total, % |
– |
– |
41.38 |
100 |
100 |
SYSTEM SOLUTIONS FOR TECHNOLOGICAL PROBLEMS
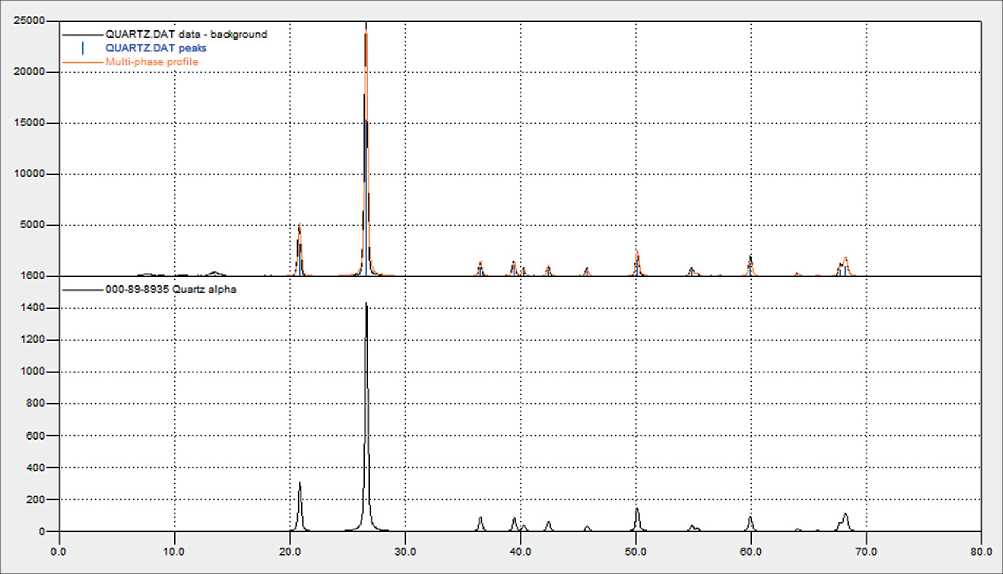
Fig. 1. X-ray diffractogram of quartz flour
The workability, viscosity, segregation, and flowability of self-compacting concrete were determined according to GOST R 59714-2021 “Self-compacting concrete mixtures. Technical conditions.” [8].
To determine the compressive strength of the samples, a hydraulic press IP-1250M was used.
RESULTS AND DISCUSSION
Design of concrete mix composition
The use of modern experimental data processing methods for analyzing the packing density of bulk materials allows for the development of a computational and experimental method for designing the optimal concrete composition. This method takes into account data on the granulometric composition of aggregates and ensures their efficient use [9–18].
Concrete mix formulation optimization is based on a consistent methodology that integrates a theoretical and analytical approach with empirical confirmation of research results. The calculation procedure involves the following sequential steps:
-
1. A detailed study of the grain size distribution of aggregates (sand and crushed stone screenings) and the construction of their distribution curves.
-
2. Using mathematical models, the optimal particle size distribution of the mixture is calculated, ensuring maximum packing density.
-
3. Each calculated composition is verified experimentally. Concrete samples with different component ratios are tested to determine the actual density, strength, and other necessary parameters.
-
4. Based on the experimental results, adjustments are made to the calculated composition to achieve the required concrete quality parameters.
This approach allows for consideration of all the characteristics of the source materials and ensures the creation of concrete with the desired properties, minimizing raw material costs and increasing the efficiency of the production process.
To calculate the concrete mix composition based on the aggregate grain packing density model, the concrete mix components whose characteristics are presented in the article were used.
During the first stage of the research, the content of 2.5–5 mm fractions was experimentally selected. The range within which the concrete mixture does not segregate and retains water was determined, and the influence of fine aggregate particle size distribution on the properties of concrete mixtures/concrete was studied.
To reliably determine the influence of fine aggregate on the properties of concrete mix and concrete, the coarse aggregate framework was fixed: consumption of the 2.5–5 mm fraction was 1100 kg/m3 (at a particle density of 2670 kg/m3); cement consumption was 350 kg/m3 (particle density was 3110 kg/m3); additive consumption was 5% of the cement mass, 17.5 kg/m3 (particle density
SYSTEM SOLUTIONS FOR TECHNOLOGICAL PROBLEMS was 2650 kg/m3). Water consumption was determined experimentally, at a given cone slump of 15 cm.
The amount of fine aggregate was determined using the absolute volume formula (particle density – 2650 kg/m3):
ms
1000 -
1100 350 17,5
2,67 + 3,11 + 2,65
X 2,65 = 770,5 кд/т3 .
Table 3 presents the experimental plan for selecting the particle size distribution of fine aggregate, expressed in relative proportions. This matrix fills the ternary diagram with 10 points.
Using the data presented in Table 3, test mixes were prepared, slump was determined, and the mixture’s segregation was visually assessed. If the mix exhibited segregation or insufficient slump, the plan was verified, and the compositions were recalculated.
At least 15 samples were prepared for each composition. Strength was determined as the arithmetic mean of 5 samples for each curing period, with a coefficient of variation of no more than 5%.
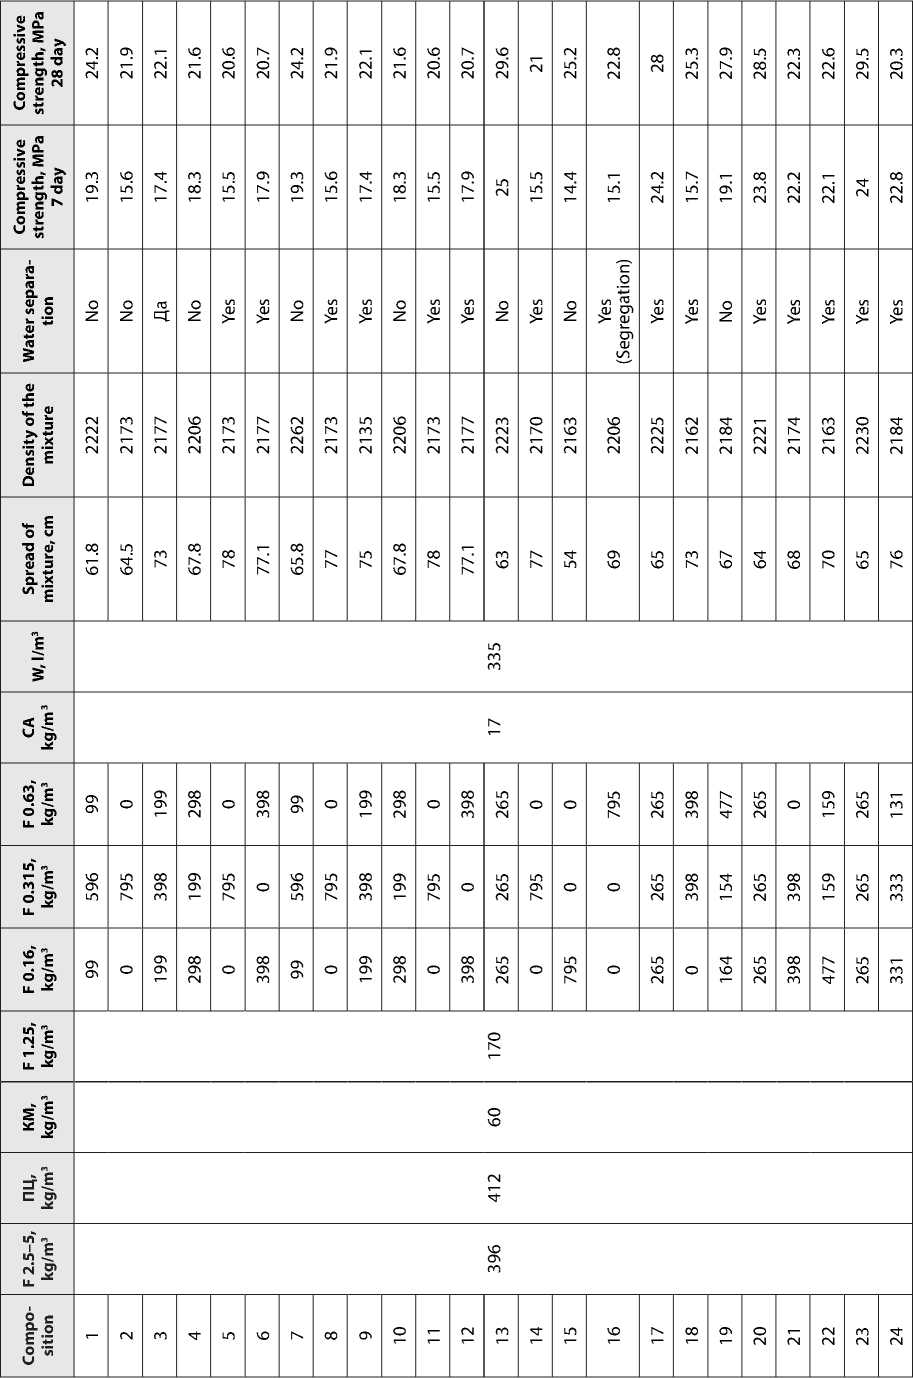
Table 4 presents the experimental compositions of concrete mixtures.
The consumption of crushed stone screenings and complex additives in compositions 1–7 remained fixed. Water consumption was determined experimentally based on the desired concrete mix flowability. Flowability in the
Table 3. Experimental plan for selecting the granulometric composition of fine aggregate
|
No. |
Fraction 0.16 |
Fraction 0.315+0.63 |
Fraction 1.25 |
|
1 |
1 |
0 |
0 |
|
2 |
0 |
1 |
0 |
|
3 |
0 |
0 |
1 |
|
4 |
0.3 |
0.15+0.15 |
0.3 |
|
5 |
0.6 |
0.1+0.1 |
0.2 |
|
6 |
0.2 |
0.3+0.3 |
0.2 |
|
7 |
0.2 |
0.1+0.1 |
0.6 |
|
8 |
0.5 |
0 |
0.5 |
|
9 |
0.5 |
0.25+0.25 |
0 |
|
10 |
0 |
0.25+0.25 |
0.5 |
Table 4. Concrete mix compositions per 1 m3
|
c о О Q. E о w |
= и о o> o> c ■° Ё m Ф 1 чьи 2 (Л CM ^ t |
M E Q. |
CM M <0 in |
40 "O <0 in |
in о E <0 in |
"O <0 in |
M E < w |
w 5 |
и si- "O Ф о w |
M E *1 Ф Q |
|
1 |
1100 |
350 |
– |
385.25 |
385.25 |
– |
17.5 |
0.57 |
0 |
2332 |
|
2 |
1100 |
350 |
– |
– |
– |
770.5 |
17.5 |
0.78 |
0 |
2224 |
|
3 |
1100 |
450 |
– |
– |
– |
770.5 |
17.5 |
0.8 |
11 |
2309 |
|
4 |
1100 |
450 |
770.5 |
– |
– |
– |
17.5 |
0.57 |
19.3 |
2130 |
|
5 |
1100 |
500 |
308.2 |
– |
– |
462.3 |
17.5 |
0.63 |
19.5 |
2278 |
|
6 |
1100 |
500 |
308.2 |
– |
462.3 |
– |
17.5 |
0.55 |
19.8 |
2239 |
|
7 |
1100 |
500 |
308.2 |
462.3 |
- |
– |
17.5 |
0.42 |
19.6 |
2352 |
|
8* |
850 |
500 |
331 |
– |
496 |
– |
17.5 |
0.4 |
1.5 |
– |
|
9* |
650 |
500 |
244 |
– |
570 |
– |
17.5 |
0.56 |
4 |
– |
* The mixture was separating and could not be molded
SYSTEM SOLUTIONS FOR TECHNOLOGICAL PROBLEMS mixtures was achieved by adding more water rather than special additives (plasticizers). This was done to determine the effect of each individual sand fraction on the rheology of the concrete mix.
Composition 1 was prepared using sand fractions of 0.315–0.63 mm, with a cement consumption of 350 kg/m3. At a water/cement ratio of 0.57, the slump remains at 0 cm, further increases in the amount of water in the mixture lead to stratification.
Composition 2 was prepared using a sand fraction of 0.16, and the cement consumption was also 350 kg/m3. Cone slump = 0 cm (W/C = 0.78).
To regulate the workability of the mixture, the cement consumption was increased to 450 kg/m³ in composition 3. The sand fraction used was 0.16 mm. The slump was 11 cm at a water/cement ratio of 0.8. The mixture did not segregate.
Figure 2 shows the sediment of a cone of composition 3 with mobility P3 (sediment – 11 cm), where slight sedimentation of water can be observed, but the mixture does not stratify, that is, all components (cement, sand, crushed stone) create a dense cohesive structure.
Composition 4 was prepared using a 1.25 mm sand fraction. Cement consumption was 450 kg/m3. The slump was 19.5 cm at a water/cement ratio of 0.57. The mixture has a non-cohesive granular structure.
To improve strength characteristics, the cement consumption in compositions 5, 6, and 7 was increased to 500 kg/m3. This resulted in concrete with a strength of 41.1 MPa (composition 6), in which 0.315 mm sand was used as the middle fraction. Subsequent compositions were prepared using this sand fraction.
In compositions 8 and 9, the coarse fraction consumption was reduced: crushed stone screenings to 650 kg/m3, sand of 1.25 fraction to 244 kg/m3, while the fine fraction
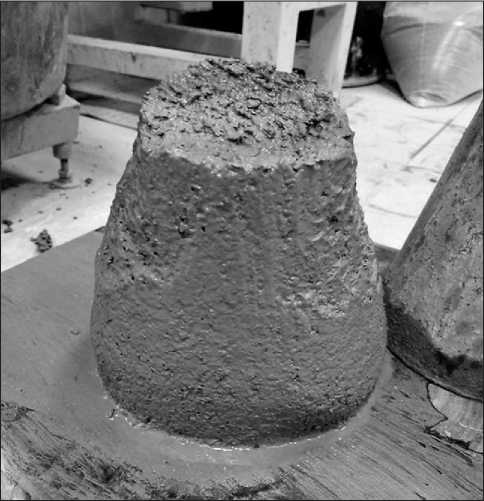
Fig. 2. Sedimentation of cone composition 3
content increased. At a water/cement ratio of 0.4 (composition 8), the mixture was stiff and incoherent, crumbling when tested for slump. Further increases in water content led to stratification of the mixture.
Compressive strength tests of all compositions were conducted on 100×100×100 mm cube specimens. After molding, the specimens were cured at a temperature of 20±5 °C and a relative humidity of 95±5%. Testing was conducted in accordance with GOST 26633-2015 “Heavyweight and Fine-Grained Concrete. Specifications.” The compressive strength test results for the compositions (Table 4) are presented in Figure 3.
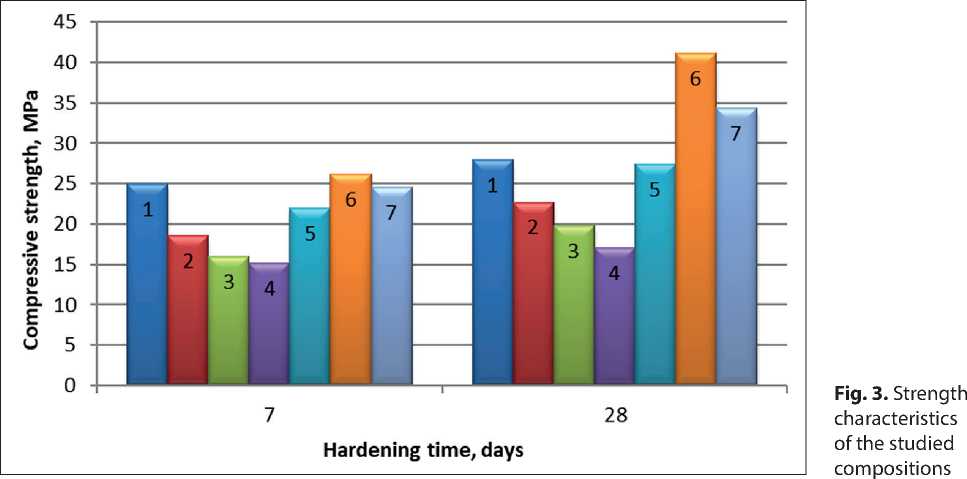
SYSTEM SOLUTIONS FOR TECHNOLOGICAL PROBLEMS
Concrete compositions lacking an “intermediate link” in the form of medium-sized sand exhibit reduced strength values compared to compositions containing both coarse particles (crushed stone screenings, sand with a 1.25 mm fraction) and fine particles (sand with a 0.315 mm and 0.16 mm fraction), as well as a complex additive consisting of micro- and nanosized particles. This creates optimal intergranular voids in the concrete. The density of these concretes ranges from 2100 to 2300 kg/m3.
Next, to obtain more workable mixtures, the plan was recalculated. The proportion of coarse aggregate (1.25 mm) was set at 0.4. The consumption of coarse aggregate (2.5-5 mm fraction) was set at 1100 kg/m3. Water consumption was determined experimentally, with a specified slump of 12–16 cm.
The verified experimental plan for selecting the particle size distribution of fine aggregate – in relative proportions – is presented in Table 5. This matrix fills the ternary diagram by fractions with 10 points.
To improve the homogeneity and cohesion of the mixtures, it was necessary to increase the proportion of mortar. To this end, the proportion of coarse sand fractions was reduced and the proportion of fine fractions was increased in all subsequent formulations. Quartz flour was also added to the mixture as a microfiller. The concrete mixture compositions are presented in Table 6.
The following mixture components were used: cement – 500 kg/m3, crushed stone screenings – 450 kg/m3, sand of 1.25 mm fraction – 192 kg/m3, sand of 0.315 mm fraction – 769 kg/m3, and the addition of quartz flour to the composition, allowed us to obtain a composition with a mixture flow of 50 cm with a W/C ratio of 0.46 (composition 10). The mixture flowed quite uniformly, without segregation, which may indicate a high degree of cohesion between the mixture particles (Fig. 4). The strength in this case was 49 MPa after 28 days of curing.
To reduce binder consumption, compositions 11 and 12 were prepared. The cement consumption in these compositions was 360 kg/m3, the quartz flour content was increased to 120 kg/m3, and the w/c ratio was 0.87–0.9. A complex additive was also added. The mixture spread was also 50 cm, but it was uneven (with a mound in the
Table 5. Experimental plan for selecting the granulometric composition of fine aggregate
|
No. |
Fraction 0.16 mm |
Fraction 0.315 mm |
Fraction 0.63 mm |
Fraction 1.25 mm |
|
1 |
0.6 |
0 |
0 |
0.4 |
|
2 |
0 |
0.6 |
0 |
|
|
3 |
0 |
0 |
0.6 |
|
|
4 |
0.2 |
0.2 |
0.2 |
|
|
5 |
0.36 |
0.12 |
0.12 |
|
|
6 |
0.12 |
0.36 |
0.12 |
|
|
7 |
0.12 |
0.12 |
0.36 |
|
|
8 |
0.3 |
0 |
0.3 |
|
|
9 |
0.3 |
0.3 |
0 |
|
|
10 |
0 |
0. 3 |
0.3 |
Table 6. Concrete mix compositions per 1 m3
|
с о 'й О о. о и |
ф £ о о> о> и С Л "U Е ~ ф Ф £ ф 1 5 и И 2 гч U Ь |
м Е а. |
м £ > гм "О <0 |
м Е ю о я (Л |
м £ > и "О <0 (Л |
м Е о я (Л |
м Е и |
и 5 |
и <0 о и |
м Е 4-1 Ф О |
с и |
|
10 |
450 |
500 |
192 |
– |
769 |
– |
17.5 |
– |
0.46 |
50 |
2258 |
|
11 |
484 |
360 |
206 |
– |
827 |
– |
120 |
17 |
0.9 |
50 |
2188 |
|
12 |
426 |
360 |
182 |
– |
728 |
– |
120 |
17 |
0.87 |
58 |
2228 |
|
13 |
396 |
412 |
170 |
– |
795 |
– |
60 |
17 |
0.81 |
77 |
2215 |
SYSTEM SOLUTIONS FOR TECHNOLOGICAL PROBLEMS
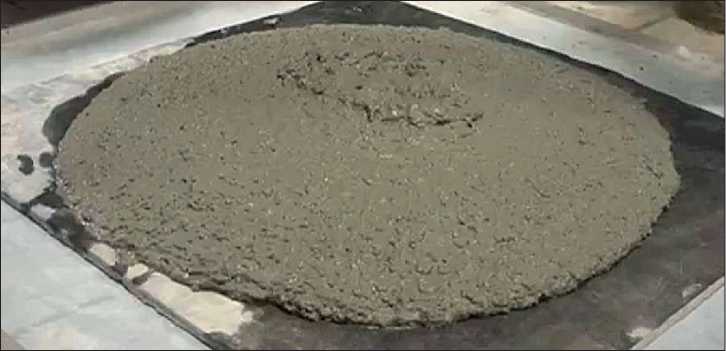
Fig. 4. Mixture spread 50 cm (composition 10)
middle). A decrease in strength properties was also observed (18.8 MPa in 28 days), which may be due to both the low cement content and the high W/C ratio (0.87–0.9).
To achieve more mobile mixtures and evaluate sedimentation, composition 13 was prepared. The amount of cement was increased, while the amount of filler (quartz flour) was reduced to 60 kg/m3. The composition also included a complex additive. At a water/cement ratio of 0.81, the mixture flowed 77 cm. All components of the mixture were uniformly distributed throughout the volume, there was no segregation, and the flow was uniform (Fig. 5).
The compositions were molded without vibration compaction, in accordance with GOST 597142021. Compressive strength tests were conducted on 100×100×100 mm cube specimens. Comparative results for strength gain over curing time for the tested compositions (Table 6) are presented in Figure 6.
Among the studied mixtures, composition 10, with a cement consumption of 500 kg/m3, demonstrated the highest strength (49 MPa after 28 days of curing). Reducing the amount of cement and replacing it with quartz flour microfiller (compositions 11 and 12) resulted in a 40% reduction in strength and an increase in the water/ cement ratio. This increase in water/cement ratio may be due to the fact that quartz flour has a larger specific surface area (474.7 m2/kg) than cement.
In composition 13 with a W/C ratio of 0.81, while the quartz flour content is halved, strength is achieved by reducing the coarse fraction and increasing the 0.315 mm sand fraction. This can be facilitated by optimizing the composition, taking into account the aggregate grain packing density.
Thus, during the calculation and experimental work, input data on the compositions and properties of concrete were obtained to enable the construction of a model for determining the optimal ratio of concrete mixture components and assessing their influence on the specified rheological and strength characteristics.
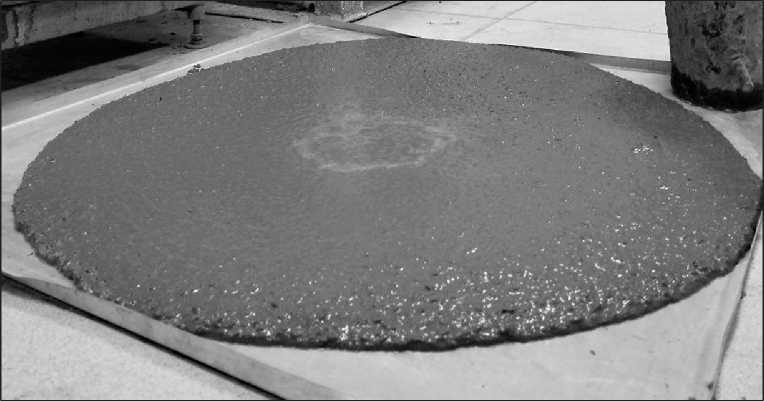
Fig. 5. Mixture spread 77 cm (composition 13)
SYSTEM SOLUTIONS FOR TECHNOLOGICAL PROBLEMS
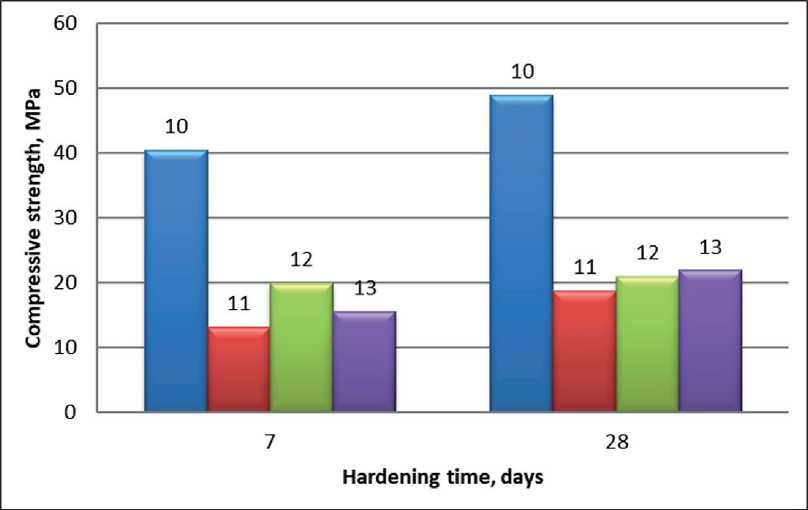
Fig. 6. Strength characteristics of the studied compositions
Construction of a model for calculating the optimal ratio of components of a polyfractional concrete mixture
The modeling method used in this work represents a branch of mathematical planning that expands the class of analytical models that approximate a given data set. Probabilistic approaches to model construction reflect the relationship between the composition of concrete mixtures and their properties.
The sample is constructed either on the basis of factorial experiments or on the basis of physical and mathematical models, which often have a high demand for computational resources. As in the classical method of mathematical planning, the construction of the model begins with the definition of the experimental plan. The object of interest at this stage is the particle size distribution of the fillers; however, if each fraction in the range from 0.16 mm to 20 mm is considered as an independent degree of freedom, the formulation of the problem will inevitably encounter the problem of high dimensionality. Without a priori information on the nature of the influence of each fraction on the properties of interest, it is necessary to include at least 4–5 points in the sample collection plan. The filler used in the study consists of fractions of 0.16; 0.315; 0.63; 1.25; 2.5–5. And, in order to limit the number of variable variables in the model under consideration, the last 2 fractions were fixed. The remaining fractions were distributed according to the ternary diagram (Fig. 7).
The experimental plan corresponding to the distribution of points in Figure 7 and the results of its implementation are presented in Table 7. Repeating compositions in
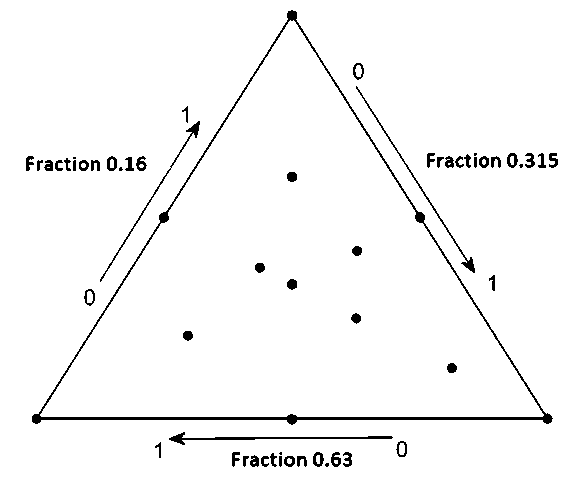
Fig. 7. Distribution of experimental points for constructing a model of the influence of aggregate granulometry
SYSTEM SOLUTIONS FOR TECHNOLOGICAL PROBLEMS
Table 7. Experimental sampling plan
F – sand fraction
SYSTEM SOLUTIONS FOR TECHNOLOGICAL PROBLEMS
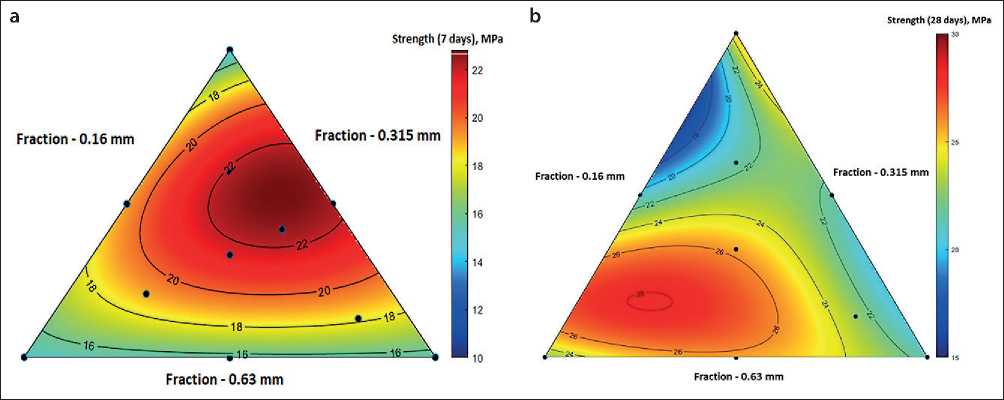
Fig. 8. The dependence of concrete strength on the ratio of sand fractions
the plan are used to control the constancy of the obtained data (repeatability of the experiment).
The distribution structure of the points in the plan is as follows: three points at the vertices of the triangle represent aggregate (in the range of 0.16–0.63 mm), consisting exclusively of one fraction of sand with a particle size of 0.16, 0.315, or 0.63 mm. Points at the halfway point of each side of the triangle represent binary systems with a fraction ratio of 0.5. For example, the point in the middle of the left side of the triangle corresponds to a mixture of sand with particle sizes of 0.16 and 0.63 mm in a 1:1 ratio.
The next step in model construction after implementing the experimental design was selecting an approximating function. One possible option is polynomials of varying orders, and for the 7-day strength data, a second-order polynomial (with a determination coefficient greater than 0.5) successfully represents the model (Fig. 8), allowing one to determine the maximum strength by varying the particle size distribution (Fig. 7).
To estimate the cone spread value and strength on the 28th day, the use of polynomials of different orders does not allow us to obtain a reliable descriptive model (in all cases, the coefficient of determination is below 0.5), however, the use of regression based on Gaussian processes allows us to successfully construct it (Fig. 8b, 9).
CONCLUSION
Digital technologies for designing fine-grained concrete formulations are emerging as a promising tool for
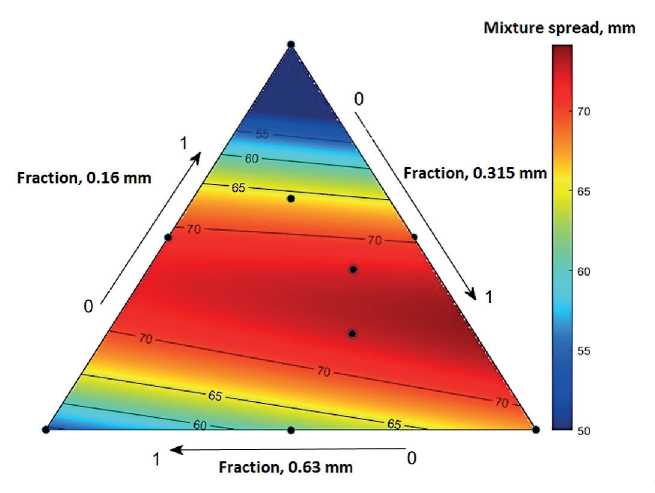
Fig. 9. The dependence of the spread of the concrete mix cone on the ratio of sand fractions
SYSTEM SOLUTIONS FOR TECHNOLOGICAL PROBLEMS enhancing the competitiveness and efficiency of the modern construction industry. The integration of innovative approaches (machine learning) opens new horizons for the construction industry.
The development of digital modeling tools has a significant impact on the quality of the final material, allowing for the achievement of goals with minimal resources and time. Digital concrete mix design models provide accurate predictions of the properties of future materials, simplify
the design of multi-component mixtures, and help avoid errors during the composition development stage.
Development trends in this field are shaping a new era of sustainable development in the construction sector, based on advanced technologies and eco-friendly practices. This results in increased energy efficiency in buildings, a reduced carbon footprint, and improved operational performance, all of which contributes to the long-term sustainability of the entire infrastructure.
