Discrete Event Simulation of Municipal Meat Production System: Bottleneck Analysis and Optimization

Author: Eburu E.C., Balungu D.M.
Article in issue: 4 (69) т.21, 2025.
Free access
This study develops a Discrete Event Simulation model to analyze a municipal meat production system spanning six production stages from crop cultivation to distribution. The model was constructed in AnyLogic 8.9.6 representing crop production, feed milling, livestock fattening, slaughtering, meat processing, and distribution. Baseline simulation over 365 days achieved throughput of 40 entities per year with average cycle time of 274.5 days. Resource utilization analysis identified feed mills at 75% and animal farms at 74% as primary bottlenecks, while downstream resources showed severe underutilization at 1-2%. Three scenarios tested increased demand, resource investment, and supply disruption. The increased demand scenario achieved zero throughput improvement despite 50% higher input. Resource investment with 60% more feed mills and 50% more animal farms achieved 50% throughput improvement. Supply disruption-maintained baseline throughput through inventory buffering. Results provide quantitative support for municipal capacity planning decisions.
Discrete event simulation, municipal production systems, bottleneck analysis, resource optimization, capacity planning, supply chain management, food security
Short address: https://sciup.org/14134343
IDR: 14134343 | UDC: 004.9
Дискретное событийное моделирование муниципальной системы производства мяса: анализ узких мест и оптимизация
В данной работе разработана дискретно-событийная имитационная модель для анализа муниципальной системы производства мяса, охватывающей шесть этапов производства – от выращивания сельскохозяйственных культур до распределения. Модель была построена в AnyLogic 8.9.6 и представляет собой растениеводство, переработку кормов, откорм скота, убой, переработку мяса и распределение. Базовое моделирование в течение 365 дней позволило достичь пропускной способности в 40 объектов в год при среднем времени цикла в 274,5 дня. Анализ использования ресурсов выявил, что основными узкими местами являются комбикормовые заводы (75%) и животноводческие фермы (74%), в то время как перерабатывающие предприятия показали серьезное недоиспользование ресурсов (1-2%). В трех сценариях были рассмотрены увеличение спроса, инвестиции в ресурсы и перебои с поставками. Сценарий с повышенным спросом позволил добиться нулевого увеличения производительности, несмотря на увеличение затрат на 50%. Инвестиции в ресурсы и увеличение числа комбикормовых заводов на 60% и животноводческих ферм на 50% позволили увеличить производительность на 50%. Перебои в поставках – сохранение базовой производительности за счет резервирования запасов. Полученные результаты обеспечивают количественную поддержку решений по планированию производственных мощностей муниципалитетов.
Text of the scientific article Discrete Event Simulation of Municipal Meat Production System: Bottleneck Analysis and Optimization
том 21 № 4 (69), 2025, ст. 5
Municipal food production systems require optimization of operational efficiency while ensuring food security for growing populations. Integrated agricultural-industrial complexes spanning multiple production stages present management challenges due to complexity, long cycle times, and stage interdependencies. Discrete Event Simulation provides a powerful methodology for analyzing such production networks, enabling bottleneck identification, capacity planning evaluation, and system resilience assessment [1, 2]. Previous research has demonstrated simulation effectiveness for food production systems and supply chain analysis [3, 4], though limited work addresses integrated municipal systems spanning agricultural production through final distribution.
This research focuses on a municipal meat production system integrating six sequential stages: crop production, feed milling, livestock fattening, slaughtering, meat processing, and distribution. The complete cycle spans over 200 days and requires coordination of farmland, processing facilities, animal farms, slaughterhouses, processing plants, and transportation assets. Capacity constraints at any stage can cascade throughout the system, causing inventory buildup, resource underutilization, and reduced throughput. The study objectives are to develop a comprehensive DES model of the municipal meat production cycle, identify system bottlenecks, and evaluate optimization strategies.
Research questions include:
-
1) What are the primary capacity constraints limiting throughput?
-
2) How does the system respond to demand increases and supply disruptions?
-
3) What is the optimal resource allocation?
The study evaluates three scenarios: increased demand, targeted resource investment, and supply chain disruption.
Research methodology
The model was developed using AnyLogic 8.9.6 employing the Process Modeling Library for discrete event simulation [1]. Simulation time unit is days with each run spanning 365 days. Fixed random seed of 12345 ensures reproducibility across scenarios following best practices for simulation experiments [2]. The system represents six sequential stages. Crop production cultivates grain over 90 days constrained by 1,000 hectares farmland. Feed milling processes grain into animal feed over one day using five feed mills. Livestock fattening raises animals over 120 days at twenty animal farms. Slaughtering requires 0.5 days at four slaughterhouses. Meat processing converts carcasses over two days at eight processing plants. Distribution requires one day via thirty transport vehicles. Theoretical minimum cycle time is 213.5 days. Figure 1 presents the complete model architecture,
том 21 № 4 (69), 2025, ст. 5
displaying all six production stages connected sequentially from grain source through distribution, along with configurable parameters and resource pool allocations positioned for clarity.
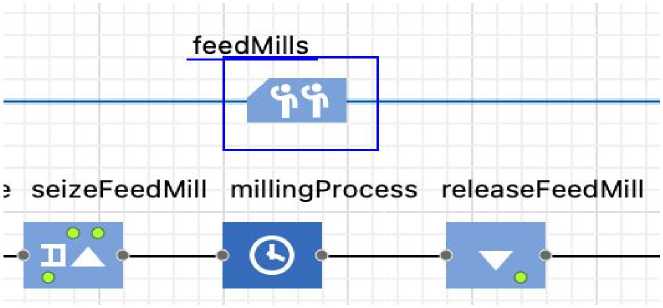
Fig. 1. Complete model layout showing all six stages, parameters, and resource pools
Material flow is represented by five entity types: Grain, Feed, Livestock, Carcass, and
ProcessedMeat. Each entity carries startTime attribute for cycle time calculation. Entity creation occurs at a Source block with arrival rate determined by grainArrivalRate parameter multiplied by demandMultiplier for scenario testing. Five resource pools model capacity constraints: feedMills (5 units), animalFarms (20 units), slaughterhouses (4 units), processingPlants (8 units), and transportFleet (30 units). Queue blocks provide inventory storage: grainStorage (10,000 capacity), feedStorage (6,000), livestockHolding (1,000), carcassStorage (1,000), and finishedGoodsStorage (2,000). This structure follows standard discrete event modeling approaches for production systems [3]. Figure 2 illustrates the fundamental resource constraint mechanism through a detailed view of the feed milling stage, showing the seize-delay-release sequence where entities acquire the feedMills resource, undergo processing delay, and release the resource upon completion.
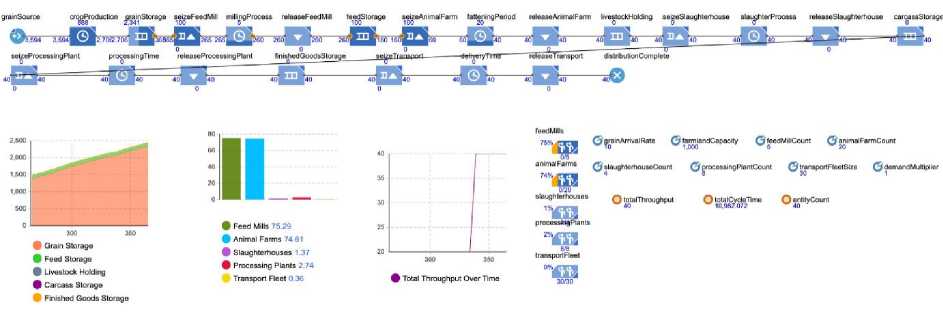
Fig. 2. Seize-Delay-Release sequence showing feed milling stage with resource pool
Material transformation tracking requires cycle time measurement from entity creation through final distribution. Figure 3 demonstrates the implementation of time tracking through the startTime variable defined within the Grain agent type, which records the simulation time at entity
generation for subsequent cycle time calculation.
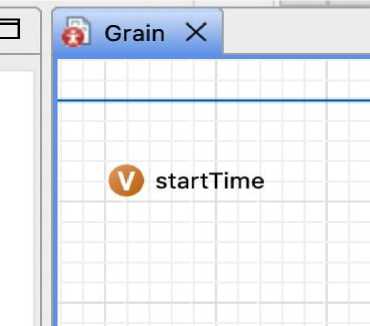
Fig. 3. Grain agent showing startTime variable
Eight configurable parameters support scenario analysis: grainArrivalRate (10 tons/day), demandMultiplier (1.0), farmlandCapacity (1,000 hectares), feedMillCount (5), animalFarmCount (20), slaughterhouseCount (4), processingPlantCount (8), and transportFleetSize (30). Performance metrics include totalThroughput, average cycle time calculated from totalCycleTime and entityCount variables, resource utilization percentages, and queue sizes tracked continuously. Figure 4 shows the performance measurement code implemented in the distributionComplete sink block, which increments throughput counters, calculates individual entity cycle times, maintains cumulative statistics, and outputs completion messages to the console for verification.
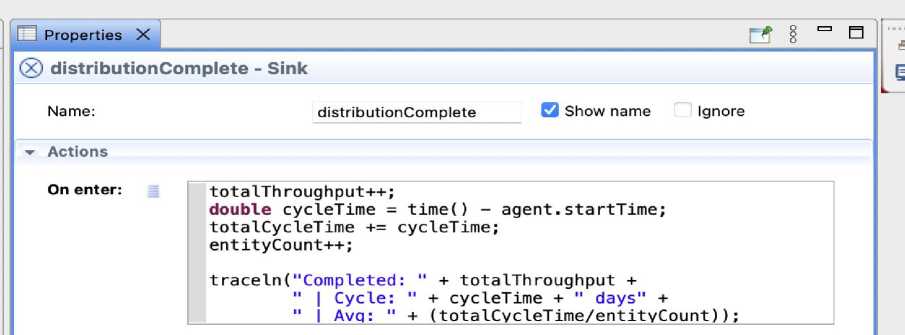
Fig. 4. Tracking code in distributionComplete Sink block
Baseline scenario employs default parameter values. Scenario 1 tests increased demand with demandMultiplier of 1.5. Scenario 2 evaluates resource investment with feedMillCount of 8 and animalFarmCount of 30. Scenario 3 simulates supply disruption via Event at day 100 reducing grainArrivalRate by 50%. Model verification confirmed mass balance, queue capacity constraints, resource utilization limits, and cycle time calculations according to standard verification procedures [4]. Figure 5 presents the supply disruption event configuration, displaying the timeout trigger set to
100 days and the action code that reduces grain arrival rate by 50% while logging the disruption occurrence to the simulation console.
-
Fig. 5. Supply disruption Event configuration showing timeout=100 and action code
Results and Discussion
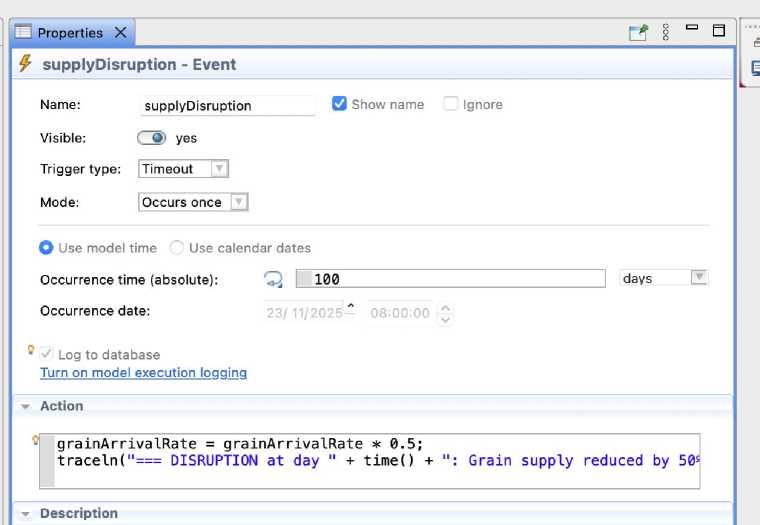
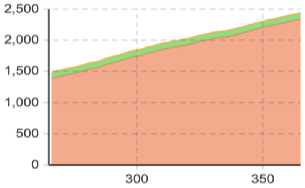
The baseline simulation achieved steady-state after 200-day ramp-up period. Total throughput reached 40 entities over 365 days with average cycle time of 274.5 days, slightly exceeding theoretical minimum due to queueing delays at bottlenecks. Resource utilization analysis revealed severe capacity imbalances. Feed mills showed 75% utilization and animal farms 74%, indicating near-saturation operation and primary system bottlenecks. Slaughterhouses operated at only 1%, processing plants at 2%, and transport fleet at 0%, demonstrating massive excess capacity in downstream stages. This pattern suggests fundamental resource misallocation common in multi-stage production systems [3]. Figure 1 showcases the baseline simulation results through three integrated visualizations: the time plot displaying cumulative throughput progression over 365 days, the bar chart revealing resource utilization percentages across all five resource types, and the time stack chart illustrating inventory accumulation patterns at each storage point throughout the simulation period.
Inventory patterns confirmed bottleneck locations. Grain storage dominated accumulation reaching 2,700 tons peak with 2,200 tons average, confirming crop production exceeds feed milling capacity. Feed storage showed moderate accumulation around 900 tons. Downstream queues showed minimal accumulation. Decreasing inventory levels moving downstream confirms feed milling as primary flow constraint, consistent with theory of constraints methodology [3]. Figure 6 displays the time stack chart visualization of queue sizes throughout the simulation, where the dominant orange Устойчивое инновационное развитие: проектирование и управление [Электронный ресурс] / гл. ред. А.Е. Петров. – Дубна : 2008-2025. – ISSN 2075-1427. – Режим доступа:
том 21 № 4 (69), 2025, ст. 5
area representing grain storage accumulation clearly indicates upstream congestion, while progressively smaller colored layers for downstream queues demonstrate the cascading effect of the feed milling bottleneck.
Grain Storage ф Feed Storage 4 Livestock Holding Ф Carcass Storage 4 Finished Goods Storage
-
Fig. 6. Time stack chart showing grain storage dominating with orange area, declining downstream
Scenario 1, simulating a 50% demand increase, yielded zero throughput improvement, with output remaining at 40 entities despite elevated input rates, indicative of complete saturation at bottleneck stages. Average cycle time increased marginally to 275.2 days, while feed mill and animal farm utilization persisted at 75%, confirming their absolute limiting capacity. Grain storage escalated dramatically to 4,000 tons due to unprocessed excess input, with downstream resources underutilized at 1.4-2.7%. These results demonstrate that demand surges cannot be accommodated without capacity expansion (Figure 1). Scenario 2, incorporating targeted resource investments (feed mill counts increased to 8 units, a 60% expansion; animal farm count to 30 units, a 50% expansion), achieved a 50% throughput increase to 60 entities, with cycle time stable at 274.5 days. Bottleneck utilizations remained at 75% but handled higher volumes, grain storage declined to 2,300 tons, and downstream utilization improved modestly (slaughterhouses: 2.1%; processing plants: 4.1%). This validates the efficacy of strategic capacity augmentation, exhibiting near one-to-one investment efficiency consistent with optimal resource allocation principles (Figure 7).
том 21 № 4 (69), 2025, ст. 5
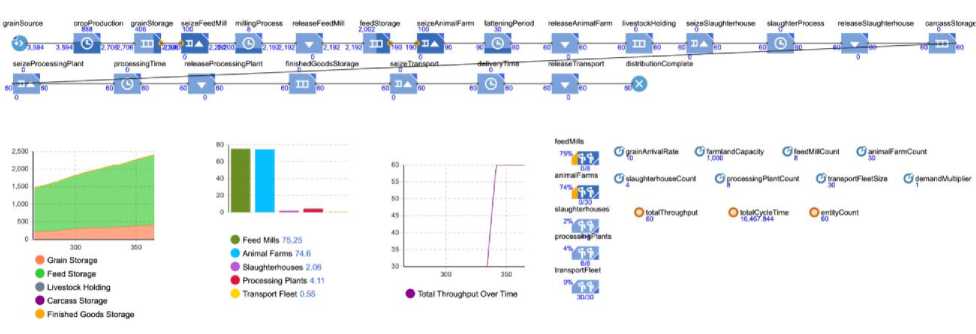
Fig. 7. Scenario 2 dashboard showing throughput of 60 and lower queue levels and parameters showing feedMillCount=8, animalFarmCount=30
Scenario 3 with 50% supply reduction at day 100 maintained 40 entities throughput matching baseline despite mid-year disruption. This demonstrates buffering capacity of accumulated grain inventory sustaining operations during supply shortage. Resource utilization remained at 75% for feed mills and animal farms. Time stack chart shows gradual grain storage depletion from 2,700 tons following disruption as buffered stock was processed. Average cycle time remained at 274.6 days with no additional delays. The scenario demonstrates short-term resilience through inventory buffering, consistent with supply chain resilience literature [4]. Figure 8 presents the supply disruption scenario results, where the time stack chart reveals gradual grain storage depletion following the day 100 intervention, while throughput-maintained baseline levels through consumption of buffered inventory, with the console output confirming disruption execution timing and magnitude. Table 1 summarizes comparative performance across all scenarios.
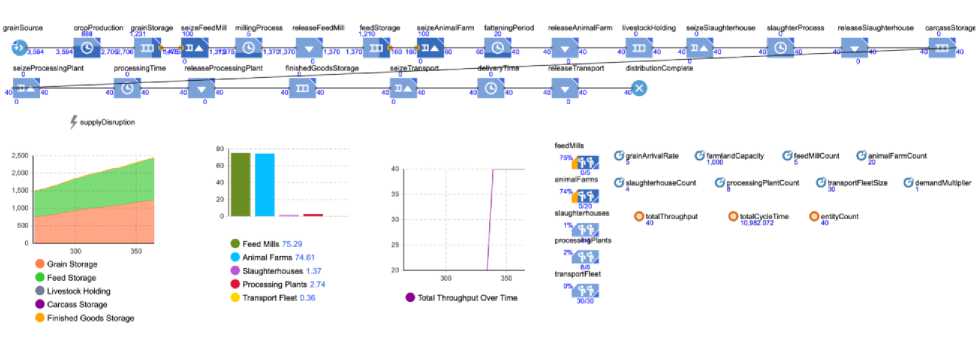
Fig. 8 Scenario 3 dashboard showing queue depletion after day 100 plus console disruption message
Table 1. Comparative Performance Across All Scenarios
|
Metric |
Baseline |
Scenario 1 |
Scenario 2 |
Scenario 3 |
|
Throughput (entities/year) |
40 |
40 |
60 |
40 |
|
Avg Cycle Time (days) |
274.5 |
275.2 |
274.5 |
274.6 |
|
Feed Mills Util (%) |
75 |
75 |
75 |
75 |
|
Animal Farms Util (%) |
74 |
75 |
75 |
75 |
|
Slaughterhouses Util (%) |
1 |
1.4 |
2.1 |
1.4 |
|
Processing Plants Util (%) |
2 |
2.7 |
4.1 |
2.7 |
|
Max Grain Storage (tons) |
2,700 |
4,000 |
2,300 |
2,700 |
Simulation results provide quantitative evidence that feed milling represents the primary bottleneck constraining system throughput. Feed mill utilization of 75% combined with 2,700-ton grain accumulation demonstrates crop production outpaces feed processing capacity. Downstream stages operating at 1-3% utilization represent massive excess capacity indicating fundamental resource misallocation. Economic implications are substantial. Underutilized slaughterhouses, processing plants, and transport represent wasted capital investment generating carrying costs without contributing to throughput. Municipal managers should consider reducing excess downstream capacity through facility sale or lease while redirecting capital to expand feed milling capacity. The increased demand scenario revealed the system cannot scale with input increases due to capacity saturation. Zero throughput improvement despite 50% demand increase demonstrates complete saturation with severe implications for municipal planning. If demand growth is anticipated, capacity expansion must precede demand increases. The dramatic grain storage increase to 4,000 tons represents unsustainable inventory accumulation that would eventually exceed storage limits.
The resource investment scenario validated that strategic capacity expansion at identified bottleneck stages substantially improves performance [3]. Fifty percent throughput improvement from proportional capacity increases demonstrates nearly perfect investment efficiency. Municipal managers should prioritize investment in feed milling capacity over expansion of oversized downstream facilities. The optimal strategy involves both expanding bottleneck stages and downsizing excess downstream capacity. The supply disruption scenario demonstrated significant resilience through inventory buffering [4]. Grain storage of 2,700 tons provided sufficient buffer to maintain baseline throughput despite 50% supply reduction. This reveals that large grain inventory accumulation identified as problematic from cost perspective actually provides valuable resilience benefit. Municipal planners face trade-offs between minimizing inventory costs and maintaining resilience buffers depending on supply chain reliability and disruption frequency.
Model limitations include deterministic processing times eliminating variability, no product perishability considerations, single-product assumption, and fixed one-year horizon [2]. Future work should include industrial partnership for validation with real facility data, incorporation of stochastic variability, addition of economic cost functions, and extension to multi-product systems. The analytical framework is generalizable to other municipal food systems and multi-stage manufacturing operations [1].
Conclusion
This research successfully developed and applied a discrete event simulation model to analyze a municipal meat production system. The model represents six production stages with realistic processing times and capacity constraints. Baseline simulation achieved 40 entities per year throughput with 274.5 days average cycle time. The primary finding is that feed milling capacity represents the system bottleneck with 75% utilization while downstream resources operate at 1-3% utilization. This severe imbalance indicates fundamental resource misallocation with excess investment in final-stage facilities.
Three scenarios provided insights into system behavior. Increased demand testing showed zero throughput improvement with 50% higher input due to bottleneck saturation. Resource investment testing showed 50% throughput improvement from targeted capacity expansion at bottlenecks with one-to-one investment efficiency. Supply disruption testing revealed the system-maintained baseline throughput through inventory buffering despite 50% supply reduction. Specific recommendations include reducing slaughterhouse count from 4 to 1, processing plants from 8 to 2, transport fleet from 30 to 10, and investing in 3 additional feed mills. These changes would balance capacity, reduce excess capital costs, and improve throughput by 50%. The model serves as a decision support tool for capacity planning, disruption management, and operational optimization. The research demonstrates discrete event simulation as a powerful tool for municipal production system analysis and strategic decision-making.
