Dynamics of the structural transformation of the real economy of the Republic of Armenia in the context of shifting industrial paradigms

Author: Tigranyan V.I., Papian Z.K., Manukyan L.A.
Journal: Economic and Social Changes: Facts, Trends, Forecast @volnc-esc-en
Section: Global experience
Article in issue: 2 т.19, 2026.
Free access
This article examines the structural transformation of the Republic of Armenia's real economy within the context of shifting industrial paradigms. In small open economies, structural changes and digitalization intensify under the influence of external shocks, necessitating a quantitative assessment of their contribution to output dynamics. This study aims to determine the extent to which changes in the sectoral structure, employment, and labor productivity align with the logic of transitioning from Industry 3.0 to the emerging elements of Industry 4.0 and the prerequisites for Industry 5.0. The research introduces scientific novelty by integrating comparative and systemic-structural analysis with econometric verification using an ARDL model. This approach includes adjusting for atypical shock periods with a dummy variable and accounting for changes in the internal structure of the ICT indicator. The empirical analysis draws on data from national statistics and international sources covering 2008–2025. The methodology employs statistical and comparative analysis, stationarity tests, the ARDL bounds test, an error correction model, and diagnostic and stability tests. The findings reveal that the transformation has been predominantly adaptive in nature, with limited potential for deeper technological advancement due to low R&D investment and weak technology transfer mechanisms. A limitation of this study is its reliance on aggregated macro-indicators and proxy variables, which opens avenues for future research involving a more detailed sectoral assessment of the Armenian economy's alignment with the demands of Industry 5.0.
Real sector, industrial revolution, Industry 3.0, Industry 4.0, Industry 5.0, ARDL model, labor productivity
Short address: https://sciup.org/147253872
IDR: 147253872 | UDC: 338.1, 338.4 | DOI: 10.15838/esc.2026.2.104.13
Text of the scientific article Dynamics of the structural transformation of the real economy of the Republic of Armenia in the context of shifting industrial paradigms
The history of human societies is characterized by an alternation of evolutionary and revolutionary changes. The evolutionary type of transformation involves gradual and slow shifts, whereas the revolutionary type is associated with drastic сhanges that form new foundations for socio-economic development. The most striking manifestations of the second type are industrial revolutions.
Over the previous 40,000 years, technological progress has demonstrated steady hyperbolic growth with periodic fluctuations. Within the framework of ultra-long cycles, the phases of accumulation and origin of innovations are replaced by phases of their rapid spread and improvement (Grinin et al., 2020). The pace of technological development has become exponential since the middle of the 20th century: several technological paradigms can change within one human generation (Dzyubenko, 2020).
In parallel with the acceleration of scientific and technological progress in recent decades, the frequency of crises of various origins has increased – economic, financial, social, and political. In times of crisis, innovation often serves as an anticrisis mechanism, accelerating the adaptation of economies to new conditions and stimulating digitalization processes (Brem et al., 2023). Those countries that are able to quickly adapt to changes in the external economic environment not only reduce the negative impact of shocks, but also gain additional opportunities for accelerated growth.
After gaining independence in 1991, the Republic of Armenia faced the need to move from a centrally planned economy to a market system in the context of deep transformational crises. While personal computers, the Internet, and new software platforms were actively spreading in developed countries, Armenia had to face the challenges of institutional and structural transformation. This objectively led to temporary technological isolation and a decrease in the speed of integration into global processes. Currently, to compensate for the lag, the country is forced to rapidly implement digitalization, which will allow digital technologies and infrastructure to be introduced and disseminated in the domestic market.
The strength of the Armenian economy is the high level of human capital quality: a significant proportion of highly qualified specialists forms the basis for the development of sectors related to information technology and high-tech production. However, the continuing gap between global technological trends and domestic opportunities limits the country’s technological competitiveness.
Understanding the logic of changing industrial revolutions and correlating them with the current state of the national economy is the key to an objective assessment of the level of development of countries, as well as to the formation of strategies for its modernization and integration into the global economy. In this regard, it was decided to conduct a study of the real Armenian economy in the context of industrial revolutions.
In the context of the accelerating digital transformation and the increasing frequency of exogenous shocks, the analysis of structural changes in the real economy of small open economies is of particular importance. For Armenia, which is in the late stage of Industry 3.0 and adapting to the elements of Industry 4.0, the key is not only the pace of economic growth, but also the nature of the redistribution of added value, employment and labor productivity between sectors of the economy.
The aim of our study is to analyze the structural transformation of the real economy of the Republic of Armenia in changing industrial paradigms and to assess the impact of digitalization, employment and labor productivity on the dynamics of output in the short and long term. To achieve this aim, the article uses a combination of structural analysis and econometric modeling based on the ARDL approach.
Materials and methods
The methodological basis of the research includes general scientific and special methods of economic analysis, including comparative, system-structural, statistical and econometric approaches. The research object is the real economy, determined in accordance with the methodology of the Statistical Committee of the Republic of Armenia. The time range of the study is 2008–2025, while some of the indicators are analyzed for the period 2012–2025 in connection with the transition to the methodology of the 2008 SNA. The empirical base of the study includes official statistical data from the Statistical Committee of the Republic of Armenia (Armstat), the Central Bank of the Republic of Armenia (CBA), the World Bank Group (WBG), the International Monetary Fund (IMF), the United Nations (UN), as well as the results of calculations and testing of the constructed models obtained by us during the study.
To quantify the impact of structural factors on the dynamics of the real Armenian economy, the method of the autoregressive distributed lag (ARDL) was used, which allows simultaneous analysis of short- and long-term effects in the presence of variables of different integration order.
Path of transformation from Industry 1.0 to Industry 6.0
In world economic history, there are several stages of technological transformation associated with industrial revolutions, each of which provided a transition to a new stage of socio-economic development.
The First Industrial Revolution (Industry 1.0, I.1) took place in the second half of the 18th – the middle of the 19th century. Its key result was the transition from an agrarian to an industrial society. Manual labor was replaced by mechanized production, machine tools, factories and manufactories appeared, and the use of waterwheel and steam engine energy became the basis for mass production (Gorodnichaya, 2024).
The Second Industrial Revolution (Industry 2.0, I.2) covers the period from 1870 to the outbreak of the First World War. Its specifics consisted in the improvement of production processes, the introduction of conveyor production, active electrification, as well as the rapid development of transport infrastructure – railway, sea and air transport (Nikolaev et al., 2021).
The Third Industrial Revolution (Industry 3.0, I.3) began in the middle of the 20th century and lasted until the beginning of the 21st century. Its defining characteristics were automation and computerization of production, which ensured an increase in productivity, accuracy and speed of production operations through the introduction of electronic control and data processing systems (Urinson, 2018).
The Fourth Industrial Revolution (Industry 4.0, I.4) started in the 2010s and continues in a number of countries at the present time. Its distinctive features are digitalization, robotization, the use of the Internet of Things (IoT) and artificial intelligence technologies. The I.4 concept is closely related to NBIC convergence (Nano-Bio-Info-Cognito), which unites nanotechnology, biotechnology, information technology and cognitive sciences, which opens up opportunities for the creation of new materials, processes and business models (Heilala, Singh, 2023; Babkin et al., 2023). While the development of the first three revolutions occurred with linear acceleration, the fourth is characterized by an exponential impact on the economy and society (Urinson, 2018).
The Fifth Industrial Revolution (Industry 5.0, I.5) began taking shape in 2020 in the context of deepening globalization. Its concept is related to the SCBIN convergence (Socio-Cognito-Bio-Info-Nano), which combines social, cognitive, biological, information and nanotechnology (Babkin et al., 2021). The main goal of I.5 is to integrate human creativity with the effectiveness of robotics for the personalization and flexibility of production processes, which ensures the transition to customized production (Gorodnichaya, 2024; Chourasia et al., 2022). This stage is expected to be completed by 2050.
The Sixth Industrial Revolution (Industry 6.0, I.6) is projected to begin around 2050. Its main characteristics will be customer orientation, flexible and dynamic supply chains, automated systems with a high degree of adaptability, as well as integrated value creation networks operating both within national economies and internationally (Babkin et al., 2025; Chourasia et al., 2025). Since it is considered as a promising scenario, in this study it is used only as a context, not acting as an object of empirical verification.
Thus, consideration of the evolution of industrial revolutions makes it possible to identify key areas of transformation of production systems on a global scale. We analyzed the dynamics of the development of the real economy of the Republic of Armenia to assess the possibilities and limitations of adapting these trends in the national context.
Dynamics of development of the real Armenian economy
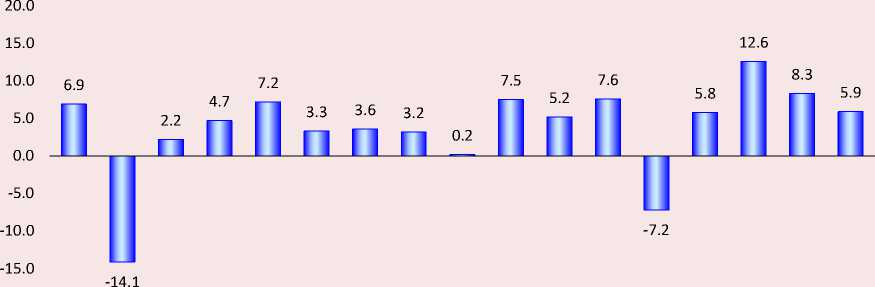
Figure 1 shows the dynamics of real GDP growth in the Republic of Armenia in 2008–2024. The deepest declines in total GDP were recorded in 2009 (-14.10 p.p. against the background of the global financial and economic crisis) and in 2020 (-7.20 p.p. due to the COVID-19 pandemic). In 2016, in the context of the regional currency crisis, the increase was only 0.20 p.p., which indicates the stagnation and preservation of the technological
Figure 1. Real GDP growth in 2008–2024, % compared to previous year
-20.0
Sources: Armstat, databases, national accounts.
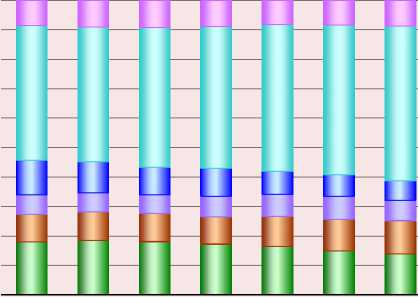
Figure 2. Structure of Armenia’s GDP by economic sector in 2012–2024, % of GDP
100.0
90.0
80.0
70.0
60.0
50.0
40.0
30.0
20.0
10.0
0.0
2012 2013 2014 2015 2016 2017 2018 2019 2020 2021 2022 2023 2024
-
□ Agriculture
-
□ Building
-
□ Manufacturing industry
-
□ Services
-
□ Rest of the industry
-
□ KIUFP and taxes
-
Sources: Armstat, databases, national accounts.
base typical of Industry 3.0. Significant growth occurred in 2022 (+12.60 p.p. by 2021) due to capital inflows, the expansion of the ICT sector and accelerated digitalization, reflecting the transition to Industry 4.0. In 2024, the growth rate slowed to 5.90 p.p., indicating the need to move to a more sustainable and human-centered 5.0 Industry model.
Significant changes were observed in the sectoral structure of Armenia’s GDP during the period under review ( Fig. 2 ), reflecting the redistribution of added value between key sectors of the economy. The share of agriculture decreased from 17.91 to 7.81% in 2012–2024, while the share of the service sector increased from 45.70 to 61.99%, consolidating its dominant position.
At the same time, the share of the manufacturing industry remained relatively stable (9–12%), amounting to 10.16% in 2024, which indicates the absence of large-scale shifts toward deepening production processes and technological renewal. The rest of the industry (mining, energy, water supply and waste processing) accounted for a total of 5.63% of GDP in 2024, maintaining a predominantly infrastructural and resource-oriented nature.
The growing role of services against the background of a shrinking agricultural sector generally corresponds to the transition to a postindustrial sectoral structure, but quantitative changes are not fully accompanied by comparable qualitative changes. A significant part of services is developing on the basis of limited implementation of modern technological and digital solutions, which constrains labor productivity growth and does not allow interpreting the observed shifts as a complete transition to a model consistent with the principles of Industry 4.0. As a result, the transformation is predominantly adaptive in nature and reflects a redistribution of economic activity without significantly increasing the technological depth of production and services.
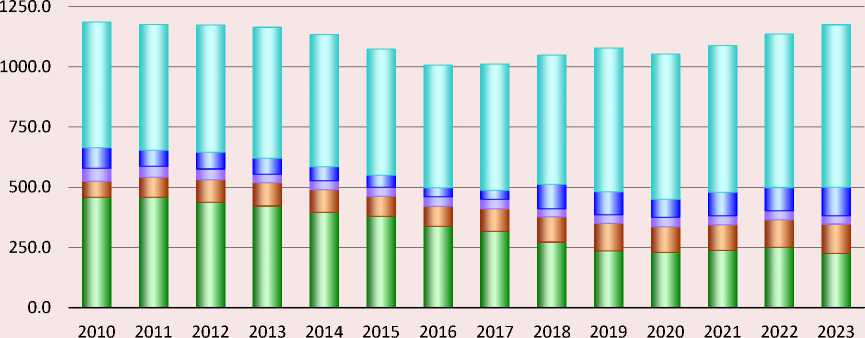
Changes in the employment structure in 2010– 2023 ( Fig. 3 ) increased the trend of redistribution of labor resources between sectors of the economy, reflecting the processes of structural adaptation of the real economy. The number of people employed in agriculture decreased from 457.4 thousand to 225.4 thousand (-50.7%) and was redistributed to other sectors. At the same time, employment in the service sector increased from 521.4 thousand to 674.6 thousand people (+29.4%), which corresponds to an increase in the importance of the service sector in the structure of the economy. The highest relative increase in employment was observed in the manufacturing industry – from 68.0 thousand to 121.5 thousand people (+78.7%), however, it should be interpreted primarily as a result of the recovery and expansion of production and the redistribution of labor. Such dynamics may partially
Figure 3. Employment of the population by economic sector in 2010–2023, permanent population aged 15–74 years, 1,000 people, annual average
□ Agriculture □ Manufacturing industry □ Rest of the industry □ Building □ Services
Sources: Armstat, databases, labor force survey.
reflect technological renewal, but the available grounds are insufficient to conclude that the industry is undergoing a large-scale modernization. Employment growth in construction (from 85.8 thousand to 118.4 thousand people (+38.0%)) was mainly cyclical and was driven by both the implementation of infrastructure projects and the expansion of demand in the real estate market. A significant role was played by an increase in wages, a change in the terms of the state target program “Affordable Housing for Young Families”, as well as the introduction of an income tax refund mechanism in the amount of interest payments received on a mortgage loan when buying real estate on the primary market. The combined effect of these factors stimulated demand for mortgages and rising housing prices, which, in turn, supported an increase in supply in the real estate market and increased activity in the construction sector.
Taken together, the identified shifts indicate a departure from the agrarian-oriented model and the formation of a more diversified employment structure with the leading role of the service sector. At the same time, the qualitative characteristics of jobs and the level of technological equipment suggest a transitional phase of structural adaptation rather than an approach to the completed model of Industry 4.0: the redistribution of employment is not accompanied by a comparable increase in technological depth and industrial complexity, which limits the potential for sustained productivity gains in the long term.
Positive dynamics of labor productivity in 2012– 2023 ( Fig. 4 ) reflects an increase in the efficiency of the use of labor resources, but requires a differentiated interpretation by sector. In the economy as a whole, output per employee increased from 3.64 to 5.86 million drams at constant prices in 2012 (+61.0%). The highest increase was recorded in industry as a whole – from AMD 6.35 million to AMD 13.86 million per employee (+118.2%), however, the growth in the manufacturing industry was only 36%, which indicates the continued limited technological depth of processing industries
Figure 4. Output per employee by economic sector in 2012–2023, at constant 2012 prices, million Armenian drams
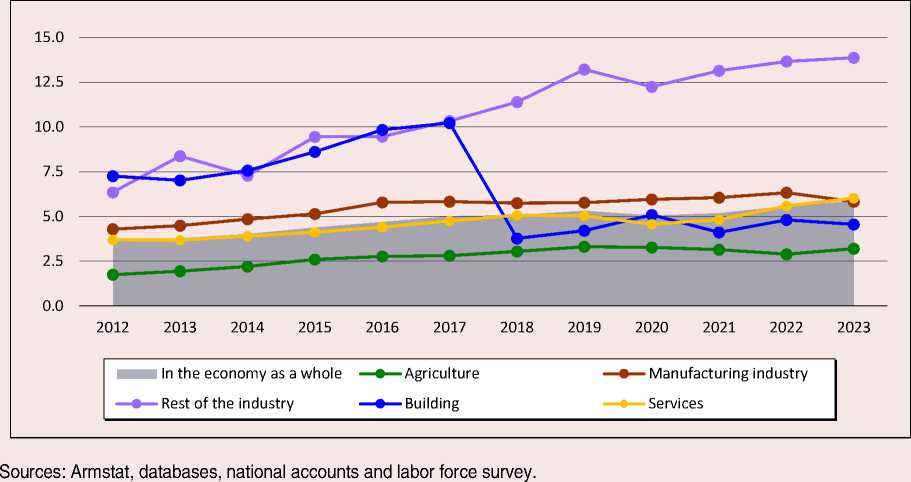
and the importance of extensive factors (changes in output structure, utilization of existing capacities). In agriculture, the 82.9% increase in productivity is largely due to reduced employment, resource redistribution, and technological progress.
In the service sector, output per employee increased by 63.4%, reflecting an increase in the efficiency of certain types of activities, including the use of digital tools and organizational changes, but the heterogeneity of the sector and differences in the technological equipment of its components limit the interpretation of such growth as a systemic effect of digitalization. In construction, productivity dynamics were unstable, due to the high cyclical investment activity, the industry’s dependence on the macroeconomic environment, the development of construction technologies and the improvement of the quality of building materials.
In 2008–2023, the number of people employed with higher education in the Armenian economy increased by 62.0%, from 248.7 thousand to 402.9
thousand ( Fig. 5 ), while the gross enrollment rate of higher education remained relatively stable (43.2– 56.4%). The dynamics indicate an increase in the proportion of workers with a formally confirmed level of higher education, but this indicator alone is not a reliable indicator of the technological development of the economy. International comparisons show that high values of the proportion of people with higher education can be observed in countries with different levels of economic development and technological complexity, which limits the analytical applicability of the indicator without taking into account the quality of education and employment structure.
In this context, the increase in the number of people employed with higher education should be interpreted as the formation of a potential human resource for digital and technological adaptation associated with elements of Industry 4.0, but not as a direct confirmation of the corresponding transition. The realization of this potential is determined by
Figure 5. Number of employed people with higher education and the gross student enrollment rate at the first level of higher education in 2008–2023
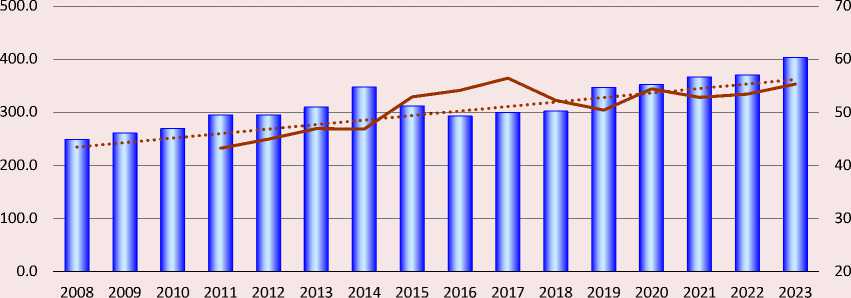
■ ■ Employed, 1,000 people Gross coverage ratio, %
Linear (Gross coverage ratio, %)
Sources: Armstat, databases, labor force survey, education.
the institutional environment, the technological equipment of workplaces and the ability of the real economy to transform human capital into productivity growth and innovation activity. In the absence of stable mechanisms of interaction between the education system, the labor market and business, underutilization of qualifications and a limited effect on structural modernization are possible.
The development of information and communication technologies (hereinafter referred to as the ICT sector) in the Armenian economy reflects the expansion of digital economic activity and the strengthening of the external competitiveness of certain segments of the service sector. Exports of ICT services increased more than tenfold, from 111.61 to 1,180.57 million U.S. dollars in the period from 2008 to 2024 ( Fig. 7 ). The share of ICT services in total exports of services reached 16.07% in 2022 and 20.16% in 2024, which indicates the increasing role of the sector of the country’s foreign economic specializations. At the same time, the growing ICT share in the export of services is not a direct measure of the technological development of the economy as a whole: technological maturity is determined by the scale of implementation of digital solutions in a wide range of sectors of the real economy and their contribution to sustainable productivity growth. At the same time, the steady increase in exports of
Figure 6. Internal financing volume of research and development in 2008–2023
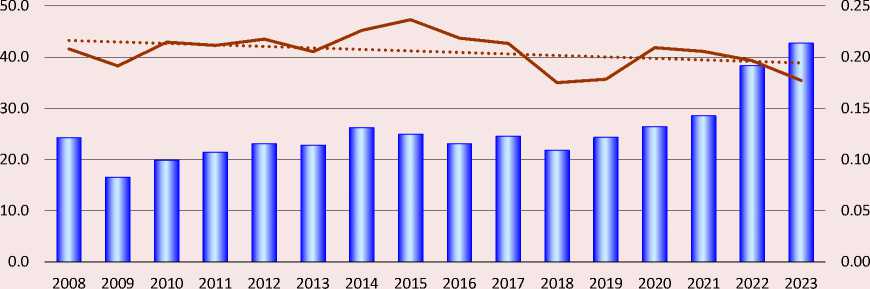
I ■ ■ in million U.S. dollars in % to GDP Linear (in % to GDP)
Sources: Armstat, databases, education and science.
Figure 7. Export volumes of ICT services in 2008–2023
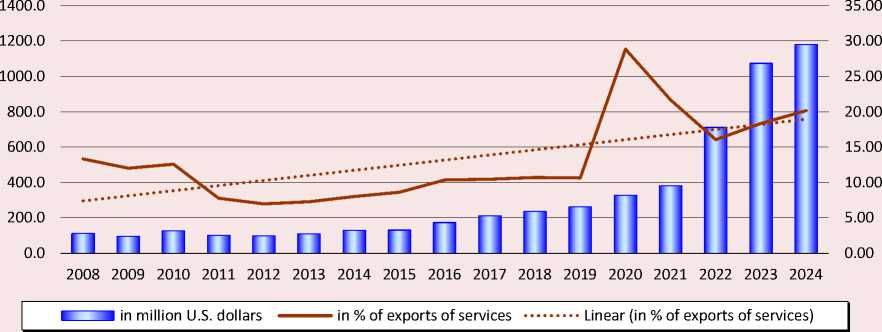
Sources: Central Bank of the Republic of Armenia, databases, balance of payments.
ICT services indirectly indicates the accumulation of technological and human competencies, which, if there are diffusion channels, can support structural modernization outside the ICT sector itself.
The 2020 dynamics are particularly significant, when the share of ICT services in total exports of services increased 2.7 times compared to 2019. Against the background of the restrictions caused by the COVID-19 pandemic, a sharp reduction in the supply of services requiring direct interaction has increased the relative importance of remotely provided services, as a result of which the ICT sector has become a factor in the short-term sustainability and adaptability of the economy, partially compensating for the decline in traditional segments of the service sector.
Thus, the dynamics of the structure of output, employment, labor productivity, and digital activity indicate the transitional and heterogeneous nature of the structural transformation of the real economy of the Republic of Armenia: along with the formation of individual elements of Industry 4.0 and the appearance in certain segments of features correlated with Industry 5.0, lagging industries with characteristics of late Industry 3.0 persist. This leads to the fact that quantitative shifts are only partially accompanied by a comparable qualitative deepening of the technological base and do not ensure a complete transition of the economy from Industry 3.0 to Industry 4.0 at the system level. Econometric modeling is further applied to verify the stability of the identified relationships and assess the contribution of key factors to output dynamics.
ARDL model of the real economy
Since the transition between industrial paradigms at the macro-economic level is manifested not directly, but through a set of indicators, the analysis of the structural transformation of the real economy of the Republic of Armenia requires a quantitative assessment of the factors reflecting the adaptation of the economy to new technological and organizational conditions. Our research conducted a regression analysis using the autoregressive distributed lag (ARDL) to formalize the relationship between the identified structural shifts and the dynamics of output. This type of model is a linear time series model in which dependent and independent variables are taken into account not only in the current period, but also within their lag values.
The ARDL methodology was first proposed by Pesaran and Shin (Pesaran, Shin, 1998), and subsequently refined together with Smith (Pesaran et al., 2001). The general ARDL specification has the form:
к к
V
t
=
^
0
+ ^
P
i
^y
t-i
+ ^
+ P 2 X t-i + 8 t ,
where yt — dependent variable;
-
xt — independent variable;
-
P0 — free term;
P i and 6 i — short-term coefficients;
-
p 1 and cp2 — long-term coefficients; к — maximum lag level in the model;
-
£t — errors (white noise).
According to international research, ARDL models have been successfully applied for both developed and developing countries, as they allow taking into account both stationary and non-stationary variables without strict requirements for their integration order, as well as identifying short-and long-term effects. For instance, Jangid, Bal and Debata have established a positive long-term relationship between digitalization and economic growth in the G-20 countries and a negative shortterm effect (Jangid et al., 2024). At the same time, the development of digital technologies has proved to be particularly significant in the banking and financial sectors, where it increases productivity and reduces information asymmetry, increasing the availability of financial services to the general population.
In contrast, a study by Ngepah, Saba, and Kajewole found a statistically significant negative long-term relationship between the adoption of Industry 4.0 technologies and the added value of the manufacturing industry in South Africa (Ngepah et al., 2024). The authors explain this effect by limited ICT capabilities, insufficient data protection, weak investment in medium- and high-tech industries, as well as institutional gaps in the regulatory system.
The econometric analysis for Armenia was conducted in the EViews 12 program. The quarterly figures of the Statistical Committee of the Republic of Armenia from the first quarter of 2014 to the first quarter of 2025 (45 observations) were used as the database. The choice of time interval is determined by the need to cover key exogenous shocks: the COVID-19 pandemic (2020–2021), the Second Artsakh War (2020), the special military operation (2022–2025), and the resettlement of residents from Artsakh (2023).
Taking into account the aims of the study, the specifics of the available statistical information and the results of a preliminary analysis of the scientific literature, cumulative indicators were used for econometric modeling in relation to the corresponding periods of the previous year ( Tab. 1 ). This approach allows for comparability of time series and reduces the impact of seasonal fluctuations in the analysis of structural changes in the real economy.
The real economy includes 20 sections according to the classifier of economic activities of the Republic of Armenia HD-011-2013, dated
Table 1. Indicators for modeling and their designations
|
Designation |
Variable |
|
GDP |
Real GDP (index) |
|
ICT |
Real growth of activity in the ICT sector (index) |
|
EMP |
Employment growth (index) |
|
PROD |
Real increase in output per employee (index) |
|
DUMMY |
Dummy variable that takes the values 0 and 1 |
|
Source: own compilation. |
|
September 19, 20131, therefore, the study uses the cumulative GDP indicator as a generalized indicator of economic activity and the main identifier of macro-economic effects for an aggregated assessment of the dynamics of structural transformation. Alternative aggregated indicators that allow for a comparable assessment of the cumulative impact of structural and digital factors on the economy as a whole are not available within the framework of available statistics or lead to a bias in estimates. The use of cumulative values is due to the features of publishing data on ICT and IT spheres, which in comparable prices are presented mainly in the form of indices for the corresponding periods of the previous year, which required bringing the remaining indicators to a single dynamics format.
When interpreting the ICT indicator, its internal structure is taken into account: until 2019, telecommunications activity prevailed, which limits the interpretation of ICT as a direct indicator of digitalization, but since 2020, the contribution of the IT segment has increased significantly and currently almost triples the share of telecommunications. At the same time, telecommunications retain their independent importance as the infrastructural basis of digital services and an important element of the modernization of the communication system in the post-Soviet period. Since the ICT sector is classified by NACE Rev.2 is part of GDP, and the statistically significant positive relationship between their dynamics is largely pro-cyclical in nature and reflects the co-directional movement of key components of economic activity. Given the limited number of comparable alternatives, the chosen approach makes it possible to assess the contribution of digital activities to the structural transformation of the real economy without distorting the overall macro-economic dynamics.
A dummy variable ( DUMMY ) was introduced into the model to account for periods characterized by sharp deviations of macro-economic dynamics from the trend due to the impact of exogenous factors of various nature. The variable assumed a value of 1 in the quarters 2020Q2–2020Q3 and 2022Q2–2023Q2 and a value of 0 in all other cases. The choice of the period 2020Q2– 2020Q3 is due to the impact of the COVID-19 pandemic and restrictive measures, which led to a sharp decline in economic activity, disruption of production chains and supply reduction in a number of industries, which corresponds to the phase of the most severe pandemic shock for the real economy. The inclusion of the period 2022Q2–2023Q2 is associated with the combined influence of geopolitical and migration factors (the consequences of the relocation of the population from the Russian Federation, the forced resettlement of the population from Artsakh, the redistribution of foreign economic flows). Despite the high growth rates of GDP in this interval, the dynamics was characterized by asymmetry and structural heterogeneity, accompanied by jumps in individual indicators, a redistribution of supply and demand, as well as changes in the structure of employment and output, which could distort estimates of stable relationships without the introduction of a corrective indicator.
The stationarity of the time series was verified using the extended Dickey –Fuller test. According to the obtained values ( Tab. 2 ), the variables GPD and ICT are stationary at the 10% significance level, while the variables EMP and PROD become stationary after the first difference. In accordance with the assumptions of the ARDL model, it is possible to use variables of different integration order, therefore, all indicators in the form of the first difference were included in the analysis.
Table 2. Values of the extended Dickey – Fuller test
|
Variable |
p-value I(0) |
p-value I(1) |
|
GDP |
0.0513 |
0.0009 |
|
ICT |
0.0534 |
0.0006 |
|
EMP |
0.1024 |
0.0000 |
|
PROD |
0.2008 |
0.0000 |
|
Source: own compilation. |
||
Table 3. ARDL model of Armenia’s real economy
|
Variable |
Coeff. |
St. error. |
t-statistics |
p-value |
|
|
DGDP (–1) |
0.218606 |
0.109895 |
1.989225 |
0.0539 |
* |
|
DICT |
0.091139 |
0.032526 |
2.801995 |
0.0079 |
*** |
|
DEMP |
0.174139 |
0.045685 |
3.811690 |
0.0005 |
*** |
|
DPROD |
0.520105 |
0.098592 |
5.275327 |
0.0000 |
*** |
|
DUMMY |
-1.533546 |
0.737753 |
-2.078672 |
0.0445 |
** |
|
Note: *** p-value < 0.01; ** p-value < 0.05; * p-value < 0.10. Source: own compilation. |
|||||
The optimal specification was selected based on the Akaike criterion. Table 3 presents the minimum value of the criterion corresponded to the model with the structure (1, 0, 0, 0, 0).
The resulting linear equation has the form:
AGDPt = 0.219 ■ AGDPt-1 + 0.091 ■ AICTt + +0.174 ■ AEMPt + 0.520 ■ APRODt - (2)
-1.534 ■DUMMY.
The R-squared value of the model was 0.59, and the adjusted R-squared value was 0.55, which indicates the acceptable quality of the specification and explanatory ability of the model.
Since the ARDL/ECM specification is evaluated using the least squares method, the correctness of statistical conclusions (t- and F-criteria) depends on the properties of the residuals, primarily on the absence of autocorrelation and pronounced conditional hetero-scedasticity. In this regard, the Breusch – Godfrey LM test did not reveal a serial correlation of the residuals before the second lag (p-value according to F-statistics = 0.5435). The ARCH-effects test also did not show statistically significant conditional heteroscedasticity (p-value according to F-statistics = 0.660), which confirms the stability of the estimates of standard errors. To complete the diagnostic check, alternative tests for heteroscedasticity (Breusch – Pagan – Godfrey, Harvey, Glazer, and White) were additionally calculated; their p-values for F-statistics were 0.5842; 0.1159; 0.3647; 0.1610, respectively, which does not indicate the presence of persistent disorders that can significantly distort statistical conclusions. The multicollinearity estimate using variance inflation coefficients (VIF) showed values in the range from 1.1257 to 1.3187, indicating the absence of significant multicollinearity and the stability of parametric estimates. The normality of the residue distribution was confirmed by the Jarque – Bera test (p-value = 0.4221). The CUSUM and CUSUMQ tests show that the relevant statistics are found within the 5% confidence limits over the entire observation interval; the graphs do not demonstrate structural breaks or systematic deviations, which indicates the parametric stability of the model (Appendix).
To further verify the correctness of the functional form and the possible omission of significant explanatory variables, the Ramsey RESET test was performed with the inclusion of squares of the predicted (fitted) values in the model specification. The results obtained do not allow rejecting the null hypothesis of correct specification: the p-value for t-statistics was 0.3763, the p-value for F-statistics was 0.3763, and the p-value of the Likelihood Ratio test was 0.3369). Consequently, there are no significant signs of a functional incorrect specification, missing non-linearities, or the systematic influence of unaccounted-for factors within the framework of the chosen model, which increases confidence in the obtained coefficient estimates and their interpretation.
Checking for a long-term relationship between variables using the ARDL bounds test gave an F-statistic value of 16.6589, which exceeds the critical values for I(0) and I(1) even at a 10% significance level (1.90 and 3.01, respectively). This allows concluding that there is a cointegration dependence and methodologically justifies the transition to evaluating an error correction model for interpreting short- and long-term effects.
Interpretation of the ARDL model results
In the short term, a statistically significant positive impact of digitalization, employment and labor productivity on the real Armenian economy has been revealed. Table 4 shows that an increase in activity in the ICT sector (∆ICT) by 1% leads to an increase in real GDP of about 0.09%, which confirms the high sensitivity of the economy to the processes of digitalization. Similarly, a 1% increase in employment (∆EMP) provides an expansion of output by 0.17%, while a 1% increase in labor productivity (∆PROD) leads to an acceleration of GDP by 0.52%. The results obtained allow concluding that it is the increase in labor efficiency that is the main driver of the short-term expansion of the real economy in the active digital transformation. At the same time, the negative short-term impact of crises was recorded, reflected by a dummy variable (DUMMY). During the periods of the COVID-19 pandemic, active migration flows and geopolitical instability, GDP declined by an average of 1.53%. This indicates the high vulnerability of the Armenian economy to exogenous shocks, which significantly limits the possibilities for an accelerated and sustainable transition to a new industrial stage of development.
In the long term, the influence of key factors on the dynamics of the real economy of the Republic of Armenia is increasing, reflecting the cumulative nature of structural and institutional changes. Longterm effects are obtained based on the estimated ARDL model by normalizing coefficients at the levels of explanatory variables in the error correction model (ECM), automatically calculated in the EViews environment, allowing the parameters to be interpreted as stable long-term relationships in the presence of cointegration.
According to the results in Table 5 , a 1% increase in the ICT sector ( ∆ ICT ) is accompanied by an increase in GDP of about 0.12%, an increase in employment ( ∆ EMP ) of 1% leads to an increase in GDP of 0.22%, and an increase in labor productivity ( ∆ PROD ) of 1% provides an increase in output of 0.67%. At the same time, productivity provides the greatest contribution to long-term dynamics, which emphasizes the key role of resource efficiency. Moreover, these estimates should not be interpreted as unambiguous evidence of a deep technological transformation, since productivity growth can be formed by a
Table 4. Short-term effects in the ARDL model
|
Variable |
Coeff. |
St. error. |
t-statistics |
p-value |
|
|
DGDP (–1) |
-0.781394 |
0.109895 |
-7.110371 |
0.0000 |
*** |
|
DICT |
0.091139 |
0.032526 |
2.801995 |
0.0079 |
*** |
|
DEMP |
0.174139 |
0.045685 |
3.811690 |
0.0005 |
*** |
|
DPROD |
0.520105 |
0.098592 |
5.275327 |
0.0000 |
*** |
|
DUMMY |
-1.533546 |
0.737753 |
-2.078672 |
0.0445 |
** |
|
Note: *** p-value < 0.01; ** p-value < 0.05; * p-value < 0.10. Source: own compilation. |
|||||
Table 5. Long-term effects in the ARDL model
Taking into account the presented long-term effects, the constructed ECM takes the form:
EC = ^GDP - (0.117 • МСГ + 0.223 • ^EMP +
+ 0.666 • ^PROD - 1.963 • DUMMY). (3)
The coefficient in the equation is -0.781 with a significance level of p = 0.0000, which confirms the existence of a stable long-term relationship between the dynamics of GDP and the factors under consideration.
Discussion
Conclusion
The study revealed that the formation of the real economy of the Republic of Armenia traces a trajectory from the catching-up development of the early 2000s, focused on bridging the technological gap and integrating into foreign economic relations, to the stage of accelerated structural adaptation in the 2020s, accompanied by the expansion of digital activities and the formation of Industry 4.0 infrastructure. These processes have contributed to increased productivity and opportunities for diversification, including through the IT sector and higher-value-added services, but have not eliminated the institutional and investment constraints of the technological expansion of the real economy.
