Dynamics of training distress, performance, and excretion of cortisol and cortisone in urine during six weeks of training in elite swimmers

Author: Izov N., Alexandrova A., Petrov L., Kachaunov M., Sheytanova T., Kolimechkov S.
Journal: Человек. Спорт. Медицина @hsm-susu
Section: Спортивная тренировка
Article in issue: S1 т.20, 2020.
Free access
Aim. Optimal balance between training intensity and recovery is of particular importance for elite swimmers in order to improve their results. The aim of this study was to record the dynamics of training distress, performance, and excretion of cortisol and cortisone in urine during six weeks of training in elite swimmers. Materials and Methods. Twenty-four participants (10 women and 14 men) from the national swimming team of Bulgaria took part in this study, with an average age of 18.7 ± 3.78 years. Training distress (TDS) and urine concentration of cortisol and cortisone were evaluated every two weeks. In total, the measurements were taken on the 1-st (T1), 14-th (T2), 28-th (T3) and 42-nd days (T4). Anthropometric measurements were also taken at T1 and T4, and body fat percentage and muscle mass percentage were calculated by skinfold methods. Results. The TDS score at T4 (6.92 ±7.15) was significantly lower than this at T1 (14.96 ± 10.63) and T2 (15.21 ± 12.44). The concentrations of cortisol at T3 (35.9 ± 47.7) and T4 (35.0 ± 24.2) were also significantly lower than that registered at T1 (82.7 ± 62.8). The concentration of cortisone did not show any significant differences across T1 to T4, but the sum of cortisol and cortisone urine concentration was significantly lower in T3 and T4 vs T1. Conclusion. The significantly reduced cortisol concentration in urine in T4, as well as the sum of the concentrations of cortisol and cortisone, were in line with the reduction of the TDS score in T4.
Cortisol, cortisone, swimmers, overtraining, training distress score
Short address: https://sciup.org/147233646
IDR: 147233646 | UDC: 797.2.015 | DOI: 10.14529/hsm20s111
Динамика тренировочного дистресса, производительности и уровня кортизола и кортизона в моче у элитных пловцов во время шестинедельного тренировочного цикла
Цель. Оптимальный баланс между интенсивностью тренировок и восстановлением особенно важен для улучшения результатов элитных пловцов. Данное исследование было нацелено на выявление динамики тренировочного дистресса, производительности и экскреции кортизола и кортизона у элитных пловцов во время шестинедельного тренировочного цикла. Материалы и методы. В исследовании приняли участие 24 спортсмена (10 женщин и 14 мужчин) национальной сборной Болгарии по плаванию, средний возраст которых составил 18,7 ± 3,78 года. Тренировочный дистресс и концентрация кортизола и кортизона в моче оценивались каждые две недели. Измерения проводились в 1-й (Т1), 14-й (Т2), 28-й (Т3) и 42-й дни (Т4). Антропометрические измерения проводились в 1-й и 42-й дни. Процентное содержание жира и мышечной массы оценивалось с использованием метода измерения толщины кожной складки. Результаты. Показатель тренировочного дистресса на 42-й день (6,92 ± 7,15) был значительно ниже, чем в 1-й (14,96 ± 10,63) и 14-й дни измерений (15,21 ± 12,44). Концентрация кортизола на 28-й (35,9 ± 47,7) и 42-й день (35,0 ± 24,2) также была значительно ниже, чем в 1-й день измерений (82,7 ± 62,8). Концентрация кортизона не показала каких-либо существенных различий между 1-м и 42-м днем измерений, однако сумма концентраций кортизола и кортизона в моче была значительно ниже на 28-й и 42-й дни по сравнению с 1-м днем измерений. Заключение. Значительно сниженная концентрация кортизола в моче на 42-й день измерений, а также сумма концентраций кортизола и кортизона соответствовали уменьшению показателя тренировочного дистресса к 42-му дню тренировочного цикла.
Text of the scientific article Dynamics of training distress, performance, and excretion of cortisol and cortisone in urine during six weeks of training in elite swimmers
Elite swimmers perform large amounts of training at high intensity to improve their competition results. In order to avoid the development of overtraining syndrome, they have to maintain an optimal balance between training intensity and recovery [1].
Studies on urinary cortisol/cortisone ratio (C/Cn ratio) overnight [5] and C/Cn ratio for 24 h [1] have been conducted to monitor the effect of the training load on elite swimmers. The hypothalamic-pituitary-adrenal axis (HPA axis) plays the main role in the adaptation for endurance training and for the response to intensive exercises. Repeated exercises bring adaptation of the HPA axis with decreased sensitivity of tissues to glucocorticoids [6] and reduced glucocorticoids receptor levels [3]. Urine sampling methods, as opposed to plasma, are applied to assess HPA axis responses when athletes perform large amounts of training and participation in competitions, without any disturbances to their training conditions. These methods are non-invasive, nonstressful, reliable, and practical [1]. Plasma cortisol levels are modulated by variations of their binding protein (CBG) and bear a low level of correlation with the rate of cortisol production, unless differences in CBG are corrected, whereas urinary free cortisol concentrations are independent of CBG concentrations and thus, closely reflect the production of 24-h free active plasma cortisol [2].
Different physiological variables have been investigated as a potential marker of training distress, which include metabolic, cardiovascular, immunological, neuromuscular, and endocrinological measures [8]. However, due to their high intra-individual variability, those variables have shown only weak relationships with training distress [7, 8]. On the other hand, psychological and behavioural measures have been observed to have stronger relationships. Additionally, they are efficient, inexpensive and non-invasive [16].
Grove et al. published findings from three experimental studies which estimated the shortterm training distress and performance readiness in swimmers [7]. The authors confirmed that reductions in performance capabilities which are induced by the training workload were associated with parallel increase in the score of the Training Distress Scale (TDS). TDS is a 19-item questionnaire which measures generated distress symptoms previously identified by Fry et al. [4]. The link between TDS scores and swimming performance was evident from the results of the swimmers with low levels of distress symptoms 2 weeks before a major competition, who swam better during the event than those who reported higher levels of distress symptoms [7].
Aim
The aim of this study was to record the dynamics of training distress, performance, and excretion of cortisol and cortisone in urine during six weeks of training in elite swimmers.
Materials and Methods
Participants
Twenty-four elite swimmers (10 women and 14 men) from the national swimming team of Bulgaria took part in this study. They had an average age of 18.7 ± 3.78 years.
Design of the study
The athletes were tested over a 6-week period starting 2 weeks after the National Team Championship and finishing 2 weeks before the National Individual Championship (both in a 50 m swimming pool). The degrees of training distress and urine concentration of cortisol and cortisone were evaluated every two weeks. In total, the measurements were taken four times: on the 1-st (T1), 14-th (T2), 28-th (T3) and 42-nd days (T4) on Monday mornings. Additionally, anthropometric measurements were conducted at T1 and T4.
Training programme
The study was conducted in the summer sea- son (3rd macrocycle) stretching from April to July, in which the training sessions in a 50 m swimming pool were performed. The reported six-week period was part of the general preparation phase, and it started right after the 2 weeks of recovery phase following the main competition. The swimmers trained twice per day from Monday to Friday, performing a total of 10 training sessions a week. During this period, the training process of the swimmers is associated with a gradually increased training volume, starting from 40 km for the first week and finishing at 65 km for the last. The main goals for this training phase are to improve aerobic capacity and to maintain anaerobic power and speed. The training has to produce central circulatory and respiratory adaptations which improve the delivery of oxygen and nutrients in the muscles [14], and as a result of that, an increased VO2max is expected. The training programme of the participants in this study, including training volume (km) and training zones (% of all volume), is presented in Table 1.
HR-bpm
Anthropometry
The following anthropometric measurements were taken: height, weight and arm span. Body fat percentage (Fat%) and muscle mass percentage (MM%) were calculated by using skinfold methods [13 – 15].
Training distress
The Training Distress Scale (TDS) [7] was translated into Bulgarian and applied to assess the athletes' degree of training distress and performance readiness. The TDS consists of 19 items which measure the distress symptoms previously identified by Fry et al. [4]. The responses were given by using a 5-point bipolar scale extending from ‘not at all (0)’ to ‘extreme amount (4)’. The final score was calculated as the sum of all points.
Table 1
The six-week training programme of the elite swimmers
|
Week |
1 |
2 |
3 |
4 |
5 |
6 |
|
Training zones/Volume (km) |
40 |
45 |
50 |
55 |
60 |
65 |
|
I. Basic Endurance HR 120-150 |
59 % |
59 % |
59 % |
50 % |
50 % |
50 % |
|
II. Threshold Endurance HR 150-180 |
25 % |
25 % |
25 % |
25 % |
25 % |
25 % |
|
III. High performance endurance HR >180 |
4 % |
4 % |
4 % |
8 % |
8 % |
8 % |
|
IV. Anaerobic: Lactate tolerance + Lactate production + Race pace training |
2 % |
2 % |
2 % |
4 % |
4 % |
4 % |
|
V. Sprint |
3 % |
3 % |
3 % |
3 % |
3 % |
3 % |
|
VI. Recovery HR < 120 |
7 % |
7 % |
7 % |
10 % |
10 % |
10 % |
Additionally, first-morning urine samples were taken to determine the concentration of cortisol and cortisone. The participants, with only 3 exceptions, noted that this was their only urine for the whole night. The competitors always had 60 hours of recovery (from Friday night to Monday morning) before the samples were taken.
Chemicals and reagents
Formic acid (HPLC grade) was obtained from Merck (Darmstadt, Germany). Acetonitrile, methanol and tert-butyl methyl ether (HPLC grade), K 2 CO 3 and KHCO 3 puriss p.a. were purchased from Sigma-Aldrich (Steinheim, Germany). Cortisol and cortisone were from LGC (Luckenwalde, Germany). D 3 -Methyltestosterone was from RIKILT (Wageningen, Netherlands).
Sample preparation
Two millilitres by volume of urine were mixed with 0.5 mL carbonate buffer pH 9.6 (K 2 CO 3 /KHCO 3 20/20, w/w) and shaken. After the addition of 20 μL internal standard (ISTD, d3-methyltestosterone, 200 ng/mL), the urine sample was extracted by 3.0 mL of t-butyl-methyl ether for 20 min and centrifuged at 5000 rpm for 10 min. The aqueous phase was frozen and the organic layer was isolated in another tube and evaporated to dryness at 55 °C under a stream of nitrogen. The residue was reconstituted in 200 μL of CH 3 OH/ 0.2% formic acid, H 2 O (10:90).
A five-point calibration curve and two quality controls (QC) in water (Table 2) were used for the quantification of samples.
Instrumentation
LC-MS-MS analysis was performed on an Agilent Technologies UHPLC 1290 Infinity with 6460 Triple Quad mass spectrometer.
A reversed-phase ZORBAX Eclipse Plus C18 Rapid Resolution HD column (2.1 × 50 mm 1.8 Micron) was used for the analyses. The mobile phase was composed of 0.2% formic acid, H 2 O as solvent A and acetonitrile as solvent B. A gradient (Table 3) was run at 0.4 mL/min and the injected volume was 10 μL.
MS/MS detection was performed in multiple reaction monitoring (МRM) mode and electrospray ionization (ESI) in the positive ion mode. Acquisition parameters were summarised in Table 4.
The obtained sample concentrations were adjusted to a urine specific gravity (SG) of 1.020 based on the following equation:
Conc corrected = Conc measured
×
× (1.020 – 1) / (SG – 1).
Statistical analyses
Statistical analysis was performed using the GraphPad Prism 5.0 software. The significance of differences of anthropometric mean values was evaluated by paired Student’s t-test. Kolmo-
Table 2
LOD, LOQ, calibration level and QC for method performance in ng/mL
|
Substance |
LOD, ng/mL |
LOQ, ng/mL |
cal-1, ng/mL |
cal-2, ng/mL |
cal-3, ng/mL |
cal-4, ng/mL |
cal-5, ng/mL |
QC-1, ng/mL |
QC-2, mg/mL |
|
Cortisol |
0,186 |
0,400 |
0,400 |
10,000 |
40,000 |
100,000 |
200,000 |
22,000 |
62,000 |
|
Cortisone |
0,135 |
0,400 |
0,400 |
10,000 |
40,000 |
100,000 |
200,000 |
22,000 |
60,000 |
Table 3
Liquid chromatography solvent gradients for the UHPLC MS/MS method
|
Time (min) |
0 |
1 |
1.5 |
3 |
4 |
5.5 |
6 |
8 |
8.7 |
9 |
9.5 |
9.7 |
12 |
12.2 |
17 |
|
A (%) |
95 |
95 |
90 |
80 |
70 |
70 |
60 |
60 |
30 |
20 |
20 |
5 |
5 |
95 |
95 |
|
B (%) |
5 |
5 |
10 |
20 |
30 |
30 |
40 |
40 |
70 |
80 |
80 |
95 |
95 |
5 |
5 |
Table 4
Multiple Reaction Monitoring (MRM) and mass spectrometer conditions (ESI)
Results
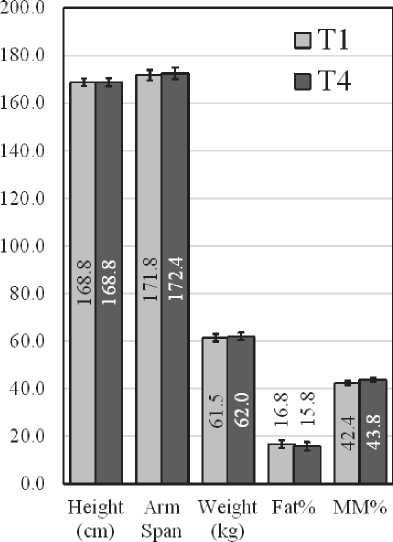
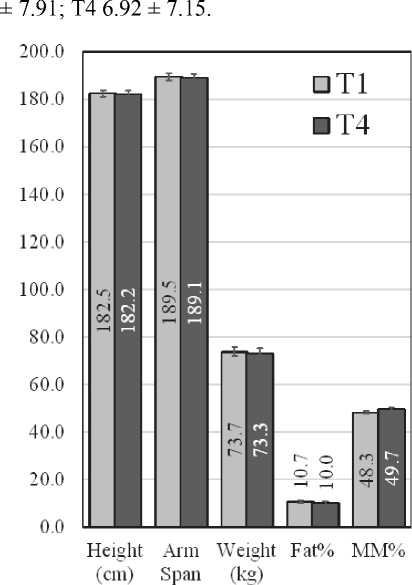
The anthropometric parameters which were measured in T1 and T4 are presented in Fig. 1.
(cm)
Fig. 1. Anthropometric parameters of female (Left) and male (Right) swimmers at T1 and T4
There were no statistically significant differences in body composition, both in males and in females.
The analysis of the responses from the Training Distress Scale (TDS) showed a good internal consistency for the composite measure, with an average of Cronbach's alpha of 0.871 across administrations. The TDS score dynamics are presented in Fig. 2. The TDS score at T4 (6.92 ± 7.15) was significantly lower than that at T1 (14.96 ± ± 10.63), as well as that at T2 (15.21 ± 12.44). T1 14.96 ± 10.63; T2 15.21 ± 12.44; T3 11.54 ±
(cm)
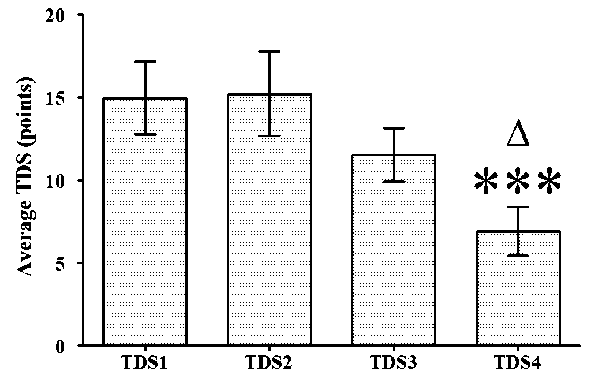
Fig. 2. Dynamics of TDS score for the elite swimmers across T1 to T4: * p < 0.05 vs T4; *** – p < 0.001 vs T4
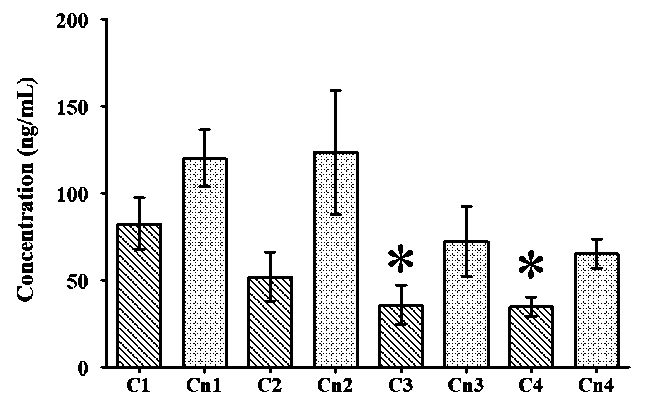
Fig. 3. Dynamics of cortisol and cortisone urine concentration across T1 to T4:
* p < 0.05 vs T1
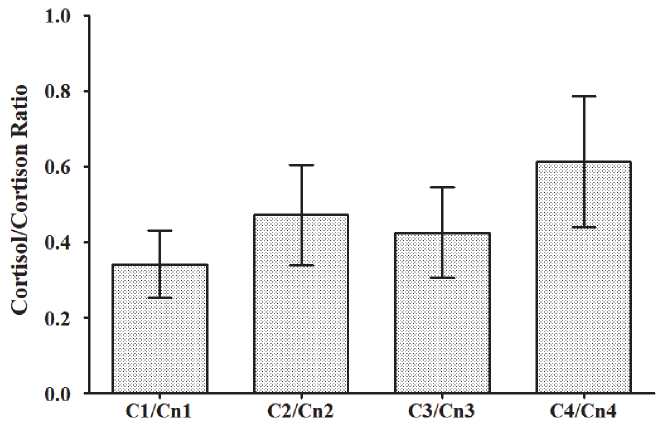
Fig. 4. Dynamics of the cortisol/cortisone ratio across T1 to T4
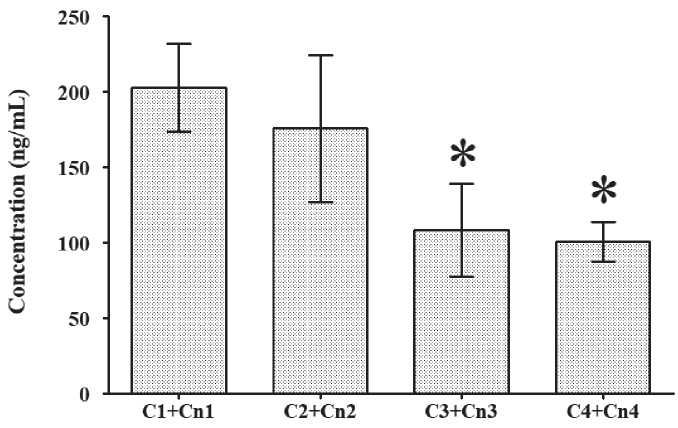
Fig. 5. Dynamics of the sum of cortisol and cortisone urine concentration across T1 to T4: * p < 0.05 vs T1
The dynamics of cortisol and cortisone urine concentration are presented in Fig. 3. The concentration of cortisol at T1 (82.7 ± 62.8) was significantly higher than those at T3 (35.9 ± 47.7) and T4 (35.0 ± 24.2). The concentration of cortisone did not show any significant differences at any of the times tested (T1 to T4).
The dynamics of cortisol/cortisone ratio (C/Cn ratio) are presented in Fig. 4, and that of the sum of cortisol and cortisone urine concentration is presented in Fig. 5. The C/Cn ratio did not show any significant differences at any of the times tested (T1 to T4), while the sum of cortisol and cortisone urine concentration was significantly lower in T3 and T4 vs T1.
Discussion
The body composition data of the elite swimmers during the investigated period remained the same, which suggested that the nutritional status of the participants was unchanged. As a side observation, a bigger difference between the height and the arm span, more visible in men (about 7 cm), was registered in this study. Similar findings were reported for swimmers in the literature [12].
The adapted Training Distress Scale (TDS) has been shown to be an easy and appropriate instrument which can be used in everyday coaching practice, and as a tool for longitudinal studies. The results from our study showed that the TDS scores decreased during the investigated period (Fig. 2), despite the training volume increasing by 5 km per week (Table 1). This was also backed up by the reduced concentration of cortisol in T3 and T4 vs T1.
In our study, in almost all cases the morning urine was the all-night urine, and the concentration of the hormones measured was adjusted to its density. Thus, the effect of a volume of urine was considerably reduced, and the measured cortisol and cortisone concentrations reflected the total amount of hormones released overnight.
Conclusions
The significantly reduced cortisol concentration in urine in T4, as well as the sum of the concentrations of the cortisol and cortisone, are in line with the reduction of the TDS score in T4. The lower concentration of the stress hormone, cortisol, in the urine, and the lack of subjective symptoms of training distress led to good physical and mental recovery of the athletes after 60 hours of rest.
Acknowledgements. This study was part of the project “Non-invasive monitoring of recovery and effects of glutathione supplementation on elite swimmers” supported by Grant ЦРАС 12/15.02.2018 by the National Sports Academy, Sofia, Bulgaria.
References Dynamics of training distress, performance, and excretion of cortisol and cortisone in urine during six weeks of training in elite swimmers
- Atlaoui D., Duclos M., Gouarne C. et al. The 24-h Urinary Cortisol/Cortisone Ratio for Monitoring Training in Elite Swimmers. Medicine and Science in Sports and Exercise, 2004, vol. 36 (2), pp. 218-224. DOI: 10.1249/01.MSS. 0000113481.03944.06
- Bright G.M. Corticosteroid-Binding Globulin Influences Kinetic Parameters of Plasma Cortisol Transport and Clearance. J Clin Endo-crinol Metab, 1995, vol. 80 (3), pp. 770-775. DOI: 10.1210/jc.80.3.770
- Duclos M., Gouarne C., Bonnemaison D. Acute and Chronic Effects of Exercise on Tissue Sensitivity to Glucocorticoids. J Appl Physiol, 1985, vol. 94 (3), pp. 869-875. DOI: 10.1152/ japplphysiol.00108.2002
- Fry R.W., Grove J.R., Morton A.R. et al. Psychological and Immunological Correlates of Acute Overtraining. Br J Sports Med, 1994, vol. 28 (4), pp. 241-246. DOI: 10.1136/bjsm. 28.4.241
- Gouarne C., Groussard C., Gratas-Delamarche A. et al. Overnight Urinary Cortisol and Cortisone Add New Insights Into Adaptation to Training. Medicine and Science in Sports and Exercise, 2005, vol. 37 (7), pp. 1157-1167. DOI: 10.1249/01.mss.0000170099.10038.3b
- Grasso G., Lodi L., Lupo C., Muscet-tola M. Glucocorticoid Receptors in Human Peripheral Blood Mononuclear Cells in Relation to Age and to Sport Activity. Life Sci, 1997, vol. 61 (3), pp. 301-308. DOI: 10.1016/S0024-3205(97)00386-X
- Grove J.R., Main L.C., Partridge K. et al. Training Distress and Performance Readiness: Laboratory and Field Validation of a Brief Self-Report Measure. Scand J Med Sci Sports, 2014, vol. 24 (6), pp. 483-490. DOI: 10.1111/sms.12214
- Halson S.L., Jeukendrup A.E. Does Overtraining Exist? An Analysis of Overreaching and Overtraining Research. Sports Med, 2004, vol. 34 (14), pp. 967-981. DOI: 10.2165/ 00007256-200434140-00003
- Hug M., Mullis P.E., Vogt M. et al. Training Modalities: Over-Reaching and OverTraining in Athletes, Including a Study of the Role of Hormones. Best Pract Res Clin Endocrinol Metab, 2003, vol. 17 (2), pp. 191-209. DOI: 10.1016/S1521-690X(02)00104-5
- Jackson A.S., Pollock M.L. Generalized Equations for Predicting Body Density of Men. Br J Nutr, 1978, vol. 40 (3), pp. 497-504. DOI: 10.1079/BJN19780152
- Jackson A.S., Pollock M.L., Ward A. Generalized Equations for Predicting Body Density of Women. Medicine and Science in Sports and Exercise, 1980, vol. 12 (3), pp. 175-181. DOI: 10.1249/00005768-198023000-00009
- Latt E., Jurimae J., Maestu J. et al. Physiological, Biomechanical and Anthropo-metrical Predictors of Sprint Swimming Performance in Adolescent Swimmers. J Sports Sci Med, 2010, vol. 9 (3), pp. 398-404.
- Mackinnon L.T., Hooper S.L., Jones S. et al. Hormonal, Immunological, and Hematological Responses to Intensified Training in Elite Swimmers. Medicine and Science in Sports and Exercise, 1997, vol. 29 (12), pp. 1637-1645. DOI: 10.1097/00005768-199712000-00014
- Maglischo E. Swimming Fastest: Human Kinetics. 2003.
- Martin A.D., Spenst L.F., Drinkwater D.T., Clarys J.P. Anthropometric Estimation of Muscle Mass in Men. Medicine and Science in Sports and Exercise, 1990, vol. 22 (5), pp. 729-733. DOI: 10.1249/00005768-199010000-00027
- O'Connor P. Overtraining and Stale-ness. In W. Morgan (Ed.), Physical Activity and Mental Health. Washington: Taylor & Francis. 1997,pp. 145-160.
