Electrocardiogram frequency characteristics study by processing and analysis of the signal in time domain and spectral domain

Author: Chereshnev Vitaly O., Proskurin Sergey G.
Journal: Cardiometry @cardiometry
Section: Review
Article in issue: 17, 2020.
Free access
This paper presents the results of a study in which cardiac signal of the first lead of a standard digital ECG system were processed. By filtering in the time domain, the cardiogram was clarified of noise that reduced influence of spectral harmonics by 10-15%. To present and classify frequency characteristics throughout the entire cardio signal, the QS section between the P and T peaks was smoothed. Due to the influence of sharp peaks on the results of spectral analysis, a result considerably differ from the sum of sinusoidal components is observed. The gap between the peaks is interpolated by the Lagrange polynomial since it did not show an influence on the resultant spectrum. The spectral representation revealed peaks with frequencies oddly even, 3.1 Hz and 6.2 Hz, corresponding to the P and T peaks. Based on the obtained results the frequencies corresponding to the remaining peaks of the cardiogram were also classified. The obtained results represent a spectrum of two regular harmonics what allows for further adequate diagnostics of ECG signals.
Digital electrocardiogram, ecg smoothing, spectral analysis
Short address: https://sciup.org/148311473
IDR: 148311473 | DOI: 10.12710/cardiometry.2020.17.3033
Text of the review article Electrocardiogram frequency characteristics study by processing and analysis of the signal in time domain and spectral domain
Vitaly O. Chereshnev, Sergey G. Proskurin. Electrocardiogram frequency characteristics study by processing and analysis of the signal in time domain and spectral domain. Cardiometry; Issue 17; November 2020; p.30-33; DOI: 10.12710/cardiometry.2020.17.3033; Available from:
The basis of electrocardiography is the registration of bioelectric potentials on the surface of the body's 30 | Cardiometry | Issue 17. November 2020
skin that appear during the heart beating. Usually, a standard twelve-lead electrocardiograph is used to do this, which register in electrical potentials from the surface of the body that arise in different parts of the heart during the moments of systole and diastole. In the latest electrocardiographs, this information is recorded and further processed in digital form.
The modern stage of development of information technologies is characterized by the massive use of the systems using various algorithms for processing, analysis and interpretation of signals as well as electrocardiograms (ECG), in particular [1, 2]. The classical approach in electrocardiology consists of various methods for analyzing the time dependences of the amplitude of cardiac signals: standard ECG measurement – mean values and variances of depolarization and repolarization basic parameters. However, the existing methods of analysis in the time and spectral domains are not always sufficient to describe all the features of the ECG signals and do not allow for fully identify its their basic characteristics [3].
The key problems of the cardiac signals analysis is not only the detection of standard complexes and analysis of their shape, but also the identification of specific spectral components. In this regard, new possibilities are opened by division of the signal to two parts: (i) with sharp leading edge (QRS complex); and (ii) slow ones – with smooth leading edge (P and T peaks). The Fourier transform (FT) is based on the idea of representing a periodic function, all ECG signals are primarily these, in a form of the sum of individual harmonic components (sines and cosines with different amplitudes A, periods T, and frequencies ω) [4-6]. In literature on ECG processing, the Fourier transform is used as a tool for analyzing heart rate variability (HRV) only. As a result of that the potential of using spectral analysis for diagnostics of cardiac diseases is realized not completely.
The purpose of this work is to divide the ECG signal into two parts (fast and slow) in the time domain with following processing of the second part in the spectral domain.
Materials and methods
The signal of a standard electrocardiographic system, averaged over three realizations, containing noise and power line interference, has been taken for pro-
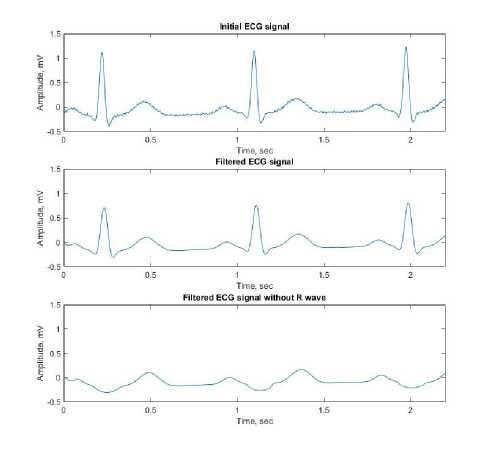
Figure: 1 - Segment of the original ECG signal (a), filtered ECG signal (b), the filtered ECG signal without R peak (c)
cessing and further analysis. The initial cardiac signal is shown in Figure 1a). The initial data of the time series of the first lead of the signal contain noise and 50 Hz power supply influence, which naturally reflects on the results of spectral analysis in the form of high-frequency interference. It hampers further processing and determination of relationships between harmonic components, frequencies and peaks of the cardiogram. To minimize the noise component, primary processing in the time domain was implemented – smoothing using Lagrange-Sylvester polynomials, Figure 1b):
s m k - 1 r (A)= XX k = 1 p = 0
( m k - p - 1)
■ г f (A) i ^ (A)
5 A mk - p - 1 и ( A ) J a = a (A - A k ) p + 1
V k ( A ) = - ^ ( ^ f^
где (A Ak) k satisfying the following conditions:
...
r ( A k ) = f (Ak ), r( A k ) = f(Ak ),.
, к'-'А ) = P'^'A ),
( k = 1,2,.
....,
s ; m 1 + m 2 + .... + ms = m ),
f ( A ) - a function that is defined on the spectrum of raw data;
A (k ) - zeros of minimal polynomial of raw data;
mk – polynomial degree.
After the primary signal processing in the time domain, spectral analysis is performed using the discrete Fourier transform:
1 n - 1 - J nL
X ( k )=— E x ( n ) eN N n = 0
1 N - 1 =]v E x ( n ) n = 0
2nk . . 2nk cos--/ sin-----
NN
where 0 < k < N - 1 , N - number of multiplication of complex numbers.
Then, harmonics and frequency characteristics are identified. The results of spectral analysis of the original and filtered ECG signal are shown in Figure 2 in blue and red colors.
Note that, even after filtering, the resulting signal spectrum consists of more than fifteen harmonics. Determination of functional relationships between the cardiogram waves and frequencies with such a number of harmonics is very difficult. The Fourier transform assumes a periodic but preferably smooth signal. On conventional analog ECG signals recorded on a graph paper, the QRS complex is approximated by a triangle, because it is somewhat stretched due to the instrumental function, Figure 3.
The original digital data show that the sharp peak responsible for ventricular contraction is most closely corresponds to the δ-function with an amplitude 3-5 times greater than that of the P wave (atrial contraction) and T wave (ventricular relaxation). The sharp R peak gives too many the harmonics in the final spectrum mostly. The temporal representation of the ECG signal in the form of two functions, (i) a periodically appearing R peak only, and (ii) a smooth signal with the P and T waves, leads to obtaining a spectrum (Figure 3, green) of the second signal with adequately interpreted harmonic [9, 10]. Interpolation of the resulting Q-S discontinuity using the Lagrange polynomial give the best results of spectral analysis [10]. A signal with smoothed QRS complex and interpolated by the Lagrange polynomial is shown in Figure 1c). The result of the spectral analysis of the processed signal is shown in Figure 2 in green.
The spectrum of the smoothed signal contains two pronounced harmonics with frequencies: ω1 = 3.12 Hz and ω2 = 6.21 Hz. From the ratio of the amplitudes of the T wave to the P wave, it can be concluded that on the cardiogram ω1 corresponds to the T wave, and ω2 to the P wave.The conclusion about the correspondence of the harmonic components is verified using simulation and the inverse Fourier transform. The signals obtained in this way, with good accuracy (R2 ~ 0.95), corresponds to the original data, both in amplitude and phase. The change in the amplitude of a chosen harmonic leads to the change in the corresponding wave on the reconstructed ECG signal.
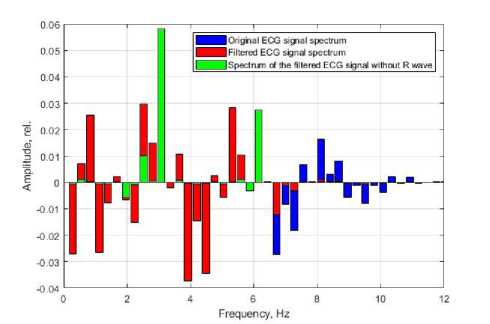
Figure: 2 - ECG signal spectra. The original signal spectrum
(blue histogram); spectrum of the filtered signal (red histo-
gram), spectrum of the signal after smoothing the QRS com- plex (green histogram), see Figure 1c)
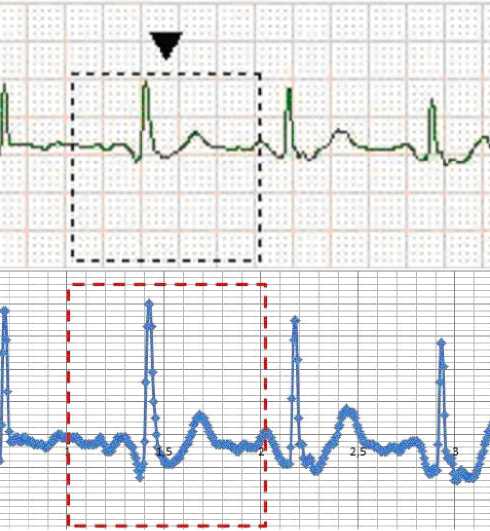
Figure 3. Presentation of the cardiogram using standard (a) and digital (b) way
Results and discussion
The use of the Fourier transform for the analysis of the initial cardiac signal showed the presence of more than 15 peaks in signal spectra. Biomedical diagnostics and determination of functional dependencies of them is difficult and almost impossible. The use of Lagrange-Sylvester polynomials made it possible to reduce the number of harmonics by about 30%, while the shape of the electrocardiogram remained practically unchanged, Figure 1b). Only a decrease in the amplitude of the R peak can be seen, but this does not affect the further research results.
Revealing the relationship between the spectral harmonics of the filtered ECG using the inverse Fou-
32 | Cardiometry | Issue 17. November 2020
rier transform is possible, however, the adequacy of this approach in practice remains unclear. As a consequence of this we suggested to make initial signal processing in the time domain, namely, the reduction of the number of spectrum peaks by smoothing the QRS complex with the Lagrange polynomial (Figure 1c). This approach is used since R peak is approximated by δ-function most obviously and, as a result, gives the number of additional spectral harmonics.
The interpolated signal is subjected to Fourier transform to reveal the frequencies characterizing the sequential depolarization of the right and left atria and the process of rapid repolarization (relaxation) of the ventricles. On the results of the spectral analysis (Figure 2, green), two pronounced harmonics with frequencies ω1 and ω2 corresponding to the T and P waves can be seen. It is possible to determine belonging of a particular wave by comparing harmonic amplitudes of the spectrum and using the inverse Fourier transform.
The obtained result strongly suggests that the pulses responsible for atrial depolarization and ventricular repolarization, generated by the sinus-atrial node, are of different nature and are not related to each other. However, the P and T waves most probably correspond to one harmonic, therefore, the processes correspondent to them can be described by sinusoidal signal. Also, the frequencies obtained during the experiment are approximately a multiple of two. This indicator is inherent to some primitive biological self-oscillating systems [8, 11].
It is important to note that the results obtained meet the criteria for adequacy:
a 2 г0ёаёё
R 2 = 1 - > 0,96.
-
2 ,л г У у а гаиау
Variance in this case is determined as follows:
S
a
n — ( k + 1)
n
£ ( Г — r )2 .
i = 1
The calculations of the F-test also confirmed the adequacy of the model to the results of the obtained discrete data.
Conclusion
This paper the results of spectral analysis of the averaged signal of a standard digital ECG system are present- ed. Using time-domain processing, the cardiogram signal was cleared of noise and power line interference. As a result of the Fourier transform, spectra were obtained that contained more than fifteen peaks, which is approximately less than ten when using standard processing.
It was found out that the elimination of the δ-func-tion of the QRS complex with interpolation by a Lagrange polynomial in the time domain and subsequent processing in the spectral domain can significantly reduce the number of spectral components and reveal the frequencies ω1 = 3.12 Hz and ω2 = 6.21 Hz, corresponding to T and P waves. The described algorithm for ECG processing in the time and spectral domain has the potential to register micro changes in the cardiac signal based on the analysis of the corresponding peaks of the spectrum.
Further work will be carried out in identifying the relationships between each peak of the signal spectrum and the waves of the cardiogram time dependences, as well as determining the relationship between cardiovascular diseases and harmonic components of the signal. An important step in the study of the spectra is to find the frequencies corresponding to the narrow and high peaks R. This signal is necessary to process in time-domain and using wavelet analysis separately.
Statement on ethical issues
Research involving people and/or animals is in full compliance with current national and international ethical standards.
Conflict of interest
None declared.
Author contributions
The authors read the ICMJE criteria for authorship and approved the final manuscript.
References Electrocardiogram frequency characteristics study by processing and analysis of the signal in time domain and spectral domain
- 1. Akselrod S, Gordon D, Ubel FA. Power spectrum analysis of heart rate fluctuation: A quantitative probe of beat-to-beat cardiovascular control. Science. Jour¬nal of Electrocardiology. 1981;213(4504):220–2.
- Ryan SM, Goldberger AL, Ruthazer R. Spectral analysis of heart rate dynamics in elderly persons with postprandial hypotension. The American Journal of Cardiology. 1992;69(3):201–5.
- Mashin VA. Factor analysis of the heart rate spec¬trum. Biophysics. April 2011;56(2):286–97.
- Rudenko M, Zernov V, Voronova O. Fundamental Research on the Mechanism of Cardiovascular Sys-tem Hemodynamics Self-Regulation and Determina¬tion of the Norm-Pathology Boundary for the Basic Hemodynamic Parameters and Analysis of the Com¬pensation Mechanism as a Method of Revealing the Underlying Causes of the Disease. Heart Rhythm. No¬vember 2012;9(11):1909.
- Kulessa B., Srokovski T., Drozdz S. Spectral Prop¬erties of ECG Series. The Henryk Niewodniczanski Institute of Nuclear Physics, Cracow, Poland, Annual Report 2001.
- Soorma N., Singh J., Tiwari M. Feature Extraction of ECG Signal Using HHT Algorithm. Int. Journal of Engineering Trends and Technology (IJETT), 2014; 8 (8): 454-460
- Rangayyan RM. Analysis of biomedical signals. A hands-on approach. Moscow: FIZMATLIT, 2007. 440 p. [in Russian]
- Proskurin SG, Avsievich TI. Spectral analysis of self-oscillating motility in an isolated plasmodial strand of physarum polycephalum. Biophysics. 2014; 59(6):928-934.
- Avdeeva DK., KazakovVY., Natalinova NM., Ivan¬ov ML., Yuzhakova MA., Turushev NV. The simula¬tion results of the high-pass and low-pass filter effect on the quality of micropotential recordings on the elec-trocardiogram // European Journal of Physical and Health Education. 2014(6):P. 1-10.
- Fedotov AA. Selection of Parameters of Band¬pass Filtering of the ECG Signal for Heart Rhythm Mon-itoring Systems // Biomedical Engineering. 2016(50): 114-118.
- Fedotov AA., Akulova AS., Akulov SA. Analysis of the parameters of frequency filtering of an elec-trocar-diograph signal //Measurement Techniques. 2015(57): 1320-1325.
