
Enabling Data-Driven Governance through Collective Analytics: Challenges and Framework for Indian E-Governance
Journal: International Journal of Information Engineering and Electronic Business @ijieeb
Article in issue: 4 vol.18, 2026.
Free access
The demand for data-driven insights in government has highlighted the importance of collective analytics. This study attempts to explore the key challenges of collective analytics in the context of Indian e-governance and the framework for addressing them. The study is based on a literature review, references to two cases, and expert views obtained from professionals involved with analytics solutions in government. In this study, analytics projects are considered as dashboard-based analytics. Based on the content analysis of expert responses, 14 key challenges of collective analytics in e-governance have been identified. The novelty of the present study is the focused exploration of challenges and their framework related to collective analytics in e-governance-a topic that received limited attention in the extant literature. This study brings forth the fact that unless the challenges of collective analytics in e-governance, including those related to data visualization, data quality, capacity building, technological capabilities, and inter-agency communications, are recognized, the implementation of collective analytics can be challenging. This study provides the basic understanding needed for data-driven governance through collective analytics. The output of the study will be helpful to the managers, e-governance experts, academicians, planners, and policymakers to understand the dynamics of collective analytics in government for handling discussed challenges well in advance. This study will also helpful to reduce the cost and time of the collective analytics project for effective decision-making.
Short address: https://sciup.org/15020600
IDS: 15020600 | DOI: 10.5815/ijieeb.2026.04.01
Text of the scientific article Enabling Data-Driven Governance through Collective Analytics: Challenges and Framework for Indian E-Governance
Published Online on August 8, 2026 by MECS Press
Data analytics has emerged as a key tool in contemporary governance, facilitating evidence-based policy formulation, effective use of resources, and better public service delivery. For the promotion of public service delivery and data-informed decision-making, data analytics is now being utilized in all sectors of Indian e-governance. By rigorously examining massive amounts of structured and unstructured information, governments are able to reveal patterns, forecast outcomes, and assess the effectiveness of policies and programs. This analysis ability enables proactive decision-making, improves transparency, and enhances accountability in the administration process. Most importantly, data analytics in government for public purposes is executed through interactive dashboards that display data in a visually interpretable format, making it easier for policymakers and government institutions to understand. In this study analytics output is referred for dashboards-based analytics.
Most dashboards are tailored to address the selective information requirements of the particular department, ministry, or project. Yet, one of the key challenges with contemporary e-governance practice is that there is inadequate integrated, cross-sectoral analysis of data. Insights from isolated data sources tend not to offer a full view of regional or national performance. Consequently, stakeholders are required to refer to several dashboards on various platforms to get an overall view of the status of a state or district. To bridge this fragmentation, the government has made steps towards
This work is open access and licensed under the Creative Commons CC BY 4.0 License.
building combined platforms for collective data analytics to promote cross-ministerial understanding and more integrated governance. Collective analytics is instrumental in driving e-governance by making it possible to have combined insights between departments, schemes, and levels of administration. While standalone data analysis cannot aggregate and correlate multiple datasets, collective analytics supports holistic decision-making and more informed policy interventions by making it possible to aggregate and correlate different datasets.
By use of the potential of information technology, the government has initiated multiple flagship schemes with their operational monitoring for better results. The selective implementation and strategic planning of government can be enhanced through collective monitoring of key performance indicators (KPIs) from these schemes. The collective data analytics can help to generate data-driven insights by exploring correlations among these schemes. Different components of data analytics play a critical role in the execution of collective data analytics. The objective of this study is to explore the challenging factors for collective analytics applications in e-governance. For this study, the scope is limited to Indian e-government projects only.
Various research works have analysed different dimensions of data analytics, relating to applicability and design frameworks, maturity models, statistical approaches, data management practices, visualization, and project implementation, both in general contexts and in specific sectors, organisations, and countries. Relatively few academic works regarding collective data analytics exist in the realms of e-governance, especially with identification and management related to challenges being the focus. This paper, therefore, tries to fill this knowledge gap by investigating key challenges related to collective analytics in e-governance and developing a framework to handle such challenges. It also seeks to help government institutions in designing effective analytics frameworks. This study, conducted in the context of Indian e-governance, is guided by the following objectives:
• To explore the collective data analytics in e-governance through cases
• To identify the key challenges associated with collective data analytics in e-governance
• To develop framework to handle the challenges of collective data analytics
2. Related Work
The study will be helpful to the e-governance experts, academicians, managers, planners, and policymakers to understand the dynamics of collective analytics in government for handling discussed challenges well in advance.
A critical review of the available literature was done with the aim of exploring the status of research in the area of collective analytics in e-governance. While there is extensive research done on data analytics and its usage at the level of individual governmental functions, research on collective analytics incorporating data from various projects, schemes, departments or ministries is limited. It is where the significance of studying the frameworks, challenges, and best practices implicated in implementing collective analytics in e-governance draws attention. Exploration of literature has been conducted for learning themes related to collective analytics challenges in the e-governance which suggests scarce work from the point of view of management for exploration of challenges involved in the implementation of collective analytics for the e-governance project.
The exponential growth in the availability of data, capacities for integration, scalable architectures, and computer power has increased organizational dependencies on technology-based decision-making. However, some serious challenges are always imminent in the successful execution of analytics projects. These must be addressed in order to ensure success and the sustainability of analytics projects. Enhancing the utility of data analytics for governance involves addressing several key operational and structural issues. These include good data and information management, coordination on analytics among teams, strong monitoring activities, and good project management observing strict compliance to set procedures [1]. On the e-governance platform, additional barriers that interfere with the execution of the program include shortage of skilled man power [2], technological constraints, legal and moral impediments. An end-to-end data life-cycle model has been developed specifically for the public sector to enable data-driven governance. This structure is vital in determining how government agencies can efficiently collect and analyze data to inform collective decisions [3]. In the end, actionable outputs and a sound data governance mean that both the opportunities and leverage and the risk inherent in collective analytics are well known.
Challenges with visual analytics also include supporting scalability of visualizations, automating visual analysis, data summarization, and analyzing high-dimensional data [4]. Furthermore, there are six specific challenges for data-centric visual analytics: adapt to evolving data, consider edge cases, transcend technical barriers to insight, manage data-dependent interactions, express data mappings, and maintain mapping-integrity throughout iterations [5]. Moreover, building organizational capacity in general, and particularly in governmental organizations, necessitates a comprehensive training regime designed to prepare individuals with pivotal skills to derive insights powerfully. The “three-legged stool” of resources to help foster success in programs consists of technical expertise (e.g., data handling and computation), theoretical knowledge (enhanced through exemplary sessions), and cross-sessions collaboration [6]. Finally, for data analytics projects, the greatest impact of all is realized when the purpose and intent of the data-collection initiative are well-defined. Then, its information value will be determined by the quality, accuracy, and scalability of the information as well as by whether the collection process that has generated the information is sustainable in time [7].
A comprehensive literature review was done using keywords like "data analytics," "visualization," "analytics," and "challenges" across major academic databases. The review indicated that, although there is a considerable amount of literature on general data analytics and visualization, studies specifically related to collective analytics, particularly in the context of e-governance, are considerably limited. Based on the available literature and assuming that many challenges related to general government analytics may also be applicable to collective analytics, some key challenges commonly associated with data analytics in the public sector are summarized in Table 1. This synthesis provides the foundational understanding needed for further investigation into the unique complexities of collective analytics within e-governance.
Table 1. Data analytics challenges.
|
Challenges |
Description |
Source |
|
Scalability, Interaction, Infrastructure, and trustworthiness |
There are rapid advances in computing and interaction technologies. The trustworthiness of visual-analytics applications, which is one of the most important evaluation criteria. |
[8] |
|
Scalability, data visualization and information security |
Converting data into well-informed is requires computing, processing and presentation data architecture. |
[9] |
|
Data availability, relevance, and integrity |
This relates to availability, ownership, and integrity of data. The data capture ability is also essential. |
[10] |
|
Trained analytics expert |
Being an evolving field, data analytics activities requires to be handled by dynamic and skilled experts. |
[11] |
|
Data Privacy Issues |
The data has to be used for the purpose it is collected with due care of data privacy issues. |
[12] |
|
Perception and Cognition |
Visual analysis needs careful design of appropriate human-computer interfaces using computation and algorithms. The output should be clear and non-ambiguous. |
[13] |
|
Data quality |
Data quality mainly includes data completeness, consistency, accuracy and efficient approaches for missing value handling. |
[14] |
|
System interactive and reactive |
Keep the system interactive and reactive. |
[15] |
|
Data integration, data privacy and security |
Integration of heterogeneous data from various sources, and ethical considerations around data security and privacy. |
[16] |
|
Data quality and graphical presentation |
The concepts of data quality, and analysis algorithm required to be appropriately applied in the visual analytics. |
[17] |
|
Data and analytics strategy |
Organization need data and analytics strategy along with right people to effect a data-driven cultural change. |
[18] |
|
Return on Investment, Technology, Security and privacy |
Without financial means and/or a clear ROIs is required for investment in analytics technology with due care of security and privacy. |
[19] |
|
Domain experts, infrastructure, security |
Availability of business domain expertise with sufficient infrastructure and security for processing and presentation of information. |
[20] |
|
Clear business objectives, technical expertise |
Clear business objectives with technical expertise help to design the visualization for effective utilization. The technical expertise includes data processing, design and analytical capabilities. |
[21] |
|
Simplicity in presentation with features in visualization |
Simplicity in visual presentation, comparing capability, search feature, change and correlation presentation. |
[22] |
|
Scalability and Uncertainty |
The scalability is required in terms of size, dimensionality, data types, and levels of quality considering uncertainty about visualization use. |
[23] |
Government traditional analytics is usually one organization examining its own data to inform internal decisionmaking or policy development. Problems there are typically limited to data integrity, employee competence, or inefficiency of the systems with that agency. Collective analytics, in contrast, involves cooperation between multiple government or external parties such as academia, industry or NGOs, sharing data sets. This adds an additional layer of complexity: cross-agency governance, boundaries on sharing data, legislation, variable standards, frequency of data, and competing priorities. Unlike conventional analytics, collective analytics requires harmonized environment, inter-organizational collaboration, and shared responsibility, hence its challenges are more complicated and systemic. Unlike regular analytics, collective analytics requires process harmonization, joint responsibility, and a governance structure for secure and ethical cooperation without borders. The issues of ordinary analytics and collective analytics are summed up in Table 2.
Table 2.: Normal and collective analytics challenges
|
Challenge Area |
Normal Analytics |
Collective Analytics |
|
Governance Complexity |
Internal governance structures suffice |
Requires cross-agency governance, coordination, and shared accountability |
|
Regulatory Issues |
Mostly internal compliance (e.g. data protection laws) |
Inter-agency legal agreements, privacy conflicts, ownership issues |
|
Interoperability |
Limited need for data standardization |
High need for standards, APIs, metadata alignment |
|
Technical Infrastructure |
Often tailored to internal systems |
Needs integration of different systems/platforms |
|
Data Quality Issues |
Focused on cleaning and maintaining internal datasets |
Data inconsistency, format mismatch, and bias across sources |
|
Trust and Collaboration |
Internal trust and communication |
Requires trust-building across agencies and stakeholder groups |
|
Human Capacity |
Internal staff capacity and skills |
Requires skilled coordination and diverse technical/legal skills |
|
Cultural Resistance |
Within a single organizational culture |
Between different agency cultures and priorities |
|
Performance Measurement |
Direct impact on internal KPIs or service delivery |
Difficult to define joint KPIs, attribution across organizations |
|
Sustainability and Funding |
Managed by one budget or department |
Complex funding structures; shared or unbalanced resource contributions |
Explored literature highlighted the necessity for a framework to comprehend and deal with the challenges associated with collective data analytics within government. Algorithmic State Architecture framework is suggested that outlines how digital public infrastructure, policy data, algorithmic governance, and technology integrations to facilitate integrated government analytics systems [24]. A structure for data and analytics transformation within the public sector is highlighted 4 pillars: culture and leadership; data governance; technical foundation; and value delivery, along with raising concerning challenges like fragmented data landscapes, talent scarcity, privacy threats, and slow-moving bureaucracy [25]. Success factors and challenges for e-governance analytics projects in India are; finding out important dimensions like technical infrastructure, readiness of governance, data quality, and sustainable and flexible analytic systems [26]. On the policy front, the National Data Sharing and Accessibility Policy [27] describe the principles for non-sensitive government data sharing in machine readable formats, hence set a policy framework supportive of collaborative analytics by ensuring openness, transparency, and data quality. In the same way, the expert committee on the Non-Personal Data Governance Framework [28] has laid down standards to regulate the technology architecture, legal boundaries and the governance mechanism to monitor the sharing of non-personal data between the government and business entities. The above developments all seem to be indicating towards an evolving ecosystem, conducive for systematic frameworks for collective data analytics. Importantly, for such frameworks, the foundation needs to be strong in terms of policy-readiness, sound technology architectures, adequate infrastructure, effective governance models, and full stakeholder engagement.
International benchmarking through the OECD DGI and the UN E-Government Survey, for instance, shows that the problem of collective data visualization through dashboards is not unique to any one environment but is systemwide. Leading groups of countries (Korea, Denmark, and the United Kingdom) stand out with the highest scores in key enablers such as ‘digital by design’ in a ‘data-driven public sector’ using a ‘government-as-a-platform’ model. Such benchmarking positions suggest the existence of comprehensive and balanced digital governance models including a proactive exception for high quality data sharing and visualization [29,30]. However, the benchmarking data consistently show that many countries, in particular those in the lower tiers of the DGI and UN indices, lag behind in open-by-default, user-driven, and proactiveness dimensions, resulting in fragmented dashboard approaches due to lack of interoperability, weak cross-agency data stewardship, and gaps related to algorithmic transparency and skills development [30,31]. International frameworks such as those mapped by the OECD, European Interoperability Framework (EIF), and UN recommend whole-of-government strategies, regular impact evaluation of data initiatives, centralized responsibility for digital policy, and adaptive governance arrangements to address these visualization challenges [29,32]. Collectively, these comparative reviews highlight the need for governments to institutionalize strategic and interoperable dashboard systems, with strong mandates for data access, end-user support, and continuous monitoring, to foster more human-centered, actionable collective data analytics worldwide.
3. Research Methodology
To understand the collective analytics e-governance projects, two existing collective analytics projects of Indian egovernance have been explored and discussed in detail. On the basis of factors like need, output, features, involvement of entities, and technology involvement in projects, the foundation for discussion points has been prepared. For identification of challenges of collective analytics in e-governance projects, informal interviews were carried out with experts who have theoretical and practical exposure in the area of data management, analytics and project management under government sector and then analysed using qualitative analysis methods for result generation. The identification of problems was the starting point of this research, which continued with a literature review to understand the existing work about collective data analytics challenges in e-governance. In this study, With consideration of limitation of literatures and real collective analytics project in Indian government context, mixed approach of expert opinion methodology over limited literature output has been adopted to get the more appropriate output. The research uses a qualitative, systematic research methodology to develop conceptual framework based on identified critical challenges and their possible solutions regarding collective analytics implementation across Indian government agencies. The richness and complexity of multi-agency collaboration and the particular socio-political environment of Indian governance make the research utilize various sources of data such as literature, case studies, and expert interviews to thoroughly investigate the issue at hand. The methodology brings together evidence from research literature, government policy, and practitioner perspectives. The research approach is shown in Fig.1.
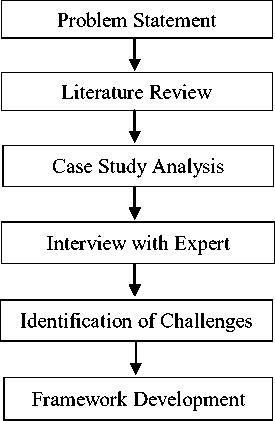
Fig. 1. Research Methodology.
Systematic literature review was undertaken to find previous studies on collective analytics, data governance, and inter-agency collaboration in the government setting of India. The review was primarily on peer-reviewed papers, government policy reports, and published technical reports. Two Indian government initiatives demonstrating collective analytics were chosen for in-depth case study examination. One project involved many sectors including healthcare, agriculture, education, social development, rural development, urban development etc. Another project is regarding several initiatives towards digital service delivery to the public through Information communication technology-based projects. Both cases are analytics for utilization, data representation, simplicity in operation, inter departmental information etc.
Seventeen experts were interviewed in person with clear and detailed descriptions of the interview questions along with analytics challenges collected from literature review. Open-ended questions related to collective data analytics in government were discussed by the respondents with well explained background of this study. Interviews focused on technical, operational and managerial challenges encountered in collective analytics projects. To interpret different aspects of the interest element, thematic content analysis organizes and describes the collected information in detail. The patterned responses found in the collected information are represented by the themes. Data was analyzed through thematic coding enabling systematic identification of recurring themes and unique challenges in the Indian context. Insights from the literature review, case studies, and expert interviews were synthesized to develop a multi-dimensional framework that articulates the challenges of collective analytics in Indian government. The framework highlights dimensions such as governance and policy, technical infrastructure, data quality, organizational capacity, ethical considerations, and sustainability.
4. Collective Data Analytics Cases in Indian e-Governance
Collective analytics 1 : Indeed, a basic prerequisite to effective collective analytics is clean, timely and standardized data from various sources. Given this strategic importance of data and the increasing maturity of egovernance adoption, the Government of India has taken various initiatives to institutionalize the culture of collective analytics across its departments. One such important effort is the Dashboard for Analytics Review of Projects Across Nation-DARPAN [33]. The DARPAN portal was developed to make analytics dashboards easier to deploy across government organizations. DARPAN makes it easier to build monitoring dashboards in near real-time with low technical complexity. It does so by aggregating data from various sources in standard forms and at pre-defined periodicities, typically through web service-based APIs.
A strong example of the usefulness of this platform is the MeitY Dashboard. It is one of the prominent examples of shared analytics, aggregating data from various central schemes and departments of the government. Some major programs associated with this dashboard include Aadhaar, CSC (Common Service Centre), MyGov, eHospital, and eScholarship, to name a few. The data is collated, analyzed, and then presented in both tabular and graphical formats for high-level overviewing and drill-down to granular organizational or project-level measures. Bringing multiple agency insights together on one platform, DARPAN is an example of how collective analytics can result in more visibility, relative performance of departments, and evidence-based informing of policy. On the other hand, it highlights issues that stand the test of time, such as the need for interoperable standards of data, the complexities of maintaining APIbased flows of data, and governance mechanisms to enable data accuracy and frequent replenishment across diverse systems.
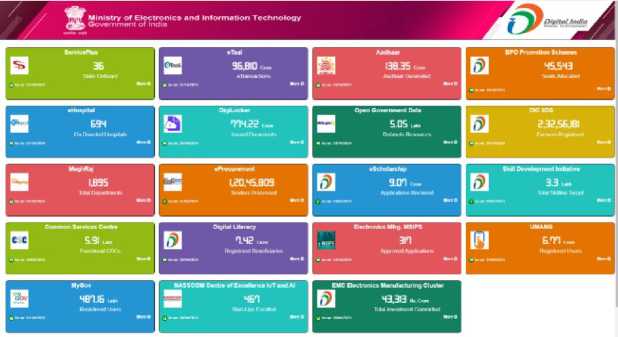
Fig. 2. Meity dashboard using DARPAN .
Collective analytics Case 2: The National Informatics Centre (NIC) under the Ministry of Electronics and Information Technology (MeitY), Government of India, is at the forefront in propelling e-governance initiatives in the country. In its bid to push collective data analytics, NIC has created the 'Prayas' platform—a governance initiative through data with the goal of presenting an integrated and consolidated picture of the achievement of flagship government schemes [34]. Built on a vision of facilitating evidence-based policy making and effective management, Prayas facilitates real-time monitoring and analysis by visualizing core performance indicators (KPIs) within ministries and departments.
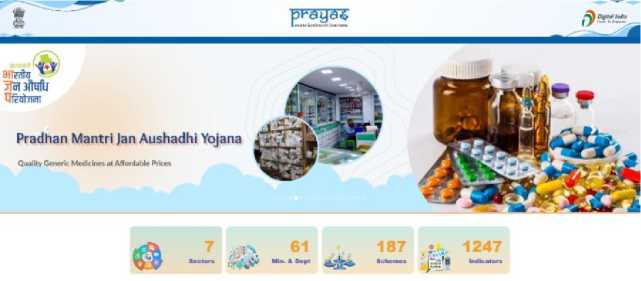
Fig. 3. Login page of project ‘Prayas’ .
The platform collects data from multiple scheme-level IT systems, which is electronically gathered through standardized API connections at pre-determined periods, formats, and levels of granularity. This ensures coherence and facilitates the upkeep of a ‘single source of truth’ among government agencies. Today, ‘Prayas’ consolidates 186 schemes of 61 ministries and departments, making it possible for stakeholders to track performance along dimensions like geography (state/district), time, department, and scheme-level output. The 'Prayas' common analytics platform effectively enables the generation of actionable insights, thus informing timely interventions and improved service delivery, with enhanced governance transparency. However, this initiative also brings to the fore critical challenges that naturally come with collective analytics: the imperative of standardized data harmonization, better inter-agency coordination, and effective data governance mechanisms that ensure consistency, timeliness, and security regarding data sharing. Deploying such platforms at scale within India's federated governance framework introduces particular institutional and technical complexities that require ongoing, dedicated interdepartmental coordination.
The two e-governance instances of collective analytics, Prayas and the DARPAN-based MeitY Dashboard, offer significant empirical insights into how multi-agency data consolidation is institutionalized in the Indian e-governance context. While both these massive government reform projects to unify various data sources and synchronize KPIs for the real-time evaluation of different schemes are, their implementation stories, when taken together, reveal a range of systemic bottlenecks that emphasize the need for the framework developed in this paper. The ‘Prayas’ platform, which merges KPIs of 186 schemes from 61 ministries, is a clear example of the scale and the complexity that cross-sectoral coordination in India has. The architecture, which makes use of standardized APIs, pre-defined update cycles, and centralized data governance, is a strong confirmation of the operational feasibility of a common ‘single source of truth’. However, the current evaluations indicate that there still is a widespread concern regarding readability of dashboard results and the ability of policy-makers to respond. The key issues pertain to irregular data refresh times, perplexing metadata standards, changing data ownership between departments, and varying data granularity from schemes to schemes.
Similarly, while the DARPAN-based MeitY Dashboard is an easy-to-use interface that lends itself to rapid understanding of government digital initiates, it also creates challenges related to data quality, the various formats in which this data is collected, over-reliance on individual departments to update respective data, and the lack of flexibility in the customized KPIs necessary for adequate cross-scheme comparisons. The combined knowledge from these two cases not only confirms known issues but also provides conceptual-level refinement by illustrating that data quality, governance coherence, and infrastructural interoperability are, in fact, linked. The cases demonstrate that a collective dashboard is neither a finished technological product nor a fully realized institutional system. Hence, this justifies the claim that government collective analytics need a socio-technical model with multiple layers as opposed to one dimension of purely technological solutions. Field output from Prayas and DARPAN substantiates further that challenges such as granularity mismatch, ownership ambiguity, and capacity gaps are systemic features of this ecosystem, and do so by contributing to theoretical insights about how government analytics needs to be conceptualized.
From an applied perspective, both Prayas and DARPAN make a strong case for the multi-stage process proposed in this paper. The operational challenges of the two platforms map neatly onto key initial phases of the model – stakeholder scoping, compliance readiness, data architecture development and capacity building. With such complexity around execution start to realise that well-delineated governance, standardized API protocols, own metadata standards agreed upon and common data updating agreements are the absolute minimum requirements for large scale collaborative analytics efforts. The principle learned on the practical side was: don’t try to turn a poor design for a user interface into something more robust like the dashboard sustainability of that ecosystem depended on institutional alignment, better data pipelines and institutionalizing routine feedback within government workflows.
The two case studies illustrate both the theoretical contribution and practical implications that the framework is designed to offer. They provide empirical support for the claim that interventions will not solve the intricate issue of realizing collective analytics; they suggest that there is an imperative to develop structured, sequential, and governancebased approaches. The above inherent limitations of Prayas and DARPAN are strong pointers for a holistic approach that considers the heterogeneity of data, embeds strong compliance mechanism, integrates capacity building and ensures sustainability. Thus, the study of the cases not only confirms the framework but also robustly establishes the conceptual soundness and practical usefulness of the framework to assist future endeavors of collective data analytics in the context of India s e-governance landscape.
5. Challenges of Collective Data Analytics in Government
The documentation about collective analysis in government that was gathered by interviewing experts was analyzed by applying the technique of thematic content analysis. The initial stage of open coding was applied to the data in order to detect and find relevant units of meaning. Now axial coding grouped the coded concepts tagged to each other for conceptual relatedness. To conclude, selective coding integrated categories into core categories, which led to identifying the major barriers to the exploitation of collective analytics in an e-governance setting. This stringent, multi-phase procedure ensures a requisite methodological rigor and findings dependability. The thematic framework that emerges points to structural, technology, organizational, and policy-level issues, providing critical analysis of the systemic intricacies of improving collective data analytics in the public sector. Based on expert interviews, the main issues unique to the application of collective data analytics in the Indian e-governance environment are outlined and discussed as:
-
5.1. Grouping of data sources
-
5.2. Selection of KPIs
-
5.3. Technological capabilities
-
5.4. Tools and methodologies
-
5.5. Management supports and enforcement to accept solution
-
5.6. Lack of guidelines and regulatory framework
-
5.7. Training and capacity building
Effective collective analytics needs judicious choice and accumulation of data sources around common parameters and thematic fit. In e-governance, data is generally siloed by business domain as per e-governance system. Selection of common attributes (e.g., state, district, gender, age etc.) across schemes is required to make integration meaningful presentation of information. Random aggregation of non-related subjects, does not make analytical sense. The decision regarding grouping of data should be carried out at the time of conceptualization of collective analytics applicability, considering the understanding of the e-governance project requirement.
Collective analysis is always based on selected parameters of interest in terms of KPIs. The KPIs should be selected considering desired output of collective analytics and possible common factors among multiple data sources. The possibility of data integration through master data management plays an important role in KPI selection. The data format and types are also critical for KPI selection. For collective analytics, the data update frequency of the same type of KPI across multiple data sources is required to be uniform. These selected KPIs should be reviewed at a specific time interval for addition and modifications.
Technological capabilities denote the potential of system in terms of information processing capabilities, information integration, customization modularity, effective information presentation, compliance adherences capabilities, upgradation feasibility, etc. The associated challenges can be avoided by the selection of appropriate tools, technologies and right stakeholders. The technical know-how of operational manpower also contributes for the effectiveness of technological capabilities of analytics projects in government. In current scenario inter-platform communications across cloud / infrastructure is also important for collective analytics in government.
The development pace of analytics technologies poses challenges in selecting suitable tools and techniques for egovernance analytics initiatives. These tools, both proprietary and open-source, are accompanied by different capabilities and limitations. Governmental procurement is usually involving since it's often required to comply with rules and guidelines. In collective analytics, the processing and integration of large volumes of data from various sources are central to it, which demands robust solution design underpinned by ETL (Extraction, Transformation, Loading) processes, APIs, and platforms such as data warehouses or Big Data systems. The efficiency of these tools resides in the associated data handling and visualization capabilities. Having expert professionals participate can alleviate these technical and operational complexities.
Analytics solutions always get developed as add-on or on top of the existing management information system and reports. It is another challenging task to convince and force the organization or users to adopt analytics systems with faith in output. This is a time-consuming process with phased manner disconnection of the previous system, if any. For collective analytics, management support becomes critical considering the involvement of multiple data and related stakeholders and the need for coordination among them. The management support is also required for availability of required resources, strategic planning for sustainability of the project, phased-wise value addition or upgrade of the existing solution, etc.
Collective analytics solutions usually entail various stakeholders like data providers, decision-makers of KPIs, analytics users, and technology specialists. One of the main challenges is that there are no well-defined roles and operational procedures, which makes it difficult to coordinate and scale. It is necessary to define structured responsibilities among different stakeholders to enable seamless project execution. In addition, such roles and rules must be periodically reviewed based on changing project requirements and clearly communicated for compliance and continued cooperation throughout the lifecycle of the collaborative analytics endeavour.
Data analytics is a multidisciplinary subject area other than core business knowledge. Training and capacity building are applicable for both existing manpower as well as additional data scientists and analytics experts. Training and capacity building are challenging in terms of cost and time-consuming activities, with a lack of appropriate measures to evaluate the improvements. To dilute this challenging factor, there should be well-planned strategic planning for training and grooming of stakeholders since conceptualization of the project. These trainings can be related to technical and functional aspects.
-
5.8. Reliable maintenance
-
5.9. Lack of business domain to data experts
-
5.10. Managing large and variety of data set
-
5.11. Data Visualization
-
5.12. Data Security
-
5.13. Non-uniform data frequency and granularity
-
5.14. Coordination among multiple stakeholders
Collective analytics projects are most vulnerable for maintenance because of the speed of technological change and multiple stakeholders. Analytics tools and platforms need constant updates to ensure performance and effectiveness, even in more complicated and multi-agency scenarios. Proper mitigation involves choosing stable, well-supported technology and employing a technically sound staff with foresight. Also, looking ahead to future requirements—like data expansion and scope enlargement is important for guaranteeing long-term maintainability and scalability of collective analytics solutions.
Solutions in group analytics are asked to leverage first principles from one or more domains, or require expertise in one or more sufficiently related domains. This knowledge of the domain needs to be combined with data expertise to enable right data treatments leading to right data contextual interpretations on one hand and with visualization expertise to enable effective communication of the findings through dashboards on the other. It’s a very hard barrier to achieving that kind of domain knowledge: how to tell it to analytics people. This is largely because each domain has different size and complexities. The lack can be met with a cross disciplinary approach which includes expertise both in the data and in the domain.
Collective analytics is together the analysis of data from multiple sources for insights across a set of diverse KPIs, hence storage in a shared space and retrieval mechanisms with scalable features are both needed. This creates inherent scalability challenges, in terms of capacity for storage, complexity for integration and latency for on-line access, for massive collecting of hybrid data. Efficient constructs like data warehouse or big data can fetch results fast and scalable. The quality of dashboard relies on solution involving safe data acquisition protocols, maintaining data uniformity, refresh rate, data variety. Pre-emptive strategic architectural design is critical for reducing operational and performance challenges in collective analytic environments.
Successful interpretation of collective analytics results demands meaningful and clear data visualization, often using graphs, charts, tables, and infographics. Choosing good visual formats, making the design visually appealing, providing context, selecting appropriate colors, fonts, and titles, and making drill-down feasible are some of the major challenges. Designing a dashboard gets quite complicated while combining data from various sources. These problems can be solved by engaging cross-functional specialists in design, analytics technologies, business domains, and project management to assure usability, clarity, and relevance of visual results.
Data security issues increase with the increase in data volume for analysis. This raised the need for security measures enhancement to minimize the risks of potential attacks. In India, several guidelines have been issued for information security compliance of e-governance applications. In a collective analytics project, data security risk is associated mainly with data collection from multiple sources, data management, and access mechanisms for the final analytics output. Regular vulnerability assessment, security audits, and security guidelines compliance help to minimize the data security risk. The data privacy risks can also be minimized by encryption and pseudonymization methods.
Data frequency denotes how frequently data is being updated, from hourly to quarterly frequencies. Data granularity indicates the most minute unit of information, e.g., states, districts, or villages in the Indian context. Combining data from different sources with differing update frequencies and granularities is a challenging for collective analytics. Such intricacy can be controlled with accurate planning and diligence at the design stage of analytics output to guarantee consistent, accurate, and significant convergence of disparate datasets to facilitate good decision-making.
With dependence on diverse data sources, regular coordination among owners of data is needed in order to provide timely updates congruent with analytical requirements. Important stakeholders are end users, technology and analytics professionals, data managers, business experts, security professionals, and project managers. Long period collective analytics projects need good communication and cooperation among related groups. Clear instructions, well-defined roles, and effective project management are needed to enable coordination, obtain necessary approvals, and distribute resources effectively to ensure smooth functioning and ongoing enhancement of collective analytics efforts.
6. Framework for Data Analytics in Government
Data itself has no value; the real value comes through analytics by combining, presenting in context, and finding structure and correlations within the data. Collective data analytics also acknowledges the insights from data and starts sharing these insights to make synergy between the information technology experts and business disciplines. Based on information collected from respondents, the collective analytics information framework related with data consists of four components; situation, processes, activities and output. The developed information architecture from perspective of data for collective data analysis in e-governance is as in Fig. 4. :


Situation
Different Data Sources
Different Data storage technologies
Different data Masters
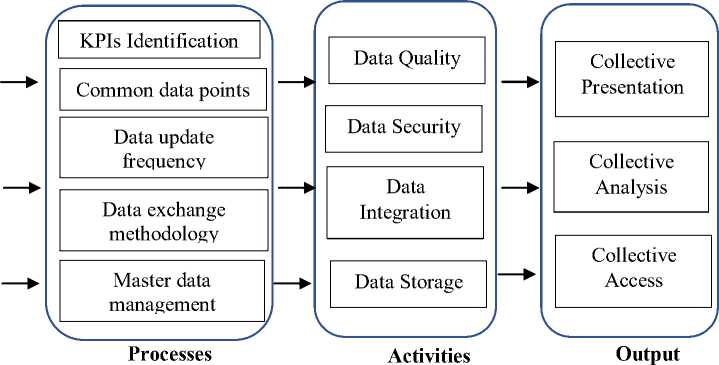
Fig. 4. Information framework for collective analytics.
To make this actionable, the phase-wise approach as a framework for assessing the challenges in a government body or across multiple agencies is presented in Table 3:
Table 3. Framework of collective analytics in government.
|
Phase |
Activities |
Possible Indicators |
|
Phase 1 : Scoping and Stakeholder Mapping |
Identify agencies, roles, data sources, stakeholders, existing policies. |
Missing stakeholders; unclear roles; no mapped data flows. |
|
Phase 2 : Governance and Compliance Readiness |
Examine existing compliance/policy frameworks, data-sharing rules, privacy safeguards. |
Conflicting guidelines; absence of data sharing standards; grey zones in data ownership. |
|
Phase 3 : Infrastructure and Data Architecture |
Review systems, standards, interoperability, metadata, pipelines, storage. |
Multiple incompatible systems; inconsistent metadata; rigid monolithic systems; insufficient capacity. |
|
Phase 4 : Data Quality Assessment |
Check for missing data, biases, timeliness, consistency across sources. |
High missing rates; delayed updates; discrepancies among duplicate sources. |
|
Phase 5 : Skills, Capacity and Culture |
Assess human resources, technical expertise, data literacy; organizational incentives; data use culture. |
Key roles unfilled; lack of training; decision-making outside data insights. |
|
Phase 6 : Trust, Ethics, and Public Engagement |
Check public perceptions; transparency of data use; ethical oversight; mechanisms for privacy and consent. |
Public concern; opaque algorithms; privacy incidents; lack of audit trails. |
|
Phase 7 : Value and Performance Metrics |
KPIs selection; insights use; impact on decisions/ policies changed based on data; cost/benefit. |
Dashboards with no policy action; no feedback loops; benefits unmeasured. |
|
Phase 8 : Sustainability Planning |
Budgeting; maintaining, staffing; future proofing; technology upgrade; alignment with strategic goals. |
Funding resources; systems left unmaintained; dependency on particular leaders; lack of long-term commitment. |
The suggested framework for collective data analytics in government is designed into eight sequential steps, each focusing on a particular domain that is essential for successful multi-agency data collaboration. The process starts from Phase 1 (Scoping and Stakeholder Mapping), focusing on identification of concerned agencies, functions, sources of data, and policies in place. Phase 2 (Readiness for governance and compliance) deals with data sharing governance, which identifies frequent barriers such as rule compliance and unclear data ownership. In Phase 3 (Data Architecture and Infrastructure), the IT environment is assessed, frequently identifying issues such as system incompatibility and absence of interoperability. The final stages of the framework deal with issues related to implementation and sustainability. Phase 4, Data Quality Assessment is dedicated to data quality considerations such as validity, accuracy, and consistency issues, and related issues of completeness (including management of missing data) and timeliness or latency. Phase 5: Capacity, Skills and Cultures the human side of the equation – from gauging data literacy, training to enable new skills or changing culture to be more data-driven. Step 6: Ethics, trust and public engagement focuses on transparency, ethical safeguards and trust building, with a particular focus on concerns about potential intrusions into privacy from covert algorithms or weak procedures for obtaining consent. Then, in Phase 7 (Value and Performance Metrics), the framework is toward realizable potential (measures/metrics/performance goals for analytics dashboard). In the 8th phase, Sustainability Planning is targeted for long-term sustainability (i.e., budgeting, resource availability, technical upgrading and strategic goal alignment). It is this phased approach framework that represents the holistic diagnosis and the roadmap to action required to create and maintain government-wide data analytics ecosystems.
The proposed framework provides a holistic, rather simple view on how to address the (mutually strengthening) challenges in collective data analysis: consists of implementing clear standards, well maintained IT infrastructure, institutional readiness and sustainability. It provides a critical and comprehensive perspective of the core challenges associated with collective, dashboard-driven analytics in the context of e-governance. This also has advantages over current model like ASA standards, OECD data governance principles, general analytics frameworks in public sector. Through this research effort is made to established a conceptual framework through conventional knowledge products for further action at policy and operation level actions in the context of e-governance multi-agency analytics in India.It involved critical operational realities such as KPI harmonization, granularity mismatches, non-uniformity in frequency of data, interdepartmental coordination, and crucial dual collaboration between domain and data experts. The multicomponent information architecture and phased implementation strategy enable a concrete, end-to-end approach encompassing stakeholder mapping and data governance readiness through to technical integration, visualization, trust and long-term sustainability. It draws a connection between overarching principles of digital governance and/ or implementation barriers at the ground level. Its particular orientation to master data management, scalable data architecture, data integration, security solutions, and capacity building enhances its relevance for large government analytics ventures. Finally, since tracing its origin in Indian case studies, the proposed framework is contextually relevant, actionable at the ground level, and is better distils the complex structural, technical and organisational collective analytics at the core of the federated governance model in India.
In comparison to traditional analytical models focused on technological or governance aspects in isolation, the proposed framework systematically synthesizes the multi-layered nature of collective analytics by linking organizational, technical, and operational complexities into a coherent structure. The framework reflects that ineffectiveness of dashboards analytics solution may not simply be attributed to poor technology or unsuitable visualization methods, by the management components also impact a lot. Other aspects contributing to ineffectiveness of such dashboards are: lack of effective coordination with stakeholders, improper data management, inconsistent metadata, and weak culture of data-driven governance. The framework offers a fresh interpretation by showing how collective analytics can succeed through systematically addressing stakeholder scoping, capacity building, interoperability, and data quality.
The proposed framework elaborates that each challenge cannot be resolved in isolation, but instead, intervention is needed in all eight phases in a coordinated manner to ensure that dashboard-based collective analytics is trustworthy, has high impact, and is sustainable. The novelty of this framework is that it comprises eight interrelated phases ranging from stakeholder scoping and governance readiness to sustainable value realization covering all important aspects of governance and technology applications. The d challenges discussed and framework explicitly recognize the technomanagerial complexity of data systems, tools and methodologies selection, and KPI harmonization. The whole study is well supported by the empirical findings obtained from two national level use cases: Prayas and MeitY dashboard based on DARPAN and interviews with experts. This proposed framework and associated challenges can act as a guideline, on a quite practical and scalable level, to implement collective data analytics projects within government that would improve performance and reduce wastage of resources.
The proposed collective data analytics model is empirically validated based on multi-method research design covering both conceptual and empirical aspects. This framework is based on a sound conceptual model that integrates existing literature on analytics governance, inter-organization data integration, visualization-related issues and data management in the public sector. The two cases presented, ‘Prayas’ and the DARPAN-based MeitY dashboard, are representative of mature collective analytics solutions in Indian e-governance. These case studies afforded critical opportunities for contextual validation, as they exposed operational limitations, interdepartmental relations of coordination challenges, and system dependencies, all of which are consonant with the phased character of the model. Additional qualitative findings emerged from content analysis of the transcripts from interviews with domain professionals in analytics, data management, and government projects. This integrated approach (literature, empirical cases, expert viewpoints) is triangulated and thus has strong methodological implications to guarantee construct validity and explanatory depth, and to confirm that the proposed framework is both reliable and practically relevant in the context of the government.
This research contributes by synthesis of dashboards not as only visual endpoints but as outputs of a broader ecosystem of collective information across data sources for ease of interpretation. This perspective shifts the emphasis from tool-centric improvements to systemic reforms in data governance and managerial roles. The presented framework helpful for effective output of dashboards with long terms sustainable performance, thereby offering a more holistic and actionable roadmap for decision makers. Furthermore, by grounding the framework in Indian e-governance characterized by business complexity and heterogeneous systems, it offers context-sensitive insights that extend existing theory and address critical gaps in global digital governance research.
7. Discussion and Conclusion
The Identification of challenges related with collective analytics in government is important for prevention of possible hurdles in its implementation for public use. In this study, with combined effort of literature and two case studies, collective analytics in Indian government have been discussed for identification of associated challenges and framework. 4 pillars of collective analytics, current situations, processes involved, activities performed, and expected output also been discussed. This study highlights that unless the challenges of collective analytics, including data visualization, capacity building, technological capabilities and inter-agency communications, are recognized, the implementation of collective analytics could be challenging. The early awareness of these challenges is to a large extent what allows practitioners and policy makers to better formulate responses, and further enhance data governance and decision-making processes. Since governments are increasingly reliant on data-based methodologies, resolving these issues is significant for an effective, transparent, efficient, and citizen-centered delivery of public services. Emerging new challenges in case of collective analytics relate to the existence of barriers to sharing data between departments, permanent deficiencies concerning interoperability, diverging understandings of data among different organizations, as well as problems related to technical upgrade issues. Collective analytics also involves higher levels of collaboration, collective responsibility and well-defined governance mechanisms to ensure data consistency at the data level, which in turn is critical for appropriate joint decision making.
8. Implication and Future Work
Dashboard-based collective visualization analytics in e-governance involve multiple challenges which influence decision-making and knowledge distribution. The key challenges are: grouping of data sources, selection of appropriate KPIs, obtaining technological feasibility, selection of tools and methods, development of sound framework, up-skilling of government employees, effective data visualization, data security, knowledge of business domain, obtaining enough management support, and ensuring coordination among stakeholders. The findings of this research can fill practical vacuums and draw attention to an absence of regulation to keep track with important of dashboard development and operational indicators. The findings are expected to be useful for policymakers in terms of designing of more integrated data-driven decision-making approaches and viable analytics solutions for enhanced public service delivery. This involves institutional strengthening and support from management to collaborate across government departments to present information collectively as brought out by the study.
This study indicates a way forward for developing guidance to adopt the agile, adaptive frameworks that bring about interoperability, encourage departments to govern and share data, and allow for periodic monitoring of the outputs of dashboards. Governments must prioritize the creation of user-focused dashboards that are intended to incorporate ease of interpretation, contextual explanations, and the most recent information to guarantee the relevance of analytical products. From the perspective of management, this research promotes a continuous enhancement of skills between technical and managerial staff and the close collaboration among the technology specialist within and the business expert external to the organization to produce dashboard use–oriented outputs and iterative cycles of feedback. Most critically, the establishment of monitoring mechanisms through specially instituted governance committees would serve to substantially bolster take-up and the overall effectiveness of the dashboard-based collective analytics solutions.
The study highlights challenges for the governmental organizations to produce data-driven insights to the public and internal operations from the collective dashboards. To address the mentioned gaps, the research proposes a layered framework. The paper combines core thematic issues of governance and policy development, infrastructure and data architecture, capacity building culture, value and performance indicators, sustainability planning and critical crosssectoral collaboration. This, in turn, enables a ripple effect that boosts collective analytics potential and dashboardbased governance as a consequence. This research is limited to India only. However, the methodology and framework discussed here can be extended to global context. The paper has certain limitations in form of qualitative nature of research for identification of challenges with and framework and non-prioritization of identified challenges. Future research may also employ quantitative and systematic methods of analysis to examine and test the relationships among the factors of collective analytics in different e-governance contexts.
All the Declarations and StatementsAuthor Contributions Statement
Ashutosh Prasad Maurya – Conceptualization, Methodology, Proposed research ideas, Constructed the overall framework, Formal Analysis, Writing – Drafted the initial manuscript, contributed to the literature survey.
Pradeep Kumar Suri – Reviewed and edited the manuscript, ensured clarity and coherence, and Supervision.
All authors have read and agreed to the published version of the manuscript.
Conflict of Interest Statement
The authors declare no conflicts of interest.
Funding Declaration
This research not supported by any of the funding sources.
Data Availability Statement
This study analyzed the publicly available information in terms of literature and websites / dashboards.
Ethical Declarations
We hereby declare that this research was conducted ethically, with integrity, originality, and in compliance with all applicable academic and institutional guidelines without involving human subjects and/or animals.
Acknowledgments
We sincerely thank the experts for their valuable inputs, which have contributed to find the factors of the research.
Declaration of Generative AI in Scholarly Writing
We author acknowledge the use of generative artificial intelligence (AI) and AI-assisted technologies to strengthen the language and readability of their writing.
Abbreviations
The following abbreviations are used in this manuscript:
API - Application Programming Interface
ASA - American Statistical Association
CSC - Common Service Centre
DARPAN - Dashboard for Analytical Review of Projects Across Nation
DGI - Digital Government Index
EIF - European Interoperability Framework
IT - Information Technology
KPI - Key Performing Indicator
MEITY - Ministry of Electronics and Information Technology
NGO - Non Government Organization
NIC - National Informatics Centre
OECD - Organization for Economic Co-operation and Development
UN - United Nation
Appendix
There is no appendix for this paper.
