Evaluation of Reranked Recommended Queries in Web Information Retrieval using NDCG and CV

Author: R.Umagandhi, A.V. Senthil Kumar
Journal: International Journal of Information Technology and Computer Science(IJITCS) @ijitcs
Article in issue: 8 Vol. 7, 2015.
Free access
Tremendous growth of the Web, lack of background knowledge about the Information Retrieval (IR), length of the input query keywords and its ambiguity, Query Recommendation is an important procedure which analyzes the real search intent of the user and recommends set of queries to be used in future to retrieve the relevant and required information. The proposed method recommends the queries by generating frequently accessed queries, rerank the recommended queries and evaluates the recommendation with the help of the ranking measures Normalized Discounted Cumulative Gain (NDCG) and Coefficient of Variance (CV). The proposed strategies are experimentally evaluated using real time American On Line (AOL) search engine query log.
Queries, PrefixSpan, UDDAG, NDCG, CV
Short address: https://sciup.org/15012354
IDR: 15012354
Text of the scientific article Evaluation of Reranked Recommended Queries in Web Information Retrieval using NDCG and CV
Published Online July 2015 in MECS
-
I. Introduction
Searching Web information using search engines is a habitual activity of web users. At the end of the nineties, Bharat and Broder, 1998 [1], estimated the size of the Web to be around 200 million static pages. Gulli and Signorini, 2005 [2] pointed out that the number of indexable documents in the Web exceeds 11.5 billion. According to the survey done by Netcraft, Internet Services Company, England there is 73.9M web sites in September 2013 and 22.2M more than the month August 2013. Every year, millions of web sites are newly added in the information world. Hence a proper tool is needed to search the information on the web.
Search Engine retrieves significant and essential information from the web, based on the query term given by the user. Search engine plays an important role in IR process. The retrieved result may not be relevant all the time. At times irrelevant and redundant results are also retrieved by the search engine because of the short and ambiguous query keywords [3].
A study carried out by C. Silverstein, 1998 [4] on “private” Alta Vista Query Log has shown that more than 85% of queries contain less than three terms and the average length of the queries are 2.35 with a standard deviation of 1.74. The same researcher analyse the second AltaVista log, the average query length is slightly above 2.55. It is to be understood that the shorter length queries do not provide any meaningful, relevant and needed information to the users. In this situation, Query recommendation is an important process which analyse the real search intent of the user and provides the alternate relevant and meaningful queries as suggestions to retrieve the relevant results in future.
The recommendations made by the search engine depends on the real intent of the user. The recommended queries are ranked. The un-ranked list is evaluated using the measures precision, recall and f-measure, but the ranked list is evaluated using Mean Average Precision (MAP), R-Precision, Breakeven Point, ROC Curve, Normalized Discounted Cumulative Gain (NDCG), kappa statistics and etc. The major contributions in this proposed work are summarized as follows:
-
• Frequently accessed queries are identified using Modified PrefixSpan Approach.
-
• NDCG and CV measures is calculated for the frequent queries.
-
• The ranking order of recommended queries is
compared using CV measure.
-
• The users assigned the relevancy score for the recommended queries. The relevancy score is evaluated using kappa statistics. Finally the users are clustered based on the relevant value assigned to the recommended queries.
-
II. Related Works
Due to the enormous growth of the web information and ambiguity of query terms in which the queries are in shorter length, Query recommendation is an essential technique to suggests set of queries used in future for relevant and required IR. The goal of Recommendation Systems (RECSYSs) is suggesting items based on users profile and items content, in order to direct users to the items that best meet their preferences and profile. Different techniques suggested for the query recommendation process is center-piece subgraph [5], Query Flow Graph [6] and TQ-Graph [7]. The queries are selected and suggested from those appearing frequently in query sessions [8] to use clustering to devise similar queries on the basis of cluster membership. Clustering approach is used for query recommendation by using click-through information with query similarity [9] [10] [11]. Jones et al. 2006 [12], have proposed a model for generating queries to be suggested based the concept of query rewriting. A query is rewritten into a new one either by means of query or phrase substitutions [13] or using tools [14].
The recommended queries are ranked using weighted Ranking Support Vector Machine (RSVM) algorithm [15]. The evaluation on the performance of a ranking model is carried out by comparison between the ranking lists by the model and the ranking lists given as the ground truth. Several evaluation measures are widely used in IR. These include NDCG, Discounted Cumulative Gain (DCG), MAP and Kendall’s Tau [16]. NDCG [17] is a widely used evaluation metric for learning-to-rank (LTR) systems. NDCG is designed for ranking tasks with more than one relevance levels. Open source tools for computing the NDCG score for a ranked result lists [18] are:
-
• The LETOR 3.0 script implemented in Perl ( http://research.microsoft.com/en-us/um/beijing/ projects/letor/LETOR3.0/EvaluationTool.zip)
-
• The LETOR 4.0 script implemented in Perl ( http://research.microsoft.com/en-us/um/beijing/ projects/letor/LETOR4.0/Evaluation/ Eval-Score-
- 4.0.pl.txt)
-
• The MS script implemented in Perl
/ )
-
• The YAHOO script implemented in Python
(
-
• The RANKLIB package implement ed in Java (http:// www.cs.umass.edu/ _vdang/ ranklib. html)
-
• The TREC evaluation tool v8.1 implemented in C ( http://trec.nist.gov/trec eval/)
Nevertheless, it is interesting to consider and measure how much agreement between judges on relevance judgments. A common measure for agreement between the judges is the kappa statistic [19] [20]; it is designed for categorical judgments and corrects a simple agreement rate for the rate of chance agreement. The kappa value will be
-
• 1 if two judges always agree,
-
• 0 if they agree only at the rate given by chance,
-
• and negative if they are worse than random.
As a rule of thumb, a kappa value
-
• above 0.8 is taken as good agreement
-
• between 0.67 and 0.8 is taken as fair agreement
-
• below 0.67 is seen as data providing a dubious basis for an evaluation.
Kappa value is calculated using
p ( A ) - p ( E )
kappa = 1 - p ( E ) (1)
where P(A) is the proportion of the times the users agreed the recommended queries, and P(E) is the proportion of the times they would be expected to agree by chance [21].
-
III. Materials and Methods
Fig. 1 shows the overall process of the proposed technique. Set of queries are recommended to the web users by analysing the past behaviour of the search user. The query log is analysed and frequently accessed queries are identified by using the algorithm ModifyPrefixSpan. The authority weight and t-measure is assigned to frequently accessed queries. The queries with higher weight are provided as the recommendations to the user. In the same way frequently accessed URLs are also used in the recommendations, this technique is explained in [23]. NDCG measure is calculated for the frequent URLs which are used to identify the best technique to weight the URL. Next, the recommended queries are re-ranked using the preference, t-measure and preference with t-measure. The ranking order is evaluated by using the coefficient of variance. The users are instructed to assign the relevancy score for the recommendations. The relevancy score is evaluated and the users are clustered based on the relevancy score.
-
A. Frequent Query Generation
In order to give the suggestions to frame the future queries, the search histories are analysed. The search histories are organized under the attributes, AnonID, Query, QueryTime, ItemRank and ClickURL. The generation of association among all the unique queries are very tedious and ineffective process. Hence, the frequently accessed queries are obtained by considering the prefix patterns generation procedure. To evaluate this algorithm, real search engine query log American On Line (AOL) data set is considered [22]. The log entries are pre processed [25] and the first process in ModifyPrefixSpan identifies 7 one query sets and 1 two query set that is frequently accessed in the data set. By using these queries, totally 36 association rules are generated.
Identify Frequent Queries using ModifyPrefixSpan

NDCG measure for Frequent Queries

Ranking of Queries using t-measure

Evaluation of Relevancy Score for Recommended Queries
Fig. 1. Proposed Query Recommendation Technique
Table 1. ModifyprefixSpan – Frequent Queries
ModifyPrefixSpan ModifyPrefixSpan with Hub and Authority ModifyPrefixSpan with t-measure Frequent Queries with ID Support Frequent Queries Authority weight Frequent Queries Authority with t-measure 18 5 18 5.0 18 5.0519 17 4 17 3.9646 17 3.9936 lotto 21 9 21 7.8849 21 8.029 mickey dolenz 11 2 cliff notes 9 2 mapquest com 22 2 american spirit tobacco 33 2 18 17 2
The queries which satisfy the minimum support 2 are considered as frequent queries. The algorithm ModifyPrefixSpan [24] generates frequently accessed queries. Next, calculate the hub and authority weight for the frequently accessed unique queries which are identified from Process 1 of the ModifyPrefixSpan algorithm. The queries which satisfy the minimum authority 1 are considered for recommendation. Totally 3 queries are identified as frequent queries and 3 rules are generated. Next, t-measure is calculated for the frequently accessed items along with hub and authority weight. From 113 unique queries out of the first 200 pre processed log entries, the ModifyPrefixSpan algorithm identify 8 queries are frequently accessed and 3 queries are satisfied the authority weight. The generation of support, authority weight and t-measure are explained in [25] and it is given in Table 1.
First process of ModifyPrefixSpan, identifies 36 rules which satisfy the minimum confidence of 20 and 3 rules are identified when authority and t-measure is considered. The rules and their confidence values are given in Table 2. The association rules generate the recommendations for the queries 18, 17 and 21. For the query 18, the query 21 is recommended and for the query 17 the queries 18 and 21 are recommended.
Table 2. Association Rules and their Confidence
|
ModifyPrefixSpan Rule & Confidence |
ModifyPrefixSpan with Hub and Authority Rule & Confidence |
ModifyPrefixSpan with t-measure Rule & Confidence |
|
18 =>>21 & 28.0 |
18 =>>21 & 25.769 |
18 =>>21 & 25.774 |
|
17 =>>18 & 22.5 |
17 =>>18 & 22.611 |
17 =>>18 & 22.619 |
|
17 =>>21 & 32.5 |
17 =>>21 & 29.888 |
17 =>>21 & 29.907 |
|
11 =>>18 & 35.0 |
||
|
11 =>>17 & 30.0 |
||
|
11 =>>21 & 55.0 |
||
|
11 =>>9 & 20.0 |
||
|
11 =>>22 & 20.0 |
||
|
11 =>>33 & 20.0 |
||
|
11 =>>18 17 & 20.0 |
||
|
9 =>>18 & 35.0 |
||
|
9 =>>17 & 30.0 |
||
|
9 =>>21 & 55.0 |
|
9 =>>11 & 20.0 |
||
|
9 =>>22 & 20.0 |
||
|
9 =>>33 & 20.0 |
||
|
9 =>>18 17 & 20.0 |
||
|
22 =>>18 & 35.0 |
||
|
22 =>>17 & 30.0 |
||
|
22 =>>21 & 55.0 |
||
|
22 =>>11 & 20.0 |
||
|
22 =>>9 & 20.0 |
||
|
22 =>>33 & 20.0 |
||
|
22 =>>18 17 & 20.0 |
||
|
33 =>>18 & 35.0 |
||
|
33 =>>17 & 30.0 |
||
|
33 =>>21 & 55.0 |
||
|
33 =>>11 & 20.0 |
||
|
33 =>>9 & 20.0 |
||
|
33 =>>22 & 20.0 |
||
|
33 =>>18 17 & 20.0 |
||
|
18 17 =>>21 & 55.0 |
||
|
18 17 =>>11 & 20.0 |
||
|
18 17 =>>9 & 20.0 |
||
|
18 17 =>>22 & 20.0 |
||
|
18 17 =>>33 & 20.0 |
The two most frequent and basic measures for unranked retrieval sets in the information retrieval effectiveness are precision and recall. In Information Retrieval, the measures precision and recall is used to evaluate the retrieval process [26]. These are first defined for the simple case where the search engine retrieves set of recommended queries. Precision and Recall for the frequent and relevant queries 18, 17 and 21 are given in Table 3.
# ( relevant items retrieved) Precision =
# ( retrieved items )
relevant
= P (——?
retrieved
# ( relevant items retrieved)
# ( relevant items )
retrieved
= P relevant
Table 3. Precision and Recall for the Frequent Queries
|
ModifyPrefixSpan |
ModifyPrefixSpan with Hub and Authority |
ModifyPrefixSpan with t-measure |
||||||
|
Frequent Query |
Recall |
Precision |
Frequent Query |
Recall |
Precision |
Frequent Query |
Recall |
Precision |
|
18 |
0.333 |
1.000 |
18 |
0.333 |
1.000 |
18 |
0.333 |
1.000 |
|
17 |
0.667 |
1.000 |
17 |
0.667 |
1.000 |
17 |
0.667 |
1.000 |
|
21 |
1.000 |
1.000 |
21 |
1.000 |
1.000 |
21 |
1.000 |
1.000 |
|
11 |
1.000 |
0.750 |
||||||
|
9 |
1.000 |
0.600 |
||||||
|
22 |
1.000 |
0.500 |
||||||
|
33 |
1.000 |
0.429 |
||||||
|
18 17 |
1.000 |
0.375 |
||||||
-
B. NDCG Measure for Frequent URLs
NDCG [17] is a widely used evaluation metric used in Ranking Algorithms There are many open source tools are available for computing the NDCG score for a ranked result list. Table 4 lists the frequent queriess identified from first 200 pre-processed log entries [25] and its NDCG value. Table 5 depicts the NDCG for the frequent queries identified using the algorithms PrefixSpanBasic and MHitsPrefixspan.
Table 4. Frequent URL and its NDCG
|
n |
URL# |
relevance gain |
DCG |
IDCG |
NDCG |
|
1 |
7 |
1 |
1 |
1 |
1 |
|
2 |
51 |
1 |
2 |
2 |
1 |
|
3 |
18 |
0.6 |
2.379 |
2.631 |
0.904 |
|
4 |
17 |
0.8 |
2.779 |
3.031 |
0.917 |
|
5 |
21 |
1 |
3.21 |
3.289 |
0.976 |
|
6 |
87 |
0.5 |
3.403 |
3.482 |
0.977 |
Fig. 2 shows that the URLs 21 and 87 got the highest NDCG value of the process 2 of the algorithm ModifyPrefixSpan. That is the weight authority increases the NDCG value.
Table 5. Frequent URL and its NDCG of Process 1 and 2
|
n |
URL# |
PrefixSpanBasic NDCG MHitsPrefixspan NDCG |
|
|
1 |
7 |
1 |
1 |
|
2 |
51 |
1 |
1 |
|
3 |
18 |
0.904 |
0.904 |
|
4 |
17 |
0.917 |
0.917 |
|
5 |
21 |
0.9 |
0.976 |
|
6 |
87 |
0.944 |
0.977 |
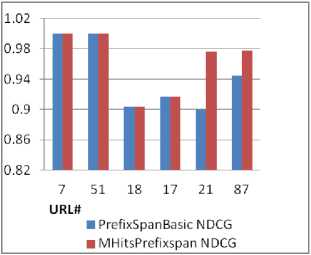
Fig. 2. NDCG comparison
Coefficient of variance for both the NDCG lists are evaluated and it is given below;
CV(PrefixSpanBasicNDCG) = 4.438
CV(MHitsPrefixSpanNDCG) = 3.956
Coefficient of variance for MHitsPrefixSpan is lesser than the PrefixSpanBasic, Hence the values generated using MHitsPrefixspan is consistent other than PrefixSpanBasic.
-
C. Ranking of Queries
The queries are ranked based on the user’s preferences on day wise, query wise and t-measure. For example, consider the user and his activities around 5 days. The queries Qi , 1 ≤ ≤ 6 are triggered by the user on Day j,
1 ≤ ≤5 .
Day 1 – Q1 , Q3 , Q4
Day 2 – Q1 , Q4 , Q5
Day 3 – Q1 , Q2 , Q3 , Q6
Day 4 – Q3 , Q4 , Q5
Day 5 – Q1 , Q2 , Q6
The queries Q1, Q3 and Q4 are issued on Day1. Table 6 depicts the support, confidence, preference and t-measure for the above day wise activities. The weight t-measure is assigned to day wise clusters. Since Q1 occurs on Day1, 2, 3 and 5, t-measure of Q1 is 1/15+2/15+3/15+5/15= 0.733.
Table 6. Preference and t-measure
|
Query |
Support |
Confidence (%) |
Preference |
t-measure |
|
Q1 |
4 |
80 |
0.525 |
0.733 |
|
Q2 |
2 |
40 |
0.263 |
0.533 |
|
Q3 |
3 |
60 |
0.394 |
0.533 |
|
Q4 |
3 |
60 |
0.394 |
0.466 |
|
Q5 |
2 |
40 |
0.263 |
0.4 |
|
Q6 |
2 |
40 |
0.263 |
0.533 |
The preference and the combined measure preference with t-measure is calculated using (4) and (5) respectively.
Preference ( u , q ) =&* Day Preference ( u q ) (4)
+ P* Query _ Preference ( u , q )
Preference with t - measure = a * preference ( u , q ) + в * t - measure ( q )
Table 7 shows the changes in the ranking order according to the value. For all the cases, irrespective of and the favourite query of the user is Q1. The queries Q2 and Q6 have equal weight and the query Q5 is less accessible. Table 7 shows the changes in the ranking order of 6 queries by using the ranking techniques preference, t-measure and preference with t-measure. Average ranking is assigned to the queries when they have the same measure. For example, the queries Q3 and Q4 has the same preference 0.394; hence the rank 2.5 is assigned for Q3 and Q4 instead of 2 and 3 respectively.
A better way to measure the dispersion is square the differences between each data and the mean before averaging them. Standard deviation shows how much variation is there from the mean. A low value indicates that the data points tend to be very close; whereas a higher value indicates that the data spread over a large range of values.
Table 7. Ranking order
|
Original |
Preference |
t-measure |
Preference + t-measure (when =0.5) |
|
1 |
1 |
1 |
1 |
|
2 |
5 |
3 |
4.5 |
|
3 |
2.5 |
3 |
2 |
|
4 |
2.5 |
5 |
3 |
|
5 |
5 |
6 |
6 |
|
6 |
5 |
3 |
4.5 |
The Coefficient of variance (CV) is calculated using
Standard Deviation
CV = * 100
Mean
CV for the different ranking order is
CV (Preference) = 45.175
CV (t-measure) = 45.922
CV (Preference + t-measure when =0.5) = 48.093
Table 8. Relevancy Score
|
Query : Cricket |
R1 |
R2 |
R3 |
R4 |
R5 |
R6 |
R7 |
CV |
|
User 1 |
0 |
2 |
2 |
2 |
1 |
-- |
-- |
57.143 |
|
User 2 |
1 |
2 |
2 |
1 |
1 |
1 |
0 |
55.902 |
|
User 3 |
0 |
2 |
1 |
1 |
-- |
-- |
-- |
70.711 |
|
User 4 |
0 |
2 |
1 |
-- |
-- |
-- |
-- |
81.650 |
|
User 5 |
2 |
2 |
2 |
1 |
1 |
-- |
-- |
30.619 |
|
User 6 |
2 |
2 |
1 |
1 |
0 |
0 |
-- |
81.650 |
|
User 7 |
0 |
2 |
2 |
1 |
1 |
-- |
-- |
62.361 |
|
User 8 |
0 |
2 |
2 |
2 |
-- |
-- |
-- |
57.735 |
|
User 9 |
1 |
2 |
1 |
1 |
1 |
-- |
-- |
33.333 |
|
User 10 |
1 |
2 |
2 |
1 |
-- |
-- |
-- |
33.333 |
|
CV |
111.575 |
0.000 |
30.619 |
34.015 |
44.721 |
100.000 |
DIV0 |
When preference only considered for ranking, the ranking order is consistent, it treats the items are same. When preference along with t-measure is considered for ranking, the ranking order is varied, it ranks the items are in different orders.
-
D. Evaluation of Relevancy Score in Recommended Queries
The proposed recommendations are evaluated by using an evaluation form. The users are asked to search in one query category. On the evaluation form, the users are asked to give the relevancy score for the recommended queries. For each recommended query, the user had to label it with a relevancy score {0, 1, 2} where • 0: irrelevant
-
• 1: partially relevant
-
• 2: relevant
Table 8 shows the relevancy score for the query ‘cricket’ and coefficient of variance for every user against their relevancy score. The number of recommended queries is varied and depends on the intent of the user. In Table 8, {R1, R2….R7} indicates the recommended queries. Here R1 is always the favourite query of the user. It may be irrelevant many times.
When the recommended queries R1…R7 are considered, Coefficient of variance for the second query R2 has the minimum value 0 because the query R2 contains the relevance score 2 for all the users. The recommended query R1 contains the maximum value 111.6 because the score assigned by the users are different. While the users User 1 … User 10 are considered, the User 5 assigns maximum number of same relevancy score for the recommended queries. Hence the CV for User 5 has the minimum value 30.619. User 4 and User 6 assign different relevancy scores for the queries, the CV for User 4 and User 5 is 81.65.
Next, there is a common measurement between the users are generated called kappa statistic, it is interesting to consider and measure how much agreement between the users on recommended queries.
p ( A ) - p ( E )
kappa = 7 ’ (7)
-
1 - p ( E )
Where P(A) is the proportion of the times the users agreed the recommended queries, and P(E) is the proportion of the times they would be expected to agree by chance. Here the relevancy score 1 and 2 are treated as same. Table 9 lists the Kappa statistic between the User 1 and other users User 2 … User 10.
The kappa value will be 1 if the two users are always agreeing the recommendations, 0 if they agree only at the rate given by chance, and negative if they are worse than random. From Table 9, the users User 3, User 4 and User 8 are agreed with User 1 on the relevancy score assigned to the recommendations. The other users User 2, User 5, User 6, User 7, User 9 and User 10 do not agree with User 1. In the same way, kappa value for all pairs of users is calculated. Next, the similar users are identified and clustered. For example, consider the users 1 and 2. The relevancy score value is 0, 1 and 2. Numbers of occurrences of all possible combinations of the scores are generated. The users 1 and 2 have five recommendations, both assigns the score 2 for the 2 recommendations R2 and R3. Table 10 shows that the relationship between the users 1 and 2 in terms of scores assigned to the recommended queries.
Table 9. Kappa statistics value
|
Users |
Kappa |
|
User 2 |
-0.111 |
|
User 3 |
1.000 |
|
User 4 |
1.000 |
|
User 5 |
-0.111 |
|
User 6 |
-0.250 |
|
User 7 |
-0.111 |
|
User 8 |
1.000 |
|
User 9 |
-0.111 |
|
User 10 |
-0.142 |
£ n Count ( i,i ) (8)
Similarity ( User 1, User 2 ) =----- i—0-------------
£ n = о£П = 0Count (ij where n is number of relevancy score. For example,
Similarity (User 1, User 2) =
(0+1+2) / (0+1+0+0+1+0+0+1+2) = 3 / 5 = 0.6
When the highest similarity 1 is considered as a threshold, the users (1, 8), (2, 10) and (3, 4) are clustered. That is the users 1 and 8 have assigned the same relevancy score.
Table 10. Relationship between User1 and 2
|
User 1 |
User 2 |
||||
|
Score |
0 |
1 |
2 |
X |
|
|
0 |
0 |
1 |
0 |
1 |
|
|
1 |
0 |
1 |
0 |
1 |
|
|
2 |
0 |
1 |
2 |
3 |
|
|
X |
0 |
3 |
2 |
5 |
|
Table 11 shows the similarity value between the users in terms of relevancy score. The users with highest similarity value are clustered, which is shown in Table 12.
Table 11. Similarity between the users
|
Users |
User 1 |
User 2 |
User 3 |
User 4 |
User 5 |
User 6 |
User 7 |
User 8 |
User 9 |
User 10 |
|
User 1 |
- |
|||||||||
|
User 2 |
0.6 |
- |
||||||||
|
User 3 |
0.5 |
0.5 |
- |
|||||||
|
User 4 |
0.67 |
0.33 |
1 |
- |
||||||
|
User 5 |
0.6 |
0.8 |
0.5 |
0.33 |
- |
|||||
|
User 6 |
0.2 |
0.33 |
0.75 |
0.67 |
0.6 |
- |
||||
|
User 7 |
0.8 |
0.8 |
0.75 |
0.67 |
0.8 |
0.4 |
- |
|||
|
User 8 |
1 |
0.5 |
0.5 |
0.67 |
0.5 |
0.25 |
0.75 |
- |
||
|
User 9 |
0.4 |
0.8 |
0.75 |
0.67 |
0.6 |
0.6 |
0.6 |
0.25 |
- |
|
|
User 10 |
0.5 |
1 |
0.5 |
0.33 |
0.75 |
0.5 |
0.75 |
0.5 |
0.75 |
- |
Table 12. Clustering of users
|
Users |
User 1,8 |
User 2,10 |
User 3,4 |
User 5 |
User 6 |
User 7 |
User 9 |
|
User 1,8 |
- |
||||||
|
User 2,10 |
0.6 |
- |
|||||
|
User 3,4 |
0.67 |
0.5 |
- |
||||
|
User 5 |
0.6 |
0.8 |
0.5 |
- |
|||
|
User 6 |
0.25 |
0.5 |
0.75 |
0.6 |
- |
||
|
User 7 |
0.8 |
0.8 |
0.75 |
0.8 |
0.4 |
- |
|
|
User 9 |
0.4 |
0.8 |
0.75 |
0.67 |
0.6 |
0.6 |
- |
-
IV. Conclusion
The proposed technique recommends and evaluates the queries in Web Information Retrieval. The order of the recommendations is also evaluated. The ranking order is evaluated by using NDCG and kappa statistics value. The measure coefficient of variance is used to find the variations between the ranking orders. The relevancy score assigned by the users to the recommended queries is evaluated using the kappa statistics. Users with similar relevancy score is identified and clustered.
References Evaluation of Reranked Recommended Queries in Web Information Retrieval using NDCG and CV
- B. Krishna, and A. Broder, "A technique for measuring the relative size and overlap of public web search engines,” Computer Networks and ISDN Systems 30.1, pp. 379-388, 1998.
- G. Antonio, and A. Signorini, "The indexable web is more than 11.5 billion pages,” Special interest tracks and posters of the 14th international conference on World Wide Web, ACM, 2005.
- M. Sanderson, "Ambiguous queries: test collections need more sense,” Proceedings of the 31st annual international ACM SIGIR conference on Research and development in information retrieval, ACM, 2008.
- C. Silverstein, H. Monika, H. Marais, and M. Moricz, “Analysis of a very large altavista query log,” Technical Report 1998-014, Systems Research Center, Compaq Computer Corporation.
- T. Hanghang, and C. Faloutsos, "Center-piece subgraphs: problem definition and fast solutions,” In Proceedings of the 12th ACM SIGKDD international conference on Knowledge discovery and data mining, pp. 404-413. 2006.
- B. Paolo, F. Bonchi, C. Castillo, D. Donato, A.Gionis, and Sebastiano Vigna, "The query-flow graph: model and applications,” In Proceedings of the 17th ACM conference on Information and knowledge management, pp. 609-618. ACM, 2008.
- B. Francesco, R. Perego, F. Silvestri, H.Vahabi, and Rossano Venturini, "Efficient query recommendations in the long tail via center-piece subgraphs,” In Proceedings of the 35th international ACM SIGIR conference on Research and development in information retrieval, pp. 345-354, 2012.
- Fonseca, M. Bruno, P. B. Golgher, E. Silva de Moura, and N. Ziviani, "Using association rules to discover search engines related queries,” In Web Congress, Proceedings. First Latin American, pp. 66-71, 2003.
- R. Baeza-Yates, C. Hurtado, and M. Mendoza, "Query recommendation using query logs in search engines,” In Current Trends in Database Technology-EDBT 2004 Workshops, pp. 588-596.
- C. Silviu, and Ryen W. White, "Query suggestion based on user landing pages,” In Proceedings of the 30th annual international ACM SIGIR conference on Research and development in information retrieval, pp. 875-876, 2007.
- Z. Zhiyong and O. Nasraoui, "Mining search engine query logs for query recommendation,” In Proceedings of the 15th international conference on World Wide Web, pp. 1039-1040, 2006.
- R. Jones, B. Rey, O. Madani, and W. Greiner, "Generating query substitutions,” In Proceedings of the 15th international conference on World Wide Web, pp. 387-396, 2006.
- N. Azimi, and S. Kiani , “Accelerating the Response of Query in Semantic Web,” I.J. Computer Network and Information Security, vol. 8, pp. 26-33, August 2014.
- V. Jain V, and M. Singh, “Ontology development and query retrieval using protege tool,” International Journal of Intelligent Systems and Applications, vol. 5. no. 9, pp. 67-75, September 2013.
- N. Dunhan and A.K.Sharma, “Rank Optimization and Query Recommendation in Search Engines using Web Log Mining Techniques”, Journal of Computing, Vol.2, Issue 12, 2010.
- Hang LI, “A Short Introduction to Learning to Rank”, Special Section on Information-Based Induction Sciences and Machine Learning, ieice trans. inf. & syst., vol.e94-d, no.10, 2011.
- Ravikumar, D. Pradeep, A.Tewari, and E. Yang, "On NDCG consistency of listwise ranking methods,” In International Conference on Artificial Intelligence and Statistics, pp. 618-626, 2011.
- R.Busa-Fekete, G. Szarvas, T. Elteto, and B. Kegl, "An apple-to-apple comparison of Learning-to-rank algorithms in terms of Normalized Discounted Cumulative Gain,” In 20th European Conference on Artificial Intelligence, 2012.
- Liu Tie-Yan, "Learning to rank for information retrieval,” Foundations and Trends in Information Retrieval 3, no. 3, 225-331, 2009.
- D. Allan, M. M. Shoukri, N. Klar, and E. Bartfay, "Testing the equality of two dependent kappa statistics,” Statistics in medicine 19, no. 3, 373-387, 2000.
- D. Manning Christopher, P. Raghavan, and H. Schutze, “Introduction to information retrieval”. Vol. 1, 2008.
- AOL data set from 2006 -03 - 01 to 2006 – 05 - 31 (zola. di. unipi. it / smalltext/datasets.html).
- R. Umagandhi, and A. V. Senthilkumar, “Search Query Recommendations using Hybrid User Profile with Query Logs,” International Journal of Computer Applications, Vol. 80 No.10, pp. 7-18, 2013.
- P. Jian, J. Han, B. Mortazavi-Asl, J. Wang, H. Pinto, Q. Chen, U. Dayal, and M. Hsu, "Mining sequential patterns by pattern-growth: The prefixspan approach,” Knowledge and Data Engineering, IEEE Transactions on 16, no. 11, 1424-1440, 2004.
- R. Umagandhi, and A.V. Senthilkumar, “Time Dependent Approach for Query and URL Recommendations Using Search Engine Query Logs,” IAENG International Journal of Computer Science. 40(3), 2013.
- M. I. Dan, R. Green, and P. Joseph, and Turian, "Precision and recall of machine translation,” In Proceedings of the 2003 Conference of the North American Chapter of the Association for Computational Linguistics on Human Language Technology, 2003.
