Evaluation of soil erosion risk using remote sensing and GIS data (a case study: Lang Chanh district, Thanh Hoa province, Vietnam)
")
Author: Trinh Le Hung, Vu Danh Tuyen, Do Nhu Hiep
Journal: Вестник аграрной науки @vestnikogau
Article in issue: 4 (55), 2015.
Free access
Erosion is one of the land degradation causes, having seriously effect on the living environment and manufacturing activities, especially in the upland and agricultural areas. Climate change and human activity are the main causes of soil erosion, which becomes increasingly serious. Remote sensing and GIS techniques which have advantages over traditional methods can be effectively applied for monitoring natural disaster and soil erosion. This paper presents result for soil erosion mapping in upland area of Thanh Hoa province (Lang Chanh district, Vietnam) using Landsat multispectral image and GIS. The result obtained in this study can be used to service monitoring and minimize the damage caused by soil erosion.
Land erosion, remote sensing, gis, multispectral image, landsat
Short address: https://sciup.org/147124251
IDR: 147124251 | UDC: 551.3.053
Text of the scientific article Evaluation of soil erosion risk using remote sensing and GIS data (a case study: Lang Chanh district, Thanh Hoa province, Vietnam)
Soil erosion is a natural process that occurs in all landforms. In recent years, due to the impact of climate change, soil erosion has seriously effect on the living environment and manufacturing activities. According to land use statistics, Vietnam has about 25 milion hectares of sloping land with soil erosion and runoff risk are very high (about 10 tons/ha/yeas). According to the systematic observation from 1960 to now, about 10 – 20% of the territory affected by soil erosion [9]. Every year, the hill and mountain areas of Vietnam lost a huge land mass, disrupt the soil surface, reduce soil fertility and direct influence on vegetation growth. Besides, depending on the characteristic of landform, eroded materials have been lost by erosion, may be then transported along the river, generate suspended solids and have affected the water and sediment quality [9]. To control and mitigate the risk of erosion, researchers in various countries have built multiple models, including qualitative and quantitative methods. Some methods as the Universal Soil Loss Equation (USLE), the revised Morgan – Morgan – Finney model (RMMF), E30…have been used for erosion calculating and predicting in many regions, which have different natural conditions in the world and received reliable results [1-5,11,12].
Remote sensing and Geographic Information Systems (GIS) with many advantages over traditional method has been effectively for monitoring and mapping soil erosion. In this study, we present results of application of remote sensing data and GIS for mapping soil erosion risk in Lang Chanh districh, Thanh Hoa province, Vietnam using Zhou model [1, 2].
STUDY AREA AND METHODOLOGY
Study area and materials. The Lang Chanh district (Fig. 1) is located in the Western of Thanh Hoa province in the North central coast region of Vietnam, about 200 km South of На Noi, the capital of Vietnam. The area is bounded by 2009’18’’N latitude and 105014’26’’E longitude. Lang Chanh is a mountainous district and is area at highest risk for landslides and soil erosion in Thanh Hoa province [10]. According to the “Reporting the survey results, flash flood risk assessment, landslides in mountainous areas in Vietnam” by Ministry of Natural resources and Environment, in this district have been 184 landslide points, including 38 big landslide points [10].
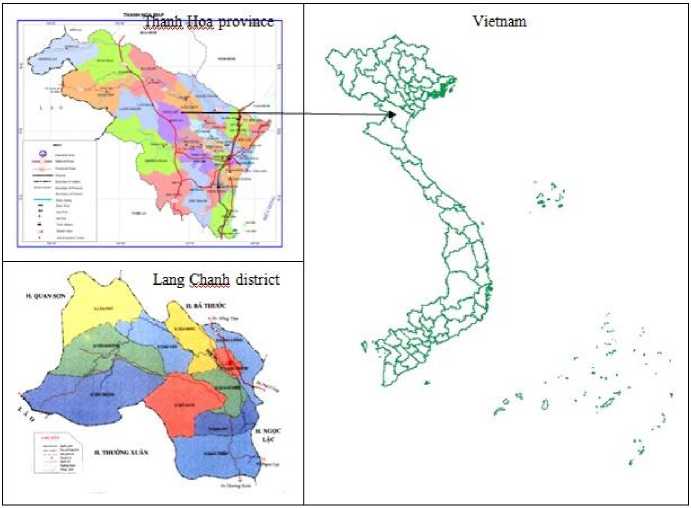
Figure 1 - The study area, Lang Chanh district, Thanh Hoa province (Vietnam)
In this study, multispectral cloud – free Landsat 5 TM data were collected (Figure 2). All the Landsat data was the standard terrain correction products (L1T), downloaded from United States Geological Survey (USGS – http://glovis.usgs.gov ) website. Landsat 5 Thematic Mapper (TM) images consist of seven spectral bands with a spatial resolution of 30 meters for band 1 to 5 and 7. Spatial resolution for thermal infrared band (band 6) is 120
meters, but is resampled to 30 meters pixels. In addition, this paper also used digital elevation model (DEM) with spatial resolution of 30 meters, which created from ASTER imagery (Figure 3).
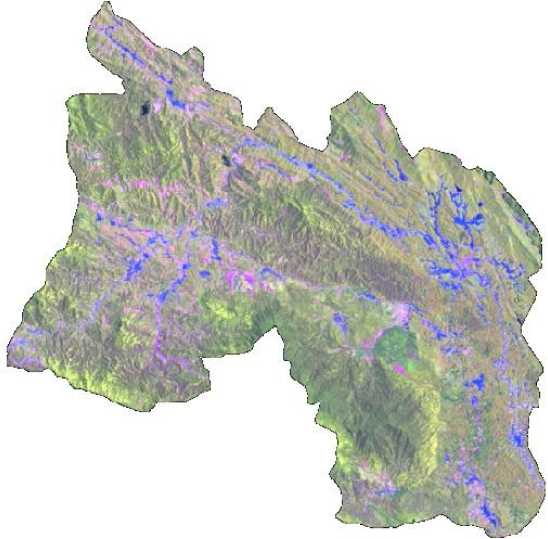
Figure 2 - Landsat 5 TM image 06 – 07 – 2011, composite RGB=543
0 m
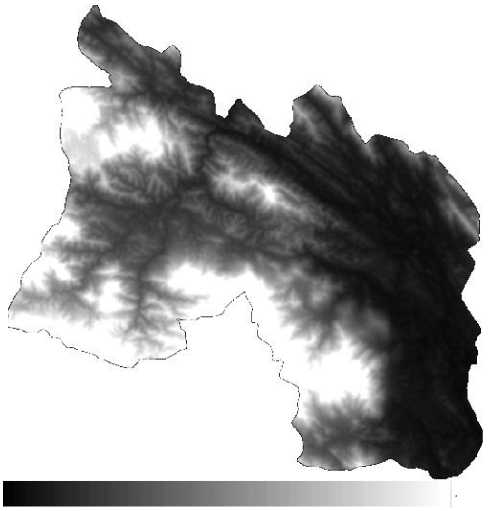
1259 m
Figure 3 - Digital elevation model (DEM) in study area
Methodology. Zhou et al (2004) created model for evaluting and estimating soil erosion based on vegetation cover and slope steepness factors. The slope ( in degree) is determined using digital elevation model (DEM), a vegetation fraction is calculated based on normalized difference vegetation index (NDVI) following equation:
VC
NDVI NDVI soil
NDVI veg + NDVsIo soil
Where: VC – vegetation fraction (%);
NDVI – Normalized difference vegetation index, which calculated by equation:
NDVI = р NIR __RED р NIR + р RED
NDVI soil – NDVI of bare land;
NDVI veg – the maximum NDVI of vegetation.
NDVI = р NIR __р- RED р NIR + р RED
To assess soil erosion probability, vegetation fraction and slope steepness are ranked with the criteria listing as table 1 and 2. Inside, the vegetation fraction was ranked to five grades (see table 1) and the slope steepness was ranked to six grades (see table 2) [1, 2].
Table 1 - The factor of vegetation ranking criteria
|
No. |
Vegetation ranking criteria (%) |
Coding |
|
1 |
< 30 |
1 |
|
2 |
30 – 45 |
2 |
|
3 |
45 – 60 |
3 |
|
4 |
60 – 70 |
4 |
|
5 |
> 70 |
5 |
Table 2 - The factor of slope steepness ranking criteria
|
No. |
Slope |
Coding |
|
1 |
00 – 50 |
1 |
|
2 |
50 – 80 |
2 |
|
3 |
80 – 150 |
3 |
|
4 |
150 – 250 |
4 |
|
5 |
250 – 350 |
5 |
|
6 |
> 350 |
6 |
Based on vegetation fraction and slope steepness, soil erosion risk was ranked to six grades: negligible, low, moderate, high, strong and severe (see table 3). The areas has slope angles from 00 to 50 or vegetation fraction greater than 70%, soil erosion risk were assessed negligible. While the areas have a highest risk of erosion if slope angles higher than 350 and vegetation fraction less than 30% [1, 2].
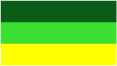
Negligible Low Moderate
High Strong Severe
Table 3 - Crosstab model
|
Slope |
00 – 50 |
50 – 80 |
80 – 150 |
150 – 250 |
250 – 350 |
> 350 |
|
|
Vegetation fraction (%) |
Coding |
1 |
2 |
3 |
4 |
5 |
6 |
|
30 |
1 |
11 |
21 |
31 |
41 |
51 |
61 |
|
30 – 45 |
2 |
12 |
22 |
32 |
42 |
52 |
62 |
|
45 – 60 |
3 |
13 |
23 |
33 |
43 |
53 |
63 |
|
60 – 70 |
4 |
14 |
24 |
34 |
44 |
54 |
64 |
|
> 70 |
5 |
15 |
25 |
35 |
45 |
55 |
65 1 |
The model of soil erosion risk assessment using Landsat TM imagery and GIS data is shown in figure 4 as follow.
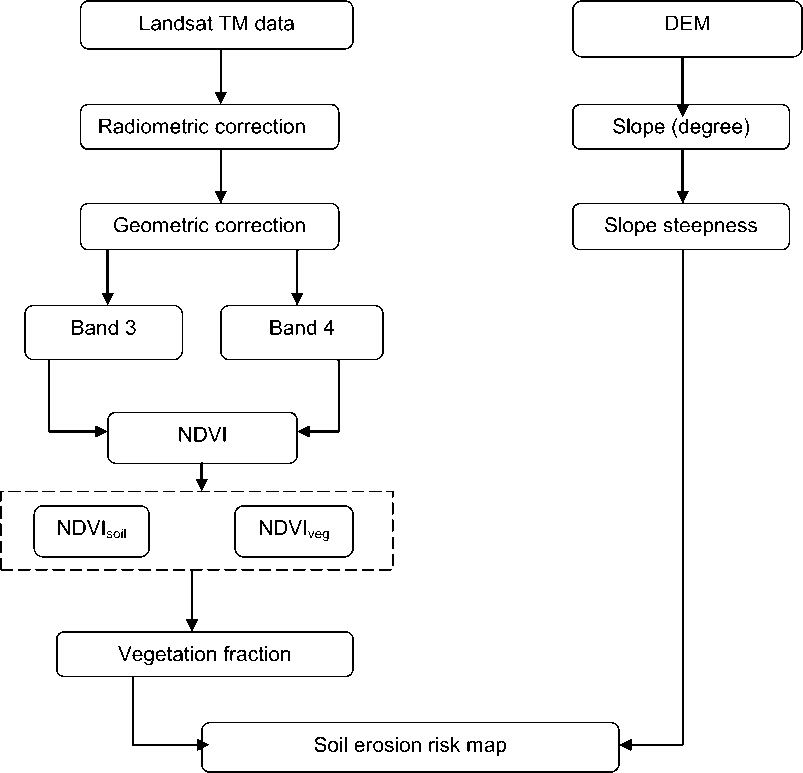
Figure 4 - The model of soil erosion risk assessment using remote sensing and GIS data RESULTS AND DISCUSSION
In the first step, image processing started with radiometric and geometric correction. Radiometric correction done by converted the digital number value to radiance value (spectral radiance, Wm-2µm-1). Based on NASA model, the digital values of thermal band Landsat 5 TM were converted to spectral radiance using following equation [8]:
L G .DN +
rescale . rescale (3)
Where
LX - spectral radiance at the sensor’s aperture
DN – the quantized calibrated pixel value in digital number
Table 4 - The values of G rescale and B rescale of LANDSAT TM image
|
Band |
Name |
Wavelength |
G rescale |
B rescale |
|
1 |
Blue |
0.45 – 0.515 µm |
0.671339 |
-1.52 |
|
2 |
Green |
0.525 – 0.605 µm |
1.322205 |
-2.84 |
|
3 |
Red |
0.63 – 0.69 µm |
1.043976 |
-1.17 |
|
4 |
NIR |
0.75 – 0.90 µm |
0.876024 |
-1.51 |
|
5 |
MIR |
1.55 – 1.75 µm |
0.120354 |
-0.37 |
|
7 |
MIR |
2.09 – 2.35 µm |
0.065551 |
-0.15 |
In the second step, for relatively clear Landsat scenes, reflectance (the TOA reflectance) can be determined from the spectral radiance data. The TOA reflectance is computed according to the equation:
71 . L , . d 2
Рх =
—---~---7777 (4)
ESUNX . cos( е ) ( )
Where:
ρ λ – planetary TOA reflectance
π – mathematical constant approximately equal to 3.14159
L λ – spectral radiance at the sensor’s aperture
D – Earth – Sun distance (astronomical units), which calculate following equation:
D – the day number of the year
θs – solar zenith angle (degree) [8].
The surface reflectance value can be calculated using atmospheric correction method DOS – “dark object subtraction”. The DOS is a family of image base atmospheric correction method proposed by Chavez (1988). The basic assumption is that within the image some pixels are in complete shadow and their radiances received at the satellite are due to mathospheric scattering (path radiance) [6, 7]. Simple DOS can be obtained with the below equation:
1 .( LX__ L path ). d
ESUN X . cos( е )
Where L λpath – the path radiance.
In the next step, normalized difference vegetation index (NDVI) were calculated using surface reflectance of red and NIR band, and slope were calculated from DEM data. Vegetation fraction and slope steepness maps are presented on the Figure 5 (a, b) below.
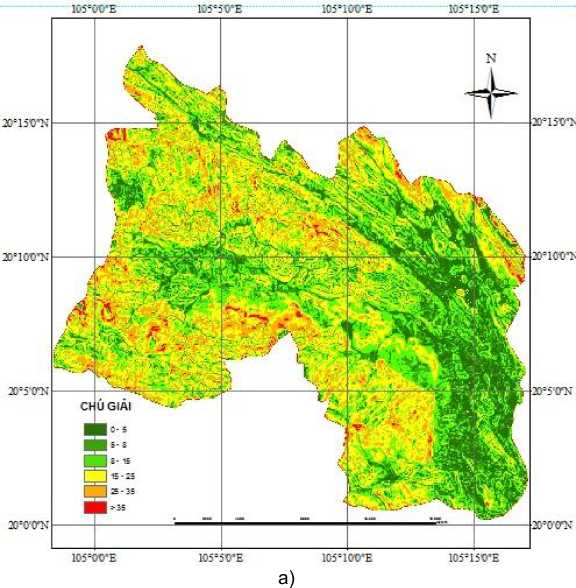
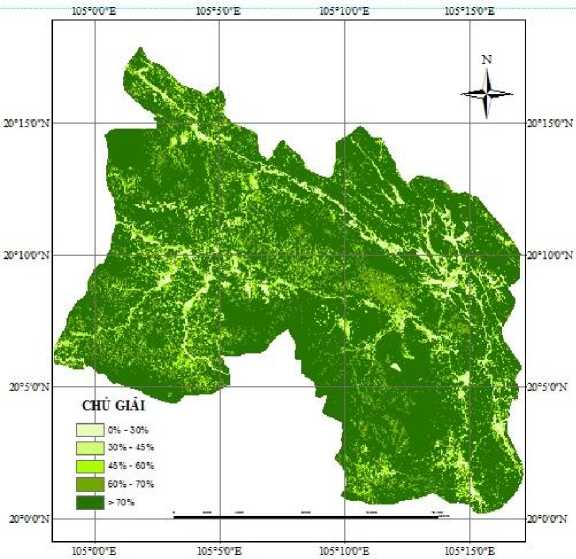
b)
Figure 5 - Slope (a) and vegetation criteria map (b) of Lang Chanh district (Thanh Hoa province)
Soil erosion risk map in Lang Chanh district, Thanh Hoa province (Vietnam) based on vegetation fraction and slope steepness factors using Zhou model is shown in Figure 4. The obtained results showed that large parts of the Lang Chanh district at negligible (77.92% of the total area) and low risk of soil erosion (6.03% of the total area). This can be explained by large area forest occupies of the Lang Chanh district. The areas at “moderate” to “very strong” risk of erosion occupy 16.05% of the total area of Lang Chanh district, which concentrated in area of steep slope and low vegetation cover (see table 4). The results also show the major role of vegetation factor to minimize the risk of soil erosion. The vegetation fraction map (Figure 5) is consistent with the soil erosion risk map (Figure 6).
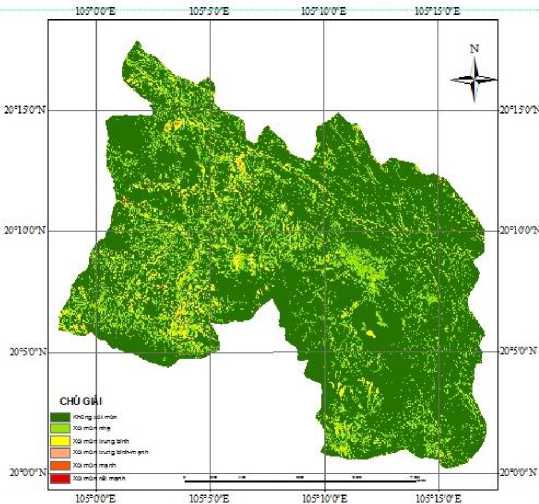
Figure 6 - Soil erosion risk map of the Lang Chanh district, Thanh Hoa province, Vietnam
Table 5 - Soil erosion rick in study area
|
STT |
Grade name |
Area (ha) |
Area (%) |
|
1 |
Negligible |
45709.96 |
77.92 |
|
2 |
Low |
3537.79 |
6.03 |
|
3 |
Moderate |
9148.64 |
15.60 |
|
4 |
Hight |
213.45 |
0.36 |
|
5 |
Strong |
45.10 |
0.08 |
|
6 |
Severe |
4.05 |
0.01 |
CONCLUSIONS
Soil erosion is one of the important reasons causing land degradation in Vietnam and has seriously effect on the living environment and manufacturing activities, especially in the upland and agricultural production areas. Forest decline and influence of terrain factors are the main causes of soil erosion, which becomes increasingly serious in recent year.
Model of soil erosion risk assessment (Zhou et al, 2004) based on vegetation cover and slope steepness factors using remote sensing and GIS data has been effectively for monitoring and mapping soil erosion. The obtained results in this paper can be used to service management, protect and improve the quality of land resources.
References Evaluation of soil erosion risk using remote sensing and GIS data (a case study: Lang Chanh district, Thanh Hoa province, Vietnam)
- Zhou Z.C., Shangguan Z.P. (2004), Overview on soil erosion model research, Sciene soil water conserv 2, 52 -56.
- Zhou P., Luukkanen O., Tokola T., Nieminen J. (2008), Effect of vegetation cover on soil erosion in a mountainous watershed, CATENA, Vol. 75, Issue 3, 319 -325.
- Yuksel A., Gundogan R., Akay A.E. (2008), Using remote sensing and GIS technology for erosion risk mapping of Kartalkaya Dam watershed in Kahramanmaras, Turkey, Sensors, 8, pp. 4851 -4865.
- Wischmeier W.H., Smith D.D. (1978), Predicting rainfall erosion losses -A guide to conservation planning, Agriculture Handbook No. 537, 163 pp.
- Nazarena Rojas (2013), An overview of the geospatial methodologies used in order to assess the soil erosion risk by water, Aplicaciones espaciales de Alerta y Respuesta a Emergencias, 41 pp.
- Chavez P.S. (1996), Image-based atmospheric corrections-revisited and improved, Photogrammetric Engineering and Remote Sensing 62(9): pp.1025-1036.
- Chavez P.S. (1988), An improved dark-object subtraction technique for atmospheric scattering correction of multispectral data, Remote Sensing of Environment 24: pp.459-479.
- National Aeronautics and Space Administration (NASA), LANDSAT Science data user’s Handbook.
- Trinh Le Hung (2015), Application of remote sensing and GIS in mapping soil erosion risk in the mining area using E30 model, Mining industry journal, Vol. 01, 44 -47.
- Vu Minh Tuan, Trinh Le Hung (2013), Application of GIS and remote sensing studies relationship between vegetation and soil erosion in Di Linh district, Lam Dong province, Journal of Sciences, Hue University, Vol. 87(09), 213 -224.
- http://ccfsc.gov.vn.
- http://www.monre.gov.vn
