Groundwater Arsenic and Health Risk Prediction Model using Machine Learning for T.M Khan Sindh, Pakistan

Author: Sobia Iftikhar, Sania Bhatti, Mohsin A. Memon, Zulfiqar A. Bhatti
Journal: International Journal of Information Technology and Computer Science @ijitcs
Article in issue: 2 Vol. 12, 2020.
Free access
Arsenic is a natural element of the earth’s crust and is commonly distributed all over the environment in the air, water and land. It is extremely poisonous in its inorganic form. Arsenic (As) contamination is one of the leading issues in the south Asian countries, ground water is major sources of drinking water. The highest risk to public health from arsenic originates from polluted groundwater. Arsenic is naturally present at high levels in the groundwater of south Asian countries. Pakistan also one of them which is highly affected by this toxic element, especially rural areas of Sindh Pakistan, where Ground water is the only source of drinking. Due to climates changes day by day value of arsenic is increased in Ground water, that effects the human health in form of many diseases like skin cancer, blood cancer. The purpose of this study is to figure out the increasing level of Arsenic and Cancer rate in Tando Muhamad Khan Sindh Pakistan for next coming five years. For this we have developed model using Microsoft Azure Machine learning Techniques and algorithms including Bayesian Linear Regression (BLR), support vector machine (SVM), Linear Regression (LR), Boosted Decision tree (BDT), exponential smoothing ETS, Autoregressive Integrated Moving Average (ARIMA). Developed model will help us to forecast the increasing rate of Arsenic and its effects on human health in form of cancer.
Arsenic, Machine learning, Cancer rate, Ground water, ETS, Arima
Short address: https://sciup.org/15017444
IDR: 15017444 | DOI: 10.5815/ijitcs.2020.02.03
Text of the scientific article Groundwater Arsenic and Health Risk Prediction Model using Machine Learning for T.M Khan Sindh, Pakistan
Published Online April 2020 in MECS
Ground water is one of the basic resources of drinking in Pakistan. There are many chemical factors found in ground water, like As, Fl, Zn and so on. If the quantity of those factors multiplied, then it will purpose many other sicknesses in human frame. Arsenic is one of the poisonous elements stated in groundwater from over 70 nations, that is causing health hazards to about one hundred fifty million human beings worldwide. [1]. Asia being the most importantly affected vicinity for arsenic contamination around the arena. Groundwater contamination with Arsenic has become an important difficulty in Sindh Pakistan. In specific, its miles regarded as a public health difficulty. Its presence in the earth’s crust and Illness function of long-time period arsenic publicity comes inside the form of skin most cancers [2]. The growing degree of arsenic in ground water is due to the suspension of Arsenic compounds coming from the Himalayas river Indus RI and settled down for the duration of the years after which brought into ground water by means of geothermal, hydrological and biochemical factors. Pakistan stood at wide variety 80 among 122 nations concerning contaminated water exceptional [3].
Objective of this study to predict the raised level of arsenic in coming years of Tando Muhammad Khan Sindh Pakistan and with what amount level of cancer rate will be increased due to arsenic in human body. In Pakistan rural areas of Sindh, people are affected by different chemical in drinking water, and its exposure comes in the form of skin cancer blood cancer, hair scalp cancer. For solution of this problem, we rapidly need to identify the increasing rate of arsenic by using different forecasting techniques, then we can estimate the future situation. So, we developed a model using Microsoft Azure machine learning studio [13] with different algorithms and methods including support vector machine, Linear Regression, Boosted Decision tree, Linear Regression, Boosted Decision tree, exponential smoothing ETS, Autoregressive Integrated Moving Average ARIMA [14]. In order to achieve this objective, one of the major limitations is to deal with unstructured historical data. ETS and Arima both forecasting must be used for unstructed data. This Predictive model will be developed for Tando Muhammad Khan Sindh province to forecast the arsenic contamination and predict the cancer rate for the next five years.
-
II. Literature Review
Arsenic contamination of soil and drinking water has attracted serious attention in environmental studies [1,4,15]. Arsenic in drinking water has a harmful effect on human health which intensely impairs the value of life. In 2013 Bhatti et al. [2] collected 214 ground water samples from twenty-four districts of Sindh Pakistan and examined for arsenic concentration. The results showed that 45% samples had arsenic overhead 10 μg L -1 . According to Waqar Ali et al. [4] the regular intake of Arsenic polluted drinking water causes critical and chronic health issues. Arsenic pollution in drinking water has been testified as a hazard to human health in various countries such as Pakistan, India, Bangladesh, and China.Yongeun Park et al. [5] analyzed 350 water samples from three distinct SEA countries, like Cambodia, Lao PDR, and Thailand and used two different machine learning algorithms (i.e. artificial neural network (ANN) and SVM) to forecast groundwater Arsenic contamination. Wali Muhammad Daudpota et al. [11] discussed the groundwater situation in Tando Muhammad Khan district, that clarify the arsenic hardness in 21.88 % samples were crossed the WHO’s allowable limits for human drinking. Sanjrani MA et al. [12] recently pronounced that greater than 50 million humans in Pakistan have been at a threat of arsenic poisoning because maximum of Pakistani communities use groundwater for drinking and other families polluted with arsenic. Previously some researchers have applied the artificial intelligence techniques [5] for just the analysis of water samples. This study contributes by analysis of water samples then by applying forecasting methods for finding the increasing levels of arsenic for the coming years.
A. Dataset collection
For this study we have collected dataset from studies [2, 6, 7]. Adnan Khan et al. [6] collected 24 samples from Tando Ghulam and identified the arsenic level which is 3 times greater than WHO limit. They collected ground water samples from three different Union Councils of Tando Muhammad Khan Sindh Pakistan. They revealed arsenic contamination in drinking water has a detrimental impact on human health which profoundly impairs the quality of life.
Statistical data collection: Many actual-world datasets may additionally contain missing values. One way to deal with this trouble is to do away with the observations which have lacking facts. However, there is chance of dropping statistics factors with precious information. A better approach would be to impute the lacking values. In different phrases, we need to infer the ones lacking values from the present part of the statistics. From the past data review, we gather data for the years 2013, 2015, 2017, and for 2014, 2016 years we have missing data points. For this purpose, we used statistical calculation like mean/median for absent values in a column by the following equation (1) and (2).
V 2014 _ 22013+52015 л —---------
2016 52015+52017
equation (1) are used to obtain mean value for 2014 and equation (2) are used to obtain mean value for 2016. These both equations are performed statistical calculation in which they used first and last value in order to obtain middle value. and then swapping the missing values within each column discretely and individualistically from the others. It is useful for only with numeric data presented in Table1.
Table 1. Data used in predictive model
|
Data Used |
Availability |
|
Last five years of Arsenic |
Data Collected from Previous studies |
|
Last five-years of cancer rate |
Data collected from previous study where they calculate cancer rate by using chemical equation CR — RD! x CSR (3) Where CR = Cancer Risk EDI = estimated daily intake (μg/kg-day) CSF = Cancer Slope Factor (μg/kg-day) |
|
Arsenic Forecasting model |
|
|
For the next five-years Arsenic |
Forecasted Arsenic obtained by using previous Arsenic and applying forecasting techniques ETS and ARIMA |
|
Cancer Prediction Model |
|
|
For the next 5-years Cancer |
We used forecasted Arsenic and calculate cancer rate by manually using equation (3) |
-
III. Methodology
Workflow of this study shown in fig.1. First, we gathered the raw data from previous studies of targeted location “Tando Muhammad Khan”.
We organized this raw data into dataset file in a particular format i.e. comma-separated values (CSV) which is supported to machine learning platform. For this we use Microsoft azure platform and its services like machine learning with forecasting methods and algorithms. Basically, we divide our data for two different models one for arsenic forecasting and second for cancer prediction. Initially we forecast arsenic for the next five year with ETS and ARIMA techniques. And then used these forecasted results for cancer prediction with cancer prediction model using R-language. Further we extend cancer model into trained model that provide new predicted value by taking arsenic as input.
( !
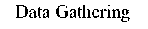
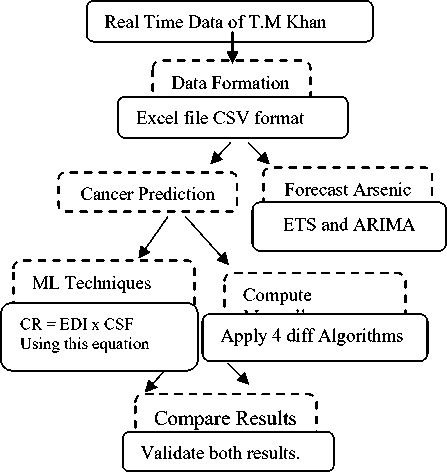
Fig.1. Methodology
-
IV. Implementation
We developed two models for the arsenic and cancer prediction. First model developed for arsenic forecasting (Arsenic predictive model) and second model for Cancer rate (Cancer prediction model) by using Microsoft azure machine studio. Microsoft azure gives an intelligent environment to build logical model and convey predictive analytics outcomes. It’s just not transformed the logical model into predictive models as well as gives aa trained model to easily do analysis. We therefore use “Microsoft Azure Machine Learning Studio” to develop such predictive models.
Fig 2. shows the arsenic model which contains fourteen number of samples of different areas of Tando Muhammad Khan and used as a dataset. “select column dataset” module is the feature of machine learning studio. Then choose Year and Arsenic both as a primary column from loaded datasets, observe special forecasting strategies exponential smoothing ETS, Autoregressive Integrated Moving Average ARIMA. R-script is used for creating an average of forecast factors and convert this result into visualization form with the assist of graph.
R-scripting: Using R code customized metrics are evaluated during predictions, and models are constructed by the usage of algorithms that aren't applied as standalone modules in Studio.
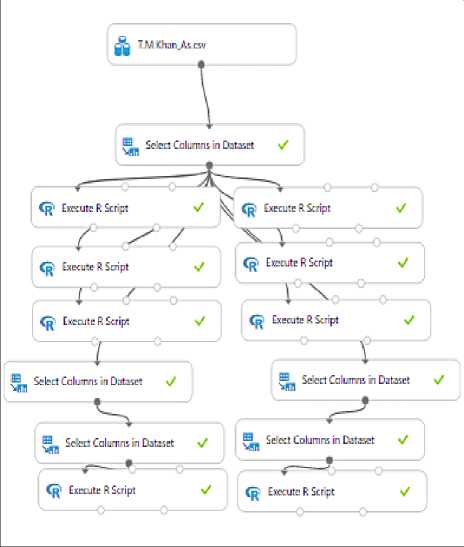
Fig.2. Arsenic Predictive model
In figure 3 we write-up R-script for implementing the ETS method. Here we used different libraries for different purpose, including Forecast library for ETS, Zoo library for timeseries with ts () function and Ggplot2 library for Graphical Expression, The seasonal algorithm (ETS AAA) models the time sequence using a comparison that accounts for additive error , trend , and seasonality. It suppresses noise, or undesirable variation that can change the model, while proficiently catching trends. Model=”AAA” shows Seasonal data (ETS AAA), and one for non-seasonal data (ETS AAN).
R Scrip:
-
1 # Map 1-based optional input ports to variables
-
3 library(forecast)
-
4 library(zoo)
-
5 library(ggplot2)
-
6 tsdata <- ts(datasetl[J2]Jfrequency=12,start=c(2013)Jend=c(2017))
-
7 forcastets <- ets (tsdata., model=’'AAA")
-
8 forcastvalue <- forecast(forcastets,h=60)
-
9 plot(forcastvalue,ylim=c(l,100))
-
10 autoplot(forcastvalue,ylim=c(ljl00))
-
11 # Select data.frame to be sent to the output Dataset port
-
12 ts <-data.frame(forcastvalue)
-
13 maml.mapOutputPort("ts”);
-
Fig.3. R-script with ETS
In figure 4 we write-up R-script code for implementing the ARIMA method, using auto. Arima ()
Fig.5. This predictive model identifies the cancer rate with respect to arsenic predictive model depicted in fig 2. Apply “select column dataset” module then select a Year, arsenic and cancer-value three main columns from loaded datasets. Then we used “Split module” for partitioning data into training and testing with different percentages. Deployment of this model is shown in fig.5 with Bayesian linear Regression, Boosted Decision tree, Linear Regression, Support Vector Machine algorithms.
RScript
-
1 # Map 1-based optional input ports to variables
-
2 datasetl <- maml.mapinputPort(l) # class: data.frame
-
3 library(forecast)
-
4 library(zoo)
-
5 library(ggplot2)
| 6 tsdata <- ts(datasetl[,2],frequency=12,start=c(2013),end=c(2017))
-
7 plot(tsdata)
-
8 arima <- auto.arima(tsdata,D=l)
| 9 forcastvalue <- forecast(arima,h=60)
10 plot(forcastvalueJyliin=c(l,200),col="red";,type="r)
-
11 ts <-data.frame(forcastvalue)
-
12 maml.mapOutputPort("ts”);
Fig.4. R-script with ARIMA
Fig.5. Cancer prediction model
After deployment of these four algorithms, the best one algorithm that gives highest accuracy is identified. Fig.6 shows trained model, web services are used for making this model into predictable model that predict next value of cancer with new arsenic values.
-
A. Forecasting Methods
Exponential smoothing ETS and Autoregressive Integrated Moving Average ARIMA, both are the forecasting algorithms. Forecasts produced using exponential smoothing and ARIMA strategies are weighted averages of past observations. They both performed time series forecasting. And purpose of using these techniques is to forecast the arsenic value for the next five years on the basis of previous dataset, which is taken from past studies mentioned in dataset section.
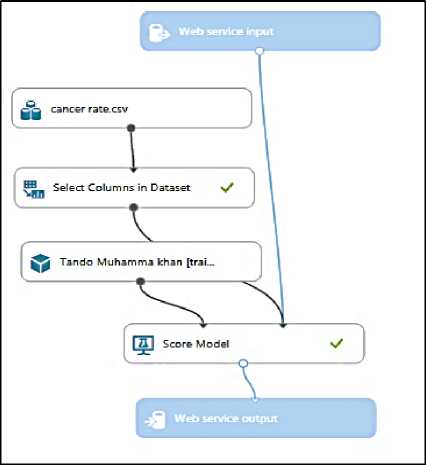
Fig.6. Trained model
-
V. Result and Discussion
Past arsenic data of District Tando Muhammad Khan is used as a dataset. District Tando Muhammad Khan is connected with left area of Indus bank river. In this research exponential smoothing ETS, Autoregressive Integrated Moving Average ARIMA both techniques are used for arsenic forecasting. And Bayesian linear Regression, Boosted Decision tree, Linear Regression, Support Vector Machine algorithms are used to predict the cancer rate. R-language used for the average of forecast point and visualization of results.
-
A. Arsenic Result Analysis
In Table 2 shows arsenic forecast point with column named “F-year”, “F-AS” after deploying model shown in figure 2. F-As is average rate of all forecast point by using ETS and Arima method, also generates seasonality using Arima and ETS with column named F-year.
Table 2. Point of Forecast (F-As)
|
District |
P-year |
P-As |
F-year |
F-AS |
|
T.M Khan |
2013 |
15.28 |
2018 |
85.71 |
|
T.M Khan |
2014 |
36.64 |
2019 |
99.69 |
|
T.M Khan |
2015 |
58 |
2020 |
122.89 |
|
T.M Khan |
2016 |
69.35 |
2021 |
132.03 |
|
T.M Khan |
2017 |
79.28 |
2022 |
144.87 |
Fig 7 and fig.8 shows both arsenic forecasting with respect to ETS and ARIMA respectively, ETS forecasting gives us proper drifting as compared to Arima that shows flat drifting. According to results ETS provide very clear forecasting.
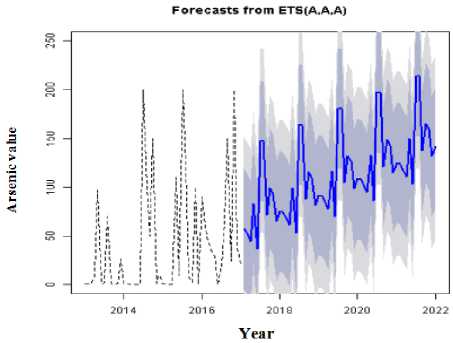
Fig.7. Trending View of predictive arsenic using ETS
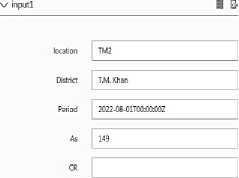
First forecasted arsenic value is used as input to predict the cancer rate for 2018 by Test Response.
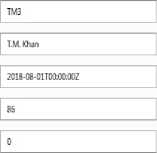
Test Request-Response
outputl
location
District
Period
Scored Label Mean
Scored Label Standard Deviation
T.M. Khan
8/1/201812:0050 AM
2029.82725468009
623.403418203387
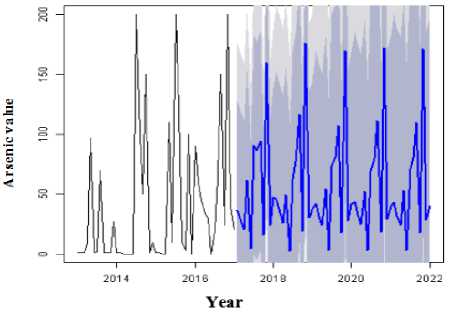
Fig.8. Trending View of predictive arsenic using ARIMA
Fig.9. Test Response for 2018
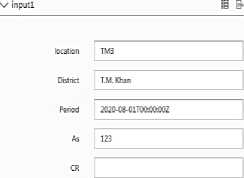
Second forecasted arsenic value is used as input to predict the cancer rate for 2019 by test response.
B. Cancer Result Analysis
For cancer prediction we need to identify cancer first manually by using equation (3), with ten years of arsenic (first five year’s arsenic values are collected from dataset and next five years’ arsenic is forecasted from model 1 shown in fig 2. Secondly prediction of the cancer is performed using “Trained model” revealed in fig.6.
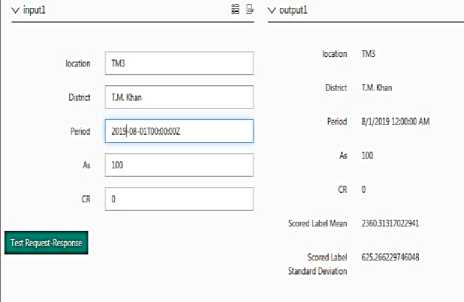
Fig.10. Test Response for 2019
Third forecasted arsenic value is used as input to predict the cancer rate for 2020 by Test Response.
Manually calculated cancer rate: Basically, the cancer rate is calculated from this paper [2]. They used the equation (3) to identify the cancer rate by using arsenic for one year. In this study we forecast five years arsenic values from arsenic predictive model and used as an input parameter to equation (3) and computed manually cancer rate. After manually computation we used forecast arsenic value to predict the cancer rate from Model shown in fig.5 named as cancer predictive model.
Now convert this model into “Trained model” using web services fig.6. After deploying this trained model web services allow to take input and gives new prediction values, same as in they provide Test response environment where we used five years forecasted arsenic as an input value for predicting the next five year’s cancer. Figure 9, 10, 11, 12 and 13 depict the test responses for the year 2018, 2019, 2020, 2021 and 2022 respectively.
Request-Response Batch
outputl
Test Request-Response
location
Scored Label Mean
Scored Label
Standard Deviation
Fig.11. Test Response for 2020
T.M. Khan
8/1/2020 120600 AM
631.077517636944
Fourth forecasted arsenic value is used as input to predict the cancer rate for 2021 by test response.
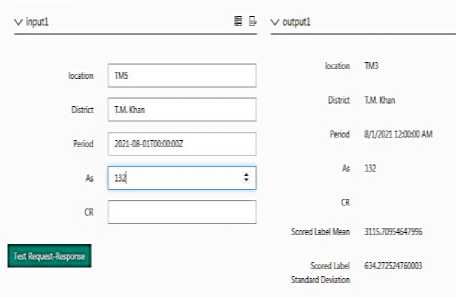
Fig.12. Test Response for 2021
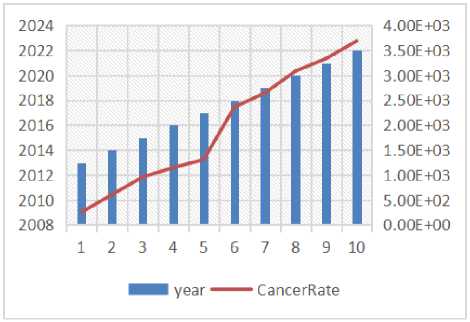
Fig.14. Increasing cancer rate with respect to year
Fifth forecasted arsenic value used is as input to predict the cancer rate for 2022 by Test Response.
Request-Response Batch
output!
Test Request-Response
location
District
Period
Scored Label Mean
Scored Label
Standard Deviation
Fig.13. Test Response for 2022
TM Khan
3/1/202212:00:00 AM
765.352856631204
VI. Comparison of Algorithms
In table 4, for cancer prediction we divide dataset into two parts training and testing. 70% of the data are used to train the cancer predictive models and remaining 30% of the test dataset are used to validate Trained model for next five year’s prediction. We used three regression models, and one binary classification models BLR, BDT, LR, SVM to predict cancer. All these algorithms performed under the same training and testing ratio (70%,30% respectively) with the same length of dataset. “Bayesian Linear Regression” provide greatest accuracy for the trained model.
Table 3. Manual and predicted cancer rate
|
Year |
Manually |
Prediction |
Accuracy |
|
2013 |
252.59 |
- |
|
|
2014 |
605.52 |
- |
|
|
2015 |
958.44 |
- |
|
|
2016 |
1146.12 |
- |
|
|
2017 |
1310.20 |
- |
|
|
2018 |
2360.71 |
2029.72 |
85.97% |
|
2019 |
2645.81 |
2360.26 |
89.20% |
|
2020 |
3084.82 |
2903.25 |
94.11% |
|
2021 |
3336.58 |
3115.7 |
93.38% |
|
2022 |
3689.99 |
3517.32 |
95.32% |
In table 3 shows the accuracy of proposed model, we predicted next five years’ cancer rate by using cancer predictive Trained model in fig.6, first column labeled as “Manually” shows the results of manual calculation obtained by using equation 3. Second column labeled as “Prediction” shows the results of proposed model, produced result from model which is very near to manual results as you can see third column labeled as “Accuracy”. That’s shows the accuracy of proposed model.
Fig.14 is the result of trained model that predict the cancer rate and shows increasing trend of cancer with respect to time due to growing value of arsenic in drinking water.
Table 4. Accuracy comparison of algorithms
|
No |
Algorithms |
Accuracy |
|
1 |
Bayesian Linear Regression |
0.91 |
|
2 |
Boosted Decision tree |
0.80 |
|
3 |
Linear Regression |
0.75 |
|
4 |
support vector machine |
0.73 |
-
VII. Conclusion
Previous studies describe clearly that arsenic contamination is one of the serious matters around the world. Pakistan is also highly affected from them. From the literature review it has been observed that this is the first attempt of using Azure for the analysis of arsenic in water and its forecasting using ETS and ARIMA methods.
For this study, Tando Muhammad Khan district of Sindh province is selected and the As contamination for the next five years and its after effects on the human health in the form of cancer rate are predicted. In this study As rate is found via As predictive model and cancer rate is found by deploying cancer predictive model and four machine learning algorithms. From the results it is evident that due to increasing trend of As from 2018 to 2022 the cancer rate is also depicting growing trends.
-
VIII. Future Work
In this study we focused on identification of the increasing level of arsenic in ground water in Tando Muhammad Khan Sindh Pakistan, that effects human health in form of cancer disease which is an alarming situation. One of the future directions is to divide dataset according to weather means to predict cancer rate and arsenic in summer and winter season.
Acknowledgement
This research idea has been accepted by Microsoft, for the Earth Grant. In this research Microsoft azure service area are used to develop a prediction model with Machine Learning Techniques and methods for Arsenic contamination in Pakistan.
References Groundwater Arsenic and Health Risk Prediction Model using Machine Learning for T.M Khan Sindh, Pakistan
- H. Brammer, P. Ravenscroft, “Arsenic in groundwater: a threat to sustainable agriculture in South and South-east Asia”, Environ. International 2009 “doi:647–654”.
- Z.A Bhatti., Qureshi, K.,Bhatti, I., Unar, I. N., & Khuhawar, M. Y, “Determination of Arsenic and Health Risk Assessment in the Ground Water of Sindh, Pakistan”. Mehran University Research Journal of Engineering and Technology, 2017, “doi: 10.22581/muet1982.1704.28”.
- A.H Kori, Mushtaque Ali Jakhrani Sarfaraz Ahmed Mahesar Muhammad Saqaf Jagirani, “Risk assessment of arsenic in ground water of Larkana city”. 2018, “doi:10.1080/24749508.2018.1438742”.
- W.A. Atta Rasool. Muhammad Junaid. Hua Zhang, “A comprehensive review on current status, mechanism, and possible sources of arsenic contamination in groundwater: a global perspective with prominence of Pakistan scenario Environ Geochem Health”. 2018, “doi:10.1007/s10653-018-0169”.
- Park, Y., Ligaray, M., Kim, Y. M., Kim, J. H., Cho, K. H., & Sthiannopkao, “Development of enhanced groundwater arsenic prediction model using machine learning approaches in Southeast Asian countries”, Desalination and Water Treatment, 2016, “doi: 10.1080/19443994.2015.1049411”.
- A. Khan, Viqar Husain, Gulraiz Hamid and Sohail Anjum, “Arsenic contamination status in the Holocene alluvial aquifers of Indus Deltaic Flood Plain: a case study of Tando Ghulam Hyder Taluka, Sindh, Pakistan”, Int. j. econ. environ. geol. Vol:5(2) 1-10, 2014.
- A. Khan1*, Viqar Husain1, Asal E. Bakhtiari1, Hamza Khan1 & Muhammad Arsalan1,”Arsenic Contamination in Semi-Urban Areas of Tando Muhammad Khan District: A Case Study from Deltaic Flood Plain of Sindh, Pakistan” Sustainability in Environment ISSN 2470-637X (Print) ISSN 2470-6388 , 2017, “doi: 10.22158/se.v2n2p171”.
- S.A Majidano , G.M Arain , D.R. Bajaj , P.iqbal and M.Y khuhwar, ”Assessment of Ground water quality with focus on Arsenic contents and consequences. Case study of Tando Allahyar District in Sindh Province”, International Journal of Chemical and Environmental Engineering Volume 1, No. 2, 2010.
- A.A Uqaili, A. H. Mughal and B. K. Maheshwari, “Arsenic Contamination in Ground Water Sources of District Matiari, Sindh”, International Journal of Chemical and Environmental Engineering Volume 3, No. 4-2012, “doi: 10.1289/ehp.9268”.
- W.M Daudpota, Noor-Un-Nisa Memon And Tanveer Fatima Miano, “Determination Of Ground Water Quality For Agriculture And Drinking Purpose In Sindh”, Pakistan.. Issn 1013-5316, 2016.
- Sanjrani MA, Mek T, Sanjrani ND, Leghari SJ, Moryani HT, et al, ”Current Situation of Aqueous Arsenic Contamination in Pakistan, Focused on Sindh and Punjab Province, Pakistan”, A Review. J Pollut Eff Cont 5: 207, 2017, “doi: 10.4176/2375-4397.1000207”.
- Microsoft Azure Machine Learning Studio [Google] Retrieved from https://studio.azureml.net/.
- https://machinelearningmastery.com/arima-for-time-series-forecasting-with-python/.
- S. Naseem, John M McArthur, “Arsenic and other water‐quality issues affecting groundwater, Indus Alluvial Plain”,Pakistan in Hydrological Processes, 2018, “doi: 10.1002/hyp.11489 “.
- S.A Sheikh, Asia Akbar Panhwar,Mahwish abeen Channa, Determination Of Ground Water Quality For Agriculture And Drinking Purpose In Sindh, Pakistan,2014,”doi: 10.6000/1927-5951.2014.04.02.2”.
