Implementation of infographics in master students' professional education

Author: Kuzmina N.N., Elsakova R.Z., Kochkina D.V.
Section: Непрерывное образование в течение жизни. Образование разных уровней
Article in issue: 1 т.17, 2025.
Free access
In an interactive and visually appealing world, the field of education strives to create visually attractive textbooks and online courses for university students. This is particularly relevant for master's students, as, unlike bachelor's students, they need to have developed analytical skills for research and management activities. Based on the reviewed literature, a lack of a systematic approach to the study of the concept of “infographics” was identified, as well as an insufficient development of models for the application of infographics in the professional education of master's students. Through the study of practical experience, a demand from educators for methodological materials that incorporate infographics was revealed. As a result, there emerges a need to clarify the concept and systematize the types of infographics, as well as models for their implementation in the educational process for preparing master's students. The aim of the research is to identify the possibilities of infographics as a means of visualization in the professional education of master's students. The following tasks were set and resolved: the concept of “infographics” was clarified; the awareness of master's students regarding the types of infographics in education was assessed; the effectiveness of different types of infographics in teaching master's students was analyzed; the perspectives of educators on the use of types of infographics were studied; and various types of infographics were implemented in the teaching process for master's students. The theoretical results of the research include the study of approaches to the concept of “infographics”, the ordering of types of infographics, and the possibilities of their application in the educational process. The empirical research was conducted at South Ural State University. Methods used included the integrative literature review, surveys, interviews, and Cronbach's alpha method. The study involved 33 master's students and 26 educators. The empirical research showed that most master's students are aware of some types of infographics but do not know about their applicability in the educational process. Educators are familiar with the main types of “infographics”, but are not acquainted with the classification of “infographics”, thus, applying limited amount of types. The implementation of various types of infographics in the professional education of master's students demonstrated an increase in interest and students’ motivation, as well as simplifying and making the process of information perception engaging. The results may be useful for educators in teaching master's students using infographics.
Infographics, teaching master students, language training, educational process, university, learning management system (lms moodle)
Short address: https://sciup.org/147247560
IDR: 147247560 | UDC: 378.245.5 | DOI: 10.14529/ped250104
Применение инфографики в профессиональном образовании магистрантов
В интерактивном и визуально привлекательном мире сфера образования старается создать визуально привлекательные учебники и онлайн-курсы для студентов вузов. Это особенно актуально для магистрантов, поскольку в отличие от бакалавров у них должны быть развиты аналитические способности для научной и управленческой деятельности. На основании изученной литературы было выявлено отсутствие системного подхода к изучению понятия «инфографика», недостаточность разработки моделей применения инфографики в профессиональном образовании магистрантов. На основе изучения практического опыта был выявлен запрос преподавателей на методические материалы с применением инфографики. В результате возникает необходимость уточнения понятия и систематизации типов инфографики, моделей их внедрения в образовательный процесс подготовки магистрантов. Цель исследования - выявить возможности инфографики как средства визуализации в профессиональном образовании магистрантов. Поставлены и решены следующие задачи: уточнено понятие «инфографика»; выявлена осведомленность магистрантов о видах инфографики в образовании; проанализирована эффективность видов инфографики в обучении магистрантов; изучены точки зрения преподавателей на использование видов инфографики; внедрены разнообразные виды инфографики в процессе обучения магистрантов. Теоретическими результатами исследования являются изучение авторских подходов к понятию «инфографика», упорядочение типов инфографики и возможностей их применения в образовательном процессе. Эмпирическое исследование осуществлено на базе Южно-Уральского государственного университета. Были использованы: анализ научно-методической литературы, анкетирование, опрос, альфа-метод Кронбаха. В исследовании приняли участие 33 магистранта и 26 преподавателей. Эмпирическое исследование показало, что большинство студентов магистратуры осведомлены о некоторых типах инфографики, но не знают о возможности их применения в образовательном процессе. Преподаватели осведомлены об основных типах, но не знакомы с классификацией и применяют только несколько видов, что объясняется прежде всего нехваткой времени на освоение. Внедрение различных видов инфографики в процесс профессионального образования магистрантов показало повышение интереса и мотивации магистрантов, а также сделало восприятие информации простым и захватывающим процессом. Результаты могут быть полезны преподавателям в обучении магистрантов с использованием инфографики.
Text of the scientific article Implementation of infographics in master students' professional education
The individuals and communities residing in the world are constantly evolving. Gone are the days when people relied on libraries for research; they now turn to websites and search engines to find information that directs them toward solutions to their inquiries. Consequently, learning behaviors have undergone significant transformations, prompting numerous research studies aimed at evaluating and improving the quality of learning through various learning management systems (LMS), for example LMS Moodle [17].
Modern communication technologies allow individuals to access information and resources at any time and from any location [1]. Consequently, learners utilizing instructional technology must understand and retain information from a variety of educational sources. Current approaches to information access frequently incorporate visual knowledge resources, often accompanied by succinct written explanations, thus offering an intuitive and easily navigable way to retrieve information [7]. Information graphics, commonly known as infographics, serve as visual representations of data via pie charts, bar graphs, line graphs, and histograms. They facilitate clear data communication to the target audience and are regarded as both visually engaging and valuable tools in instructional technology and design [14, 15].
Many universities, participants in the “Priority 2030” initiative, established its primary objective as the cultivation of a new generation of leaders equipped to tackle global challenges and enhance the state of the world with the help of new methods [19].
The necessity arises to use infographics in the master students’ education, as there is insufficient development of the methodology of teaching foreign languages to master students using infographics [1, 7].
In the educational practice lecturers and master students are not aware of the importance of infographics implementation in educational process. Educators lack awareness of what type of infographics is suitable for learning specific material and do not have time to master it.
The objective is to analyze the use of infographics types within the educational process on the example of English language instruction for master students of South Ural State University. The tasks were as follows in the research: to clarify the concept of infographics; to identify the master students’ awareness regarding the various types of infographics utilized in the university’s educational process; to analyze the frequency and effectiveness of the use of infographics in teaching a foreign language; to ascertain the perspectives of lecturers and the challenges related to employing infographics as a tool for language education; to implement various types of infographics in the process of master students’ education.
Literature Review
In today's era of information overload, the effective transmission of knowledge is essential. Universities, serving as pillars of knowledge and information, constantly strive to discover innovative methods for communicating intricate concepts and engaging their users [9]. One notable innovation is the use of infographics – visual representations that combine text, images, and design to simplify information into easily comprehensible formats [12]. Incorporating infographics within master education is expected to improve information dissemination, aid comprehension, and enrich the overall master students’ experience. Globally, infographics serve as effective tools for information sharing, playing a crucial role across various educational sectors.
It is also important to note the historical evolution of infographics. James Joseph Sylvester is recognized for coining the term “graph” [24]. In 1626, Christopher Scheine introduced the first infographic in the scientific journal Rose Ursina sive Sun, depicting the logical connections between mathematical properties and chemical bonding in the field of chemistry [6].
Peter Sullivan played a pivotal role in the evolution of infographics by coining the term “infographic” during the 1980s and 1990s [23]. This term gained traction, particularly through The Sunday Times, which favored the use of graphics. Additionally, in 2000, Adobe Flash animation was employed to produce infographics in game development and various other applications [20]. Infographics address the growing need for more engaging and interactive presentations within the academic community. They leverage visual representations to clarify complex information. Established infographic standards are designed to maintain the integrity of the content while minimizing barriers to understanding.
E. Mansour asserts that infographics effectively engage audiences by presenting information in a concise and visually appealing manner, thereby communicating essential details [16]. This visual strategy enables master students to quickly comprehend vital information, such as themes and key highlights. For lecturers aiming to attract user interest, infographics prove to be a remarkably effective means of communication and information dissemination [18]. Alyahya’s research examines the use of infographics as an educational tool in higher education and research. The findings indicate that integrating infographics into instructional technology disciplines assists educators in enhancing message delivery during visual presentations, ultimately fostering increased student engagement in the learning process [5].
Al-Mohammadi in his research evaluates the infographics effectiveness as a teaching method for programming. He concludes that the in- fographic strategy has a beneficial impact on teaching programming fundamentals, besides it contributes to the analytical thinking skills development with high school students in Makkah, Saudi Arabia. The research also discusses the challenges faced in the implementation of infographics [4]. B.E. Crane emphasizes the essential elements necessary for effectively communicating a narrative through infographics, which includes accurate data, engaging design, and proficient use of visualization tools. The incorporation of icons, design features, and visual metaphors is crucial for conveying the intended message [10]. Additionally, it is important to recognize that the application of infographics demands time, knowledge and skills [22].
In general, infographics present charts and diagrams (pie and bar charts, line graphs, maps, histograms etc.). E. Mansour highlights the types of infographics, including timeline, statistical, and informational infographics [16]. A.D. Ushakova distinguishes the following infographics types: statistical infographics, informational, timeline, process and how-to’s, geographic or map infographics, comparison, hierarchical, list infographics, infographic resume, photography infographics, mind maps, word clouds. The researcher also suggests the most common formats of infographics – static, animated and interactive infographics [25].
Based on the analysis of the above-mentioned papers, we clarified the concept “infographics”, giving a broader classification. In our understanding infographics are visual representations that combine text, images, and design to simplify information into easily comprehensible formats, using a variety of infographics types: statistical (charts, icons, images and eye-catching fonts), informational (with descriptive headers), timeline (lines, icons, photos, and labels), process and how-to’s, map, comparison, hierarchical (pyramids, a chain of command), list (using bullet points), infographic resume, photography infographics, mind maps, word clouds (task 1). In our research we apply the above-mentioned infographics types via the authors’ textbook and online course “English for Masters of Mathematics” through Moodle into the process of teaching English for master students.
Materials and Methods
We applied theoretical and empirical methods, analyzing modern scientific and methodological literature and using questionnaires and interviews. Cronbach's alpha, the method of mathematical data processing, was also applied to evaluate responses for reliability.
The following tasks were set in the research:
-
1) to clarify the concept of infographics, we made literature analysis and clarified the concept “infographics”, giving a broader classification;
-
2) to identify the master students’ awareness regarding the various types of infographics utilized in the university’s educational process, we used questionnaires and interviews for 33 master students;
-
3) to analyze the frequency and effectiveness of the use of infographics in teaching a foreign language, questionnaires and interviews were implemented among 33 master students;
-
4) to ascertain the perspectives of lecturers and the challenges related to employing infographics as a tool for language education, an analysis of the educators’ needs was used;
-
5) to implement various types of infographics in the process of master students’ education, infographics were introduced into the process of teaching English in the authors’ textbook and online course “English for Masters of Mathematics” via LMS Moodle.
Participants. The experiment was carried out in September 2024. The respondents who answered the questions of the questionnaire and answered interview questions on infographics were 33 master students of Maths of the SUSU. Among them 28 or 84% were male and 5 or 16% were female. This is due to the fact that more men decided to take part in the experiment.
In general, 28 students (84%) are aged 22, the other 16% are about 30–46 years old. Some students entered the university after college and it took more years to study, and also some of them had a gap while just working.
26 ESL educators were interviewed in order to understand whether educators are ready to use infographics for language training and what difficulties they experience in this process.
Instruments. By combining the questionnaire and the interview, the results were verified to improve the validity of the data [2].
We applied Google Forms, a free online tool, for collecting information. The online questionnaire for master students consisted of 10 questions. The first part comprised 5 questions about age, citizenship, institute / university, gender and year of study. The second part – 5 questions related to infographics about master students’ awareness about infographics in the educational process. Questionnaire for educators was oriented upon getting information about the ESL lecturers’ awareness about infographics for teaching a foreign language, as well as their experience, challenges with the use of infographics in the classroom. Single-choice, multiple-choice, and yes/no questions were applied in responses [3, 8]. For calculating quantitative data, SPSS Version 26 was used. Before analyzing, Cronbach's alpha was calculated to obtain internal consistency.
Results and discussion
The first result was clarifying the concept of infographics, giving a broader classification (see Literature Review). This concept gave us the possibility to assess the results of the questionnaires and interviews.
Our emphasis was on assessing the utilization of infographics within the university’s educational framework. Master students and ESL instructors responded to questions, whose responses were subsequently evaluated for reliability. The questionnaires demonstrate an accep- table level of stability and can be considered dependable for research purposes (as shown in Tables 1 and 2).
Table 1
Reliability statistics for the educators' questionnaire
|
Chronbach’s Alpha |
Items № |
|
0,801 |
24 |
Table 2
Reliability statistics for the master students’ questionnaire
|
Chronbach’s Alpha |
Items № |
|
0,985 |
64 |
To assess the understanding of master students regarding the various types of infographics utilized in the university’s educational process (task 2), we conducted interviews focusing on the infographics types related to foreign language learning that they are acquainted with. Our findings indicate that visual articles are the most popular choice among students. As illustrated in Fig. 1, data visualization and lists occupy the se-
Infographics types familiar to master students
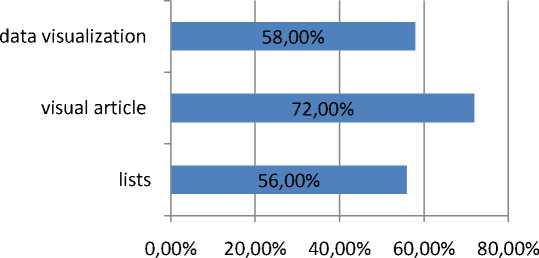
Fig. 1. Infographics types mentioned by familiarity among master students
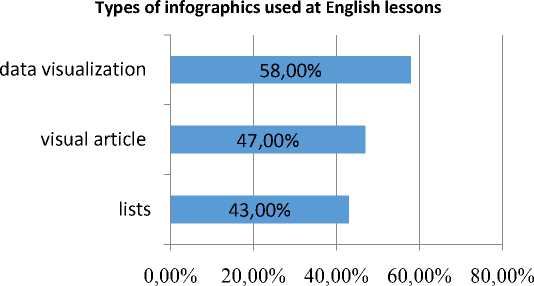
Fig. 2. Frequency of infographics types among master students
cond and third positions, respectively, among the frequently cited types in the responses of master’s students.
To conduct a frequency analysis of the types of infographics utilized in foreign language instruction (task 3), we asked master students regarding the types they frequently employ during English lessons. The findings are illustrated in Fig. 2 below. Figs. 1 and 2 show that the familiarity and frequency values for data visualization are the same. However, the frequency values for visual articles and lists are lower than the familiarity values. This indicates that not all types of infographics are utilized by English lecturers in the classroom.
In order to analyze the effectiveness of the use of infographics in foreign language instruction (task 3), master students responded to inquiries regarding how infographics might facilitate their language acquisition. Participants were provided with several options, from which they could select one freely. The distribution of responses for each reason supporting the use of infographics in foreign language learning was as follows: it enhances motivation – 82%; it makes the learning experience more engaging – 73%; and it aids in the comprehension of complex concepts – 54%.
To ascertain the perspectives of lecturers and the challenges related to employing infographics as a tool for language education (task 4), a series of questions were directed at English instructors.
The initial inquiry focused on the various types of infographics recognized for teaching foreign languages. The answers are presented in Fig. 3. The most well-known type of infographics among lecturers of English is data visualization (70%). This amount is more than students answered (58%). But educators are less aware of visual article (62%) than students (72%). This can be explained by students’ increased use of mobile phones and their desire to read more quickly, so the use of visual article makes this process easier. Lists are the least preferable type of infographics for educators (55%).
The second inquiry directed at educators focused on the types of infographics they predominantly employ during English lessons. The re-
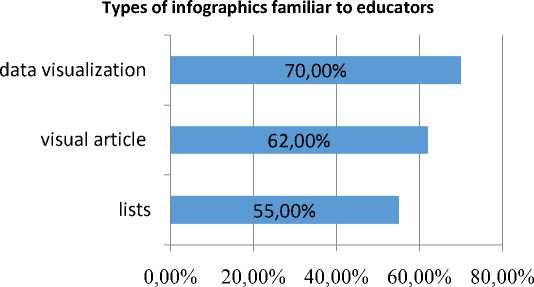
Fig. 3. Types of infographics familiar to English lecturers
Types of infographics mentioned by frequency among English lecturers
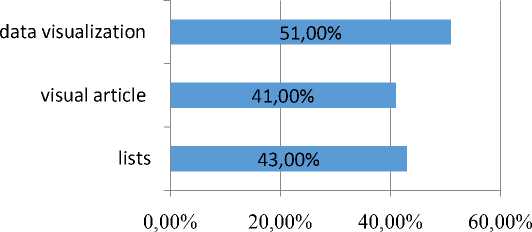
Fig. 4. Types of infographics mentioned by frequency among English lecturers
sponses regarding the frequency of infographic usage by English instructors in the classroom revealed lower figures compared to the responses about their familiarity with such tools (Fig. 4). Just over half of the respondents (51%) reported utilizing data visualization in their lessons. In contrast, visual articles and lists were used by fewer than half of the educators, with 41% and 43% respectively. The limited practical application of infographics can be attributed to various challenges faced by educators. The problems were described separately in the questionnaire.
The next question for educators was about what challenges they experience when using infographics . Responses to inquiries regarding the challenges associated with utilizing infographics highlighted the reasons for the low ratings concerning the application of different types of infographics in English practical classes. The major part of respondents (45%) believe that preparing lessons using infographics takes too much time. 38% of educators consider that choosing the right type of infographics for lesson purposes is time-consuming. A number of respondents (14%) acknowledge that they lack sufficient knowledge to effectively conduct a lesson utilizing infographics (Fig. 5).
The results show that infographics as a means should become a mandatory component of the educational process. Blending various infographics types will change ways of foreign language teaching to satisfy the master students’ needs [21].
Taking into account that some students can be prone to passivity and shy for some reasons (individual, social or cultural), some of them prefer to work independently without cooperation with others, using infographics as a means of master students’ language training enhances motivation, improves their communication skills. Infographics help to grasp the material easier and make master students doers of the process, especially with game elements [11–13]. Consequently to implement various types of infographics in the process of master students’ education, infographics were introduced into the process of teaching English in the authors’ textbook and online course “English for Masters of Mathematics” via Moodle (task 5) based on the analysis of the results and answers of ESL educators.
Therefore a new online course for language development “English for Masters of Mathematics” was introduced. The online course, specifically designed for master students, offered the materials targeted at master students’ language skills with the infographics use (in vocabulary, reading, writing, listening, and speaking). Each unit comprises tests that promote independent language acquisition. The course features
Challenges in using infographics among English lecturers
-
■ time-consuming for choosing the right type of infographics
-
■ preparing lessons using infographics takes too much time
-
■ lack of knowledge for conducting lessons using infographics
-
■ all the above mentioned issues
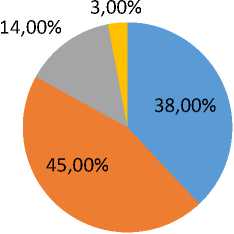
Fig. 5. Challenges in using infographics among English lecturers
Table 3
|
Unit № |
Topic |
Infographics type |
Task |
|
1 |
How to plan my future career |
Infographic resume |
Read the text below and put the sub-headings into the gaps. |
|
Process infographics |
Read the text and mark sentences True (T) or False (F). |
||
|
Informational infographics |
Look at the infographics and answer the questions. |
||
|
2 |
How to do my research |
Process infographics |
Study the following scheme as a guideline to follow as your work through your paper. How many steps are there in the research process? What are they? What step are you making in your research at the moment? |
|
How-to infographics |
Study the given infographics and make a list of important features of research topic in pairs. |
||
|
List |
Read the questions carefully and make a list of important features of a good source for an academic purpose. Compare your answers with the class. |
||
|
3 |
How to read scientific papers |
Word clouds |
Use the word clouds to speak about the qualities that academic texts usually have. |
|
How-to infographics |
Brainstorm some ideas on the question “How is reading a scientific paper different from reading a blog or a newspaper?” |
||
|
List |
Read the text and answer the questions. |
||
|
4 |
How to communicate with scientific communities |
Process infographics |
Speak about the procedure of preparing and submitting your last paper to the conference. Use the scheme to help you describe the process. Share your experience with the audience. |
|
Statistical infographics |
Study the infographics and answer the questions. |
||
|
5 |
How to create my research profile |
Comparison |
Look at the types of a researcher and choose the one you belong to. |
|
Infographic resume |
Match the headings to the parts of Dr. Ijad Madisch’s profile in ResearchGate. Compare your answers with your partner. |
||
|
Statistical infographics |
ResearchGate gives scientists new tools to connect, collaborate, and keep up with the research that matters most to them. Look at the quick stats and answer the questions. |
Topics, infographics types and tasks in the textbook and online course “English for Masters of Mathematics”
engaging, memorable, and action-oriented content, complemented by a robust visual component that provides clear context for new language topics, encouraging students to take an active role in language construction. It has appealing userfriendly interface and intuitive structure. Infographics are presented at the beginning of the online tasks.
We highlight the implementation of infographics in the textbook and online course, thus in Table 3 the examples of topics, infographics types and corresponding to them tasks are presented in the context of training master students’ skills.
As we see in Table 3, a variety of infographics types and specific tasks for them are used in the textbook and online course, making grasping information an easy and exciting process as well as facilitating clear and comprehensive communication of data.
Conclusion
We clarified the concept “infographics”, giving a broader classification. In our understanding infographics are visual representations that combine text, images, and design to simplify information into easily comprehensible formats, using a variety of infographics types: statistical (charts, icons, images and eye-catching fonts), informational (with descriptive headers), timeline (lines, icons, photos, and labels), process and how-to’s, map, comparison, hierarchical (pyramids, a chain of command), list (using bullet points), infographic resume, photography infographics, mind maps, word clouds.
The research included 33 master students and 26 lecturers of English. It revealed that the most of master students are aware of some infographics types, but they are not familiar with different classifications and how they can help them in learning English. However, they all agree that infographics can boost their motivation. Educators are aware of basic types, but are not familiar with the classification and apply only a few types. The limited practical application of infographics can be attributed to various challenges faced by educators, and the first challenge – they do not have time to master types of infographics. Based on the results, we introduced infographics into the process of teaching English in the authors’ textbook and online course “English for Masters of Mathematics” via LMS Moodle, using a variety of infographics types and presenting specific tasks for them.
In general, educators and master students are positive in their relation towards infographics mastering and application in the educational process of the university. Infographics effectively render a narration through various types, convey the intended message for master students to quickly comprehend vital information, catch users’ interest. All the above mentioned lead to effective teaching and learning the language in master students’ training. SUSU incorporates infographics into traditional classroom instruction that brings better results.
The research can be helpful for educators of foreign languages in master education via infographics.
References Implementation of infographics in master students' professional education
- Al Saleh S., Bhat S.A. Mobile Learning: A Systematic Review. International Journal of Computer Applications, 2015, vol. 114, no. 11, pp. 1–5. DOI: 10.5120/20019-1406
- Alamri W.A. Effectiveness of Qualitative Research Methods: Interviews and Diaries. International Journal of English and Cultural Studies, 2019, vol. 1, no. 2, pp. 65–70. Available at: https://core.ac.uk/download/pdf/228085022.pdf (accessed 15.09.2024). DOI: 10.11114/ijecs.v2i1.4302
- Alharbi A., Alhebshi A., Meccawy Z. EFL Students’ and Teachers’ Perceptions of Google Forms as a Digital Formative Assessment Tool in Saudi Secondary Schools. Arab World English Journal, 2021, no. 7, pp. 140–154. Available at: https://ssrn.com/abstract=3904474 (accessed 23.09.2024). DOI: 10.24093/awej/call7.10
- Al-Mohammadi N. Effectiveness of Using Infographics as an Approach for Teaching Programming Fundamentals on Developing Analytical Thinking Skills for High School Students in the City of Makkah in Saudi Arabia. Global Journal of Educational Studies, 2017, vol. 3, no. 1, pp. 22–42. DOI: 10.5296/gjes.v3i1.10854
- Alyahya D.M. Infographics as a learning tool in higher education: the design process and perception of an instructional designer. International Journal of Learning, Teaching and Educational Research, 2019, vol. 18, no. 1, pp. 1–15. DOI: 10.26803/ijlter.18.1.1
- Bicen H., Beheshti M. The Psychological Impact of Infographics in Education. BRAIN. Broad Res. Artif. Intell. Neurosci., 2017, vol. 8, no. 4, pp. 99–108. Available at: https://brain.edusoft.ro/index.php/brain/article/view/733/821 (accessed 23.10.2024).
- Blascheck T. Exploration Strategies for Discovery of Interactivity in Visualizations. IEEE Transactions on Visualization and Computer Graphics, 2019, vol. 25, no. 2, pp. 1407–1420. DOI: 10.1109/TVCG.2018.2802520
- Buschle C., Reiter H., Bethmann A. The Qualitative Pretest Interview for Questionnaire Development: Outline of Program and Practice. Quality and Quantity, 2022, vol. 56, pp. 823–842. DOI: 10.1007/s11135-021-01156-0
- Clarke R.I., Bell S. Transitioning from the MLS to the MLD: Integrating Design Thinking and Philosophy into Library and Information Science Education. Percell J., Sarin L.C., Jaeger P.T., Bertot J.C. (Ed.) Re-envisioning the MLS: Perspectives on the Future of Library and Information Science Education (Advances in Librarianship, Vol. 44A), Emerald Publishing Limited, Leeds, 2018, pp. 195–214. DOI: 10.1108/S0065-28302018000044A018
- Crane B.E. Infographics: A Practical Guide for Librarians. MD, Rowman & Littlefield Publ., 2015. 273 p.
- Elsakova R.Z., Kuzmina N.N., Markus A.M., Kuzmina N.M. [Classification of Neural Networks for Creating Educational Content by University Educators]. Bulletin of the South Ural State University. Ser. Education. Educational Sciences, 2024, vol. 16, no. 2, pp. 17–29. (In Russ.) DOI: 10.14529/ped240202
- Hughes C., Wiles M.D., Charlesworth M. How to Visually Represent Data. Anaesthesia, 2023, vol. 78, no. 8, pp. 1031–1035. DOI: 10.1111/anae.15969
- Kuzmina N., Kochkina D., Kuzmin M. Blended Learning as a Means of Foreign Students’ Integration into a University Educational Process. International Journal of Emerging Technologies in Learning (iJET), 2021, vol. 6, no. 16, pp. 259–274. DOI: 10.3991/ijet.v16i06.19073
- Lam N.T., Trang V.M., Huy N.H., Cuong T.Q. Modeling Interactive E-book: Computational Perspective and Design Principles. Proceedings of 2nd International Conference on Mathematical Modeling and Computational Science, 2022, pp. 141–149. DOI: 10.1007/978-981-19-0182-9_15
- Le D., Pole A. Beyond Learning Management Systems: Teaching Digital Fluency. Journal of Political Science Education, 2022, vol. 1, no. 19, pp. 134–153. DOI: 10.1080/15512169.2022.2139268
- Mansour E. Use of Infographics as a Technology-Based Information Dissemination Tool: the Perspective of Egyptian Public University Libraries Library Staff. Library Hi Tech, 2021, vol. 40, no. 6, pp. 1819–1842. DOI: 10.1108/LHT-03-2021-0084
- Paquette-Lemieux E., Hays S., Gaspo R. US Medical Information Websites Benchmarking: How Is the Industry Fairing in Usability? Therapeutic Innovation and Regulatory Science, 2019, vol. 53, no. 3, pp. 340–348. DOI: 10.1177/2168479018786481
- Pretlow C. From Data Snore to Data Score: Communicating Library Assessment Data Visually through Infographics. City University of New York (CUNY), New York, 2014, pp. 1–11.
- Prioritet 2030: liderami stanovyatsya [Priority 2030: You Become Leaders]. Available at: https://priority2030.ru/ (accessed 23.10.2024).
- Ru G., Ming Z.Y. Infographics Applied in Design Education. IEEE Workshop on Advanced Research and Technology in Industry Applications (WARTIA), 2014, pp. 984–986. DOI: 10.1109/WARTIA.2014.6976439
- Sanchez M., Masegosa A. Gamification as a Teaching Resource for English-Medium Instruction and Multilingual Education at University. Recent Tools for Computer and Mobile-Assisted Foreign Language Learning, Alberto Andujar (Ed.), IGI Global, 2020, pp. 248–267. DOI: 10.4018/978-1-7998-1097-1.ch012
- Schwartz J. Visual Literacy: Academic Libraries Address 21st Century Challenges. Reference Services Review, 2018, vol. 46, no. 4, pp. 479–499. DOI: 10.1108/RSR-04-2018-0048
- Siricharoen W.V Infographics: the New Communication Tools in Digital Age. The International Conference on e-technologies and Business on the Web (ebw2013), 2013, pp. 169–174. Available at: https://www.researchgate.net/profile/Waralak-Siricharoen/publication/256504130_Infographics_the_new_communication_tools_in_digital_age/links/0c9605232e6f666b1f000000/Infographics-the-newcommunication-tools-in-digital-age.pdf (accessed 24.10.2024).
- Sylvester J.J. On an Application of the New Atomic Theory to the Graphical Representation of the Invariants and Covariants of Binary Quantics, with Three Appendices. American Journal of Mathematics, 1878, vol. 1, no. 1, pp. 64–104. DOI: https://doi.org/10.2307/2369436
- Ushakova A.D. [Infographics Basics]. Ekaterinburg, Azhur Publ., 2023. 127 p. (In Russ.)
