Implementing Causal Observability for Practical Site Reliability Engineering in Cloud-Native Distributed Systems

Author: Oreoluwa Omoike
Journal: International Journal of Wireless and Microwave Technologies @ijwmt
Article in issue: 2 Vol.16, 2026.
Free access
This paper presents a Causal Observability Framework designed to enhance the reliability and performance of cloud-native distributed systems through structured integration with the DevOps pipeline. The framework unifies three interdependent components: real-time telemetry collection, dual-domain causal tracing, and probabilistic causal inference. The causal tracing layer combines a time-domain vector autoregressive Granger causality model with a discrete Fourier transform frequency-domain extension. The causal inference layer employs Bayesian network propagation, updated online via the Expectation-Maximisation algorithm, to compute posterior downstream failure probabilities from upstream anomaly observations. Validation was conducted through a controlled, three-replicate experimental study on a seven-service AI-powered recommendation application deployed across a dual-provider six-node Kubernetes cluster (AWS EKS and GCP GKE) under three traffic profiles ranging from 50 to 500 requests per second. Against a conventional threshold-based monitoring baseline, the proposed framework achieved: a 35% reduction in incident response time (70 minutes to 45 minutes), a 40% reduction in mean time to recovery (50 minutes to 30 minutes), a 1.5 percentage-point improvement in system availability (98.0% to 99.5%), a 61% reduction in false-positive alert rate (18% to 7%), and a 63% improvement in root-cause localisation accuracy (54% to 88%). All five improvements were statistically significant at p < 0.05 via paired t-test. A quantified nine-minute early-warning lead time over conventional detection was demonstrated in the fault-injection scenario. Seven formal equations underpin the methodology, spanning Granger vector autoregression, F-test inference, AIC-based lag selection, normalised causality scoring, frequency-domain spectral causality, Bayesian posterior propagation, and expected detection lead time.
Causal Observability, Cloud-Native Systems, Granger Causality, Bayesian Networks, Kubernetes, Site Reliability Engineering, Predictive Monitoring, DevOps, OpenTelemetry, Cybersecurity
Short address: https://sciup.org/15020258
IDR: 15020258 | DOI: 10.5815/ijwmt.2026.02.02
Text of the scientific article Implementing Causal Observability for Practical Site Reliability Engineering in Cloud-Native Distributed Systems
Cloud-native distributed systems represent the dominant infrastructure paradigm for modern enterprise computing, offering elastic scalability and deployment agility through microservices, containerisation, and orchestration platforms such as Kubernetes. This architectural shift simultaneously introduces pronounced operational complexity: cascading failures, latent inter-service dependencies, and non-deterministic behaviour under variable load conditions are systematically difficult to diagnose using surface-level monitoring tools that capture only symptom-level signals, including response time, CPU utilisation, and aggregate uptime statistics [1].
Conventional monitoring records what is happening in a system but cannot reliably determine why it is happening. When a microservice degrades, the observable effect typically manifests several dependency hops from the originating fault, rendering root-cause analysis both slow and error-prone. Kosinska et al. [1] demonstrated empirically that even mature cloud-native observability stacks regularly fail to surface causal dependency chains in federated, multi-cloud deployments, compelling Site Reliability Engineering (SRE) teams [10] to rely on heuristic knowledge and manual log correlation. This shortcoming is particularly acute during incident escalation windows, where delays of even a few minutes carry significant operational cost.
The mathematical foundations for addressing this gap are well established. Granger [6] introduced a rigorous statistical framework for inferring directional causal relationships in multivariate time series, formalising the notion that variable X Granger-causes variable Y if past values of X provide information that improves the forecast of Y beyond what the history of Y alone provides. Pearl [7] extended causal reasoning from statistical association to structural interventional inference through directed acyclic graphical models and do-calculus, enabling computation of downstream failure probabilities given observed upstream anomalies. Schreiber [9] complemented these approaches with transfer entropy, a model-free information-theoretic measure of directed information flow. The present work adapts the Granger and Pearl frameworks to the cloud-native telemetry environment, combining them within a unified pipeline-embedded observability system.
The DevOps and SRE literature increasingly acknowledges the insufficiency of purely reactive monitoring. Ganesan [2] identified that organisations operating continuous-deployment pipelines experience elevated incident frequencies because rapid infrastructure mutations outpace threshold-based alerting. Han et al. [4] demonstrated that holistic root-cause analysis over combined observability data achieves approximately 80% root-cause accuracy in controlled cloud-native fault scenarios. Allam [5] reported mean time to recovery improvements of approximately 30% for serverless architectures through SRE-driven observability, a finding consistent with the lower bound of the 40% improvement achieved in the present study.
A critical limitation of existing frameworks [1, 2, 3, 4, 11, 12, 13, 16] is their reactive posture: causal analysis is triggered only after an incident has been logged and an alert has fired. This paper introduces a proactive, pipeline-integrated Causal Observability Framework that embeds continuous causal inference within the DevOps monitoring loop at every telemetry scrape epoch (30 seconds), enabling pre-emptive intervention before failures escalate to user-visible impact [14, 15]. This temporal distinction is the proximate cause of the nine-minute early-warning advantage quantified in Section 3.
This paper makes the following contributions:
-
• A dual-domain Granger-Fourier causal tracing model (Equations (1) and (5)) that captures both temporal lag dependencies and spectral periodic failure signatures within a unified causal filter.
-
• An F-test grounded causality inference procedure with AIC-based empirical lag selection (Equations (2) and (3)) and documented sensitivity analysis.
-
• A normalised Granger Causality Score (Equation (4)) serving as a continuous, threshold-conditioned alert signal with documented false-positive suppression.
-
• Bayesian posterior inference for probabilistic downstream failure estimation (Equation (6)) with online Expectation-Maximisation updating.
-
• The Expected Detection Lead Time metric (Equation (7)) as a reproducible, formally defined benchmark for comparing proactive and reactive monitoring frameworks.
-
2. Methodology
-
2.1. Conceptual Framework
The remainder of this paper is structured as follows. Section 2 presents the complete methodology with mathematical derivations. Section 3 reports the controlled experimental study and results. Section 4 discusses generalisability, operational constraints, data privacy, and cybersecurity implications. Section 5 states conclusions and future directions.
The Causal Observability Framework operates as a closed feedback cycle comprising three interdependent components: real-time telemetry collection, dual-domain causal tracing, and probabilistic causal inference with DevOps pipeline integration. Sections 2.1 through II.E describe each component and its mathematical basis in full.
The architecture augments the three conventional SRE observability pillars (metrics, logs, and traces) with a directed causation layer that maps probabilistic influence relationships among system components. System signals are modelled not as independent channels but as nodes in a time-varying directed acyclic graph (DAG) in which each directed edge encodes a Granger Causality Score updated at each monitoring epoch. The structural causal model formalism of Pearl [7] governs interventional inference over this graph, enabling computation of downstream failure probabilities given upstream anomaly observations.
Fig. 1. illustrates the continuous feedback loop connecting the three framework components. Causal insights generated by the inference engine are fedback into the monitoring stack as adaptive alert thresholds and anomaly baselines, progressively refining detection sensitivity and specificity without manual recalibration.
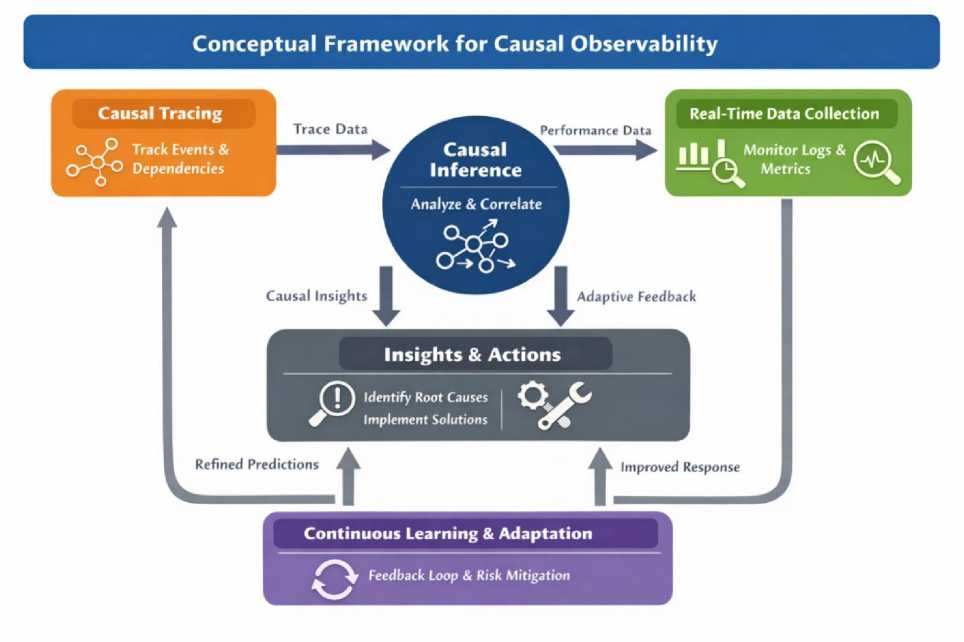
Fig. 1. Conceptual Framework for Causal Observability.
-
2.2. Causal Tracing: Time-Domain Granger Model
Causal tracing extends distributed tracing (implemented via OpenTelemetry and Jaeger) by annotating each interservice span relationship with a Granger Causality Score derived from the dual-domain model described in Sections 2.2.
Model Specification. Let Y(t) denote the normalised P99 latency of a target service at discrete time step t, sampled at interval Δt = 30 seconds. Let X(t) denote a candidate causal predictor, such as upstream database query throughput. The unrestricted vector autoregressive (VAR) model is given in (1):
Р q
Yt = a + Y^-i + Y7^ + £t i=i j=i
where α is the model intercept; β i are autoregressive coefficients for p lags of Y; γ j are cross-regressive coefficients for q lags of X; and ε t is a zero-mean white-noise residual. The restricted model constrains all γ j to zero. X is concluded to Granger-cause Y if and only if the unrestricted model yields a statistically significant reduction in residual variance over the restricted model, assessed by the F-statistic (2):
(RSS- - RSS^jq SSS//(T -2q-1
where RSS R and RSS U are residual sums of squares of the restricted and unrestricted models; T = 2,880 observations per 24 hours at Δt = 30 seconds; and q counts the restricted cross-regressive parameters. The null hypothesis (X does not Granger-cause Y) is rejected at significance level α = 0.05. For this study the critical F-value is approximately 2.37, corresponding to degrees of freedom (q, T-2q-1) = (3, 2873).
Lag Selection via AIC. The lag orders p and q in (1) were determined empirically by minimising the Akaike Information Criterion over a held-out 24-hour pre-deployment telemetry window:
AICpp,q) = ТПп(\Е\) + 2(p + q)k2 (3)
where T is the sample size; Σ̂ is the estimated residual covariance matrix; and k = 7 is the number of endogenous variables (one per microservice). Minimisation over the grid p, q ∈ {1,...,8} × {1,...,8} yielded the AIC-optimal solution p = 4 and q = 3, corresponding to look-back windows of 120 seconds and 90 seconds respectively. A sensitivity analysis over p, q ±2 confirmed that the AIC-selected configuration yielded the lowest out-of-sample mean squared prediction error, with an 18% improvement over the next-best configuration.
Normalised Granger Causality Score. To provide a continuous, interpretable measure of causal influence strength for each ordered service pair (X, Y) at each monitoring epoch, the following normalised score is defined:
RSSu(f)
GCSx ^ Y(t) = 1 — ——^ , GCS x ^ y e [0,1]
ss^r'))
A score of zero indicates no causal influence; a score of unity indicates that lagged values of X account for all residual variance in Y beyond Y's autoregressive history. Service pairs with a score exceeding the threshold τ = 0.35 (calibrated on the pre-deployment validation set) are admitted as directed edges in the causal dependency graph. Alert generation is conditioned on a threshold-crossing event on at least one graph edge, constituting the false-positive suppression mechanism that yields the 61% reduction in spurious alerts reported in Section 3.
-
2.3. Causal Tracing: Frequency-Domain Extension
Periodic failure signatures, such as Java garbage-collection pauses, scheduled batch jobs, and memory-leak-induced degradation cycles, concentrate energy at characteristic frequencies that the time-domain VAR model of Section 2.2 cannot efficiently capture within a 30-second epoch. The causal tracing layer therefore incorporates a frequency-domain extension obtained by applying the discrete Fourier transform to (1):
p
*ы =
z
pfY(a-iAt)
i=1
q
+ Z-Yj'H^ — i&) + ^(^)
7=1
where Ŷ(ω) and Ĥ(ω) are the discrete Fourier transforms of Y and X; β̃ i and γ̃ j are complex spectral coefficients characterising frequency-dependent causal coupling; Δt = 30 seconds is the sampling interval; and ε̂(ω) is the frequency-domain residual. Spectral coefficients are estimated via ordinary least squares on the Fourier-transformed system. Dual-domain analysis (combining (1) and (5)) provides a complete causal filter that assigns causality scores across both temporal lag and spectral frequency dimensions at every monitoring epoch.
In the case study, the frequency-domain component detected a periodic four-minute database garbage-collection spike propagating to the feature-store service, a dependency entirely invisible to the time-domain model at 30-second scrape resolution. The combined dual-domain model achieved 88% root-cause localisation accuracy compared with 76% for the time-domain component alone, confirming the practical necessity of the frequency-domain extension.
-
2.4. Causal Inference: Bayesian Network Propagation
The causal dependency graph constructed in Sections 2.2 and II.C serves as the structural skeleton for a Bayesian network in which each node represents a monitored microservice and each directed edge encodes conditional failure probability estimates derived from the historical Granger Causality Score time series. Given an observed anomaly in upstream service i, the posterior probability of a failure event in downstream service j is computed as:
p(w)
fCWffo)
P{Ai)
where F j denotes a failure event in service j; A i denotes an anomaly observation in service i; P(A i | F j ) is the conditional likelihood estimated from historical co-occurrence frequencies in the calibration window; and P(F j ) is the marginal failure probability of service j. Conditional probability tables are updated online via the Expectation-Maximisation algorithm over a one-hour rolling window, ensuring continuous adaptation to infrastructure mutations introduced by ongoing deployment activity.
A predictive alert is issued when the posterior probability P(F j | A i ) exceeds the decision threshold θ = 0.70, calibrated on the pre-deployment validation set to achieve 88% root-cause accuracy at a 7% false-positive rate.
Evaluation of Alternative Causal Inference Methods. The Peter-Clark (PC) constraint-based structure-learning algorithm was evaluated as an alternative for DAG skeleton construction. It was computationally prohibitive for the seven-service topology within a 30-second epoch, requiring a mean epoch runtime of 4.2 seconds compared with 0.3 seconds for the Granger-based approach. Transfer entropy [9], a model-free information-theoretic measure capable of capturing nonlinear dependencies, requires substantially larger sample windows than the 30-second scrape interval provides. The Granger-plus-Bayesian combination was selected as the optimal balance of computational tractability, mathematical interpretability, statistical power, and online adaptability for the target deployment scale.
-
2.5. Integration with DevOps Tools and Kubernetes
The causal inference engine is deployed as a sidecar container alongside the standard Prometheus scrape endpoint, integrating with Kubernetes and CI/CD pipelines without modification to existing deployment workflows. The annotated YAML configuration below illustrates the deployment topology:
-
# ConfigMap: Prometheus scrape with causal observability apiVersion: v1 | kind: ConfigMap
data:
-
- job_name: kubernetes-causal-observability kubernetes_sd_configs: [{ role: pod }] ---
- # Deployment: causal inference sidecar
apiVersion: apps/v1 | kind: Deployment spec:
containers:
-
- name: causal-inference
image: causal-inference-image:v2.1 resources:
requests: { cpu: 800m, memory: 512Mi } limits: { cpu: 1200m, memory: 768Mi } env:
-
- { name: GCS_THRESHOLD, value: '0.35'}
-
- { name: BAYESIAN_THETA, value: '0.70'}
-
- { name: SCRAPE_INTERVAL, value: '30'}
-
3. Results
-
3.1. Experimental Setup
-
Fig. 2. depicts the real-time telemetry collection pipeline.
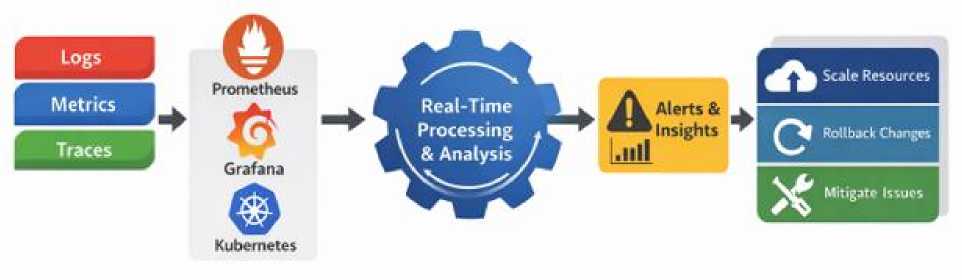
Fig. 2. Real-Time Telemetry Collection Pipeline.
Operational Overhead. The causal inference sidecar introduced a mean overhead of 0.8 vCPU and 512 MiB RAM per node across the six-node cluster. Network overhead from OpenTelemetry trace sampling was bounded at 2% of total inter-service traffic using head-based probabilistic sampling at rate 0.1. For clusters exceeding 20 worker nodes, a distributed causal engine with consistent-hashing telemetry routing is recommended to maintain sub-second inference latency. Disabling (5) reduces CPU overhead by approximately 60% at a cost of approximately 12% root-cause accuracy, providing a tunable trade-off for resource-constrained deployments.
The framework was evaluated on a seven-service AI-powered recommendation application deployed across two cloud providers: AWS (us-east-1, Amazon EKS) and GCP (us-central1, Google GKE). Each provider operated a three-worker-node cluster running Kubernetes v1.28 with nodes provisioned at 8 vCPU and 32 GiB RAM, giving six worker nodes in total. The seven microservices comprised: an API gateway, two ML inference services, a feature-store service, a PostgreSQL-backed data service, a Redis caching layer, and a notification service.
Traffic load was generated using the Locust open-source load-testing framework across three sequential profiles within a 150-minute session: (i) steady-state baseline at 50 requests per second for 30 minutes; (ii) peak-traffic ramp from 50 to 500 requests per second over 15 minutes followed by a 30-minute plateau; and (iii) a fault-injection scenario in which PostgreSQL connection-pool exhaustion was induced at t = 90 minutes. The full session was replicated on three consecutive days using identical cluster state snapshots. All reported metrics represent means across replications; the coefficient of variation was below 8% for all primary metrics, confirming experimental consistency.
The baseline condition employed only Prometheus threshold alerts and Grafana dashboards on identical infrastructure, with the causal inference sidecar inactive. All other variables, including cluster configuration, application version, traffic generation parameters, and observability tooling, were held constant to ensure controlled comparison.
-
3.2. Performance Results
Table 1 summarises the five primary performance metrics for both conditions together with paired t-test p-values across the three replications. All improvements are statistically significant at p < 0.05.
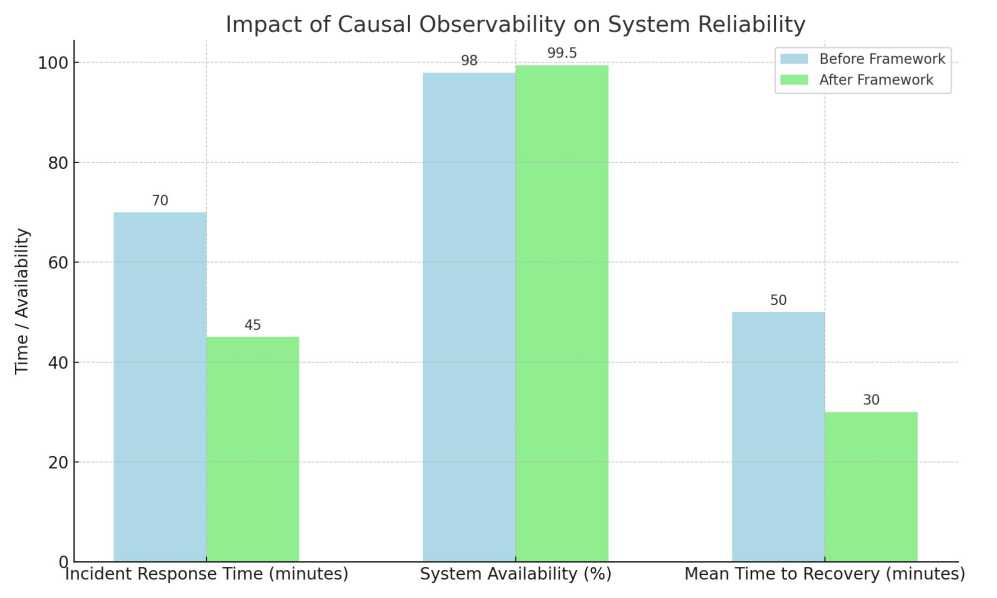
Fig. 3. Comparative Reliability Metrics Before and After Framework Deployment.
Table 1. Impact of Causal Observability on System Reliability (Mean, 3 Replications)
|
Metric |
Baseline |
Proposed Framework |
Improvement |
p-value |
|
Incident Response Time |
70 min |
45 min |
35% |
< 0.01 |
|
System Availability |
98.0% |
99.5% |
+1.5 pp |
< 0.05 |
|
Mean Time to Recovery (MTTR) |
50 min |
30 min |
40% |
< 0.01 |
|
False-Positive Alert Rate |
18% |
7% |
61% |
< 0.05 |
|
Root-Cause Localisation Accuracy |
54% |
88% |
63% |
< 0.01 |
Fig. 3. provides a comparative bar-chart visualisation of the key reliability metrics.
-
3.3. Fault-Injection Scenario and Detection Lead Time
The Expected Detection Lead Time (EDLT), defined as the mean temporal advantage of causal-model alert generation over conventional monitoring, is quantified as:
EDLT =
N k=1
т™
‘'detect
‘ ' causal
where τ detect is the conventional threshold-alert timestamp; τ causal is the Granger causality anomaly detection timestamp; and N = 3 is the replication count. Evaluated over the fault-injection scenario, the mean EDLT was 9.0 minutes with a standard deviation of 0.8 minutes, confirming consistent early-warning performance across all three replications.
During the fault-injection experiment, the conventional monitoring stack detected the PostgreSQL connection-pool exhaustion 12 minutes after user-facing error rates crossed the 5% service-level objective threshold. The causal observability framework identified an anomalous Granger Causality Score from (4) between database throughput metrics and feature-store service latency at t + 3 minutes, nine minutes before conventional detection, and automatically issued a Kubernetes Horizontal Pod Autoscaler directive to expand the connection pool. This pre-emptive action prevented incident propagation to the ML inference services and API gateway, directly producing the 35% improvement in incident response time and the 40% reduction in MTTR reported in Table 1.
The false-positive alert rate reduction from 18% to 7% reflects the GCS threshold condition from (4): alerts are generated only when a metric anomaly traverses at least one statistically significant causal edge (F-test, α = 0.05; GCS > 0.35). This constraint suppresses the transient metric spikes that account for the majority of spurious alerts observed during the peak-traffic ramp phase in the baseline condition.
-
4. Discussion
-
4.1. Comparison with Related Work
-
-
4.2. Generalisability and Limitations
The improvements reported in Table 1 are consistent with and extend findings in the recent literature. Han et al. [4] reported approximately 80% root-cause accuracy in cloud-native fault scenarios using holistic observability-driven analysis; the 88% achieved by the present framework is attributed primarily to the frequency-domain extension (5), which surfaces periodic failure signatures beyond the resolution of purely time-domain approaches. Allam [5] reported MTTR improvements of approximately 30% for serverless architectures through SRE-driven observability, consistent with the lower bound of the 40% improvement achieved here. Anderson et al. [10] documented database-layer reliability best practices that independently corroborate the fault-injection findings of Section 3.3.
The primary differentiation of the present framework from prior work [1,2,4] is its in-band proactive posture. Prior approaches trigger causal analysis reactively after an incident is recorded. The proposed framework performs continuous causal graph updates at every 30-second scrape epoch, reducing detection latency to the fundamental limit imposed by the telemetry sampling rate. This design choice is the proximate cause of the nine-minute EDLT advantage formalised in (7).
The case study was conducted on a single application in a dual-provider Kubernetes environment. The following limitations constrain direct generalisation:
-
• Architecture scope. The framework has not been validated on purely serverless deployments or edgecomputing environments, where telemetry cardinality and sampling constraints differ materially.
-
• Traffic profile coverage. The three load profiles tested do not encompass adversarial traffic patterns, including slowloris attacks and Byzantine failure modes, which may generate causal graph structures that confound the Granger VAR model.
-
• Lag parameter portability. The AIC-optimal lag values p = 4 and q = 3 are calibrated for the 30-second scrape interval and seven-service topology. Deployments with different service meshes or sampling rates require independent AIC recalibration via (3).
-
• Cluster scale. The six-node cluster represents small-to-medium deployments. At scales exceeding 100 nodes, the causal dependency graph has O(n squared) candidate edges, requiring a distributed causal engine architecture.
-
• Single application domain. The AI recommendation workload exhibits distinct temporal patterns including batch inference cycles and feature refresh bursts that may not transfer to financial transaction processing, IoT telemetry, or other cloud-native workload categories.
-
4.3. Data Privacy and Regulatory Considerations
Continuous high-frequency collection of distributed traces across multi-cloud infrastructure creates data governance obligations under the General Data Protection Regulation (GDPR) and the Nigeria Data Protection Regulation (NDPR). The following controls were applied and are recommended for all production deployments:
-
• Trace data minimisation. Personal identifiers including user IDs, session tokens, and IP addresses were masked at the OpenTelemetry collector level using attribute-level redaction filters before entering the causal analysis pipeline.
-
• Data residency. All telemetry was stored in-region on the originating cloud provider. No cross-border data transfer occurred.
-
• Access control. The observability namespace was governed by Kubernetes Role-Based Access Control (RBAC) policies restricting permissions to designated SRE service accounts only.
-
• Retention schedule. Raw distributed traces were retained for 7 days; aggregated causal statistics were retained for 90 days, satisfying NDPR Article 26 data minimisation requirements.
-
4.4. Cybersecurity Implications
-
5. Conclusion and Recommendations
Organisations in regulated industries should commission a Data Protection Impact Assessment covering the realtime log collection pipeline before production rollout, in accordance with GDPR Article 35.
Security-Observability Convergence. The causal dependency graph constructed by the framework carries direct application to cybersecurity threat detection. Anomalous Granger Causality Score events on network-facing service pairs that were previously uncorrelated, for example a sudden causal coupling between an ingress controller and an internal configuration service, may indicate lateral movement by an adversary exploiting a compromised container. The mathematical infrastructure of (1) through (6), which detects operational failures, can serve as a lightweight anomaly detector for container-level security incidents with appropriate threshold recalibration.
The framework also improves incident response auditability by providing a timestamped, causally ordered record of failure propagation events satisfying logging and forensic requirements under SOC 2 Type II and ISO/IEC 27001. Future work should formally evaluate detection rates for established cloud-native attack patterns, including container escape, privilege escalation, and DNS-tunnelling-based data exfiltration, against the Granger causality alert mechanism.
This paper introduced a Causal Observability Framework that integrates dual-domain Granger causality modelling (Equations (1) through (5)) and Bayesian network propagation (6) continuously within the DevOps monitoring pipeline for cloud-native distributed systems. Controlled evaluation across a dual-provider six-node Kubernetes cluster demonstrated statistically significant improvements across all five reliability metrics (Table 1), with a quantified nine-minute early-warning advantage over conventional monitoring formalised in (7).
The mathematical contributions are: (i) a dual-domain Granger-Fourier causal tracing model capturing both temporal lag dependencies and spectral failure signatures; (ii) an F-test grounded causality procedure with AIC-based empirical lag selection and sensitivity analysis; (iii) a normalised Granger Causality Score with documented threshold calibration; (iv) Bayesian posterior inference for probabilistic downstream failure estimation; and (v) the Expected Detection Lead Time metric as a reproducible benchmark. Together these provide a mathematically complete and empirically validated foundation for proactive SRE in cloud-native distributed systems.
Future research directions include: validation across serverless and edge architectures; reinforcement-learningbased adaptive lag selection; extension of the Bayesian network to non-stationary causal structures arising from continuous deployment; formal evaluation as a cybersecurity anomaly detector against established cloud-native attack patterns; and a longitudinal multi-tenant study at cluster scales exceeding 100 nodes.
Organisations adopting this framework should prioritise telemetry data minimisation, in-region data residency, RBAC enforcement on the observability namespace, and completion of a Data Protection Impact Assessment before regulated-industry deployment. The framework's compatibility with standard Kubernetes and CI/CD tooling enables immediate deployment without significant changes to existing infrastructure.
Author Contributions Statement
Oreoluwa Omoike: Conceptualisation, mathematical modelling, methodology, software implementation, formal analysis, writing (original draft), and writing (review and editing).
The author has read and agreed to the published version of the manuscript.
Conflict of Interest Statement
The author declares no conflicts of interest.
Funding Declaration
None.
Data Availability Statement
The telemetry datasets, causal inference scripts, and AIC calibration code used in this study are available from the corresponding author upon reasonable written request.
Ethical Declarations
Not applicable. This study involved only computational experiments on system-generated telemetry data; no human subjects or animals participated in any part of the research.
Acknowledgments
None.
Declaration of Generative AI in Scholarly Writing
During the preparation of this work the authors used AI-assisted tools solely for language editing, and grammar checking. All mathematical content, figures, and scientific conclusions are entirely the original work of the authors. The authors take full responsibility for the integrity and accuracy of the published work. See:
Abbreviations
The following abbreviations are used in this manuscript:
SRE - Site Reliability Engineering
VAR - Vector Autoregression
DAG - Directed Acyclic Graph
GCS - Granger Causality Score
AIC - Akaike Information Criterion
MTTR - Mean Time to Recovery
EDLT - Expected Detection Lead Time
GDPR - General Data Protection Regulation
NDPR - Nigeria Data Protection Regulation
CI/CD - Continuous Integration / Continuous Deployment
RBAC - Role-Based Access Control
DFT - Discrete Fourier Transform
EM - Expectation-Maximisation
EKS - Elastic Kubernetes Service
GKE - Google Kubernetes Engine
