International migration in Russia’s northern regions: Spatial patterns and the role in provision of human resources

Author: Fauzer V.V., Smirnov A.V., Fauzer G.N.
Journal: Economic and Social Changes: Facts, Trends, Forecast @volnc-esc-en
Section: Social and economic development
Article in issue: 2 т.19, 2026.
Free access
For most northern and Arctic territories, international migration is the only type of population movement with a positive net migration rate, which underscores the relevance of this research. The study examines international migration flows in the regions of the Russian North during the late Soviet and contemporary periods. The object of the study is 13 regions fully included in the list of Far North territories and areas equated to them. The aim is to reveal the spatial patterns of international migration in the northern regions of Russia and to assess its role in providing them with labor resources for the economy. The methodological framework includes the use of official migration statistics, census data, and scientific network methods to analyze data network structures. A network approach is applied to analyze the largest international migration flows. It is shown how migration trajectories have shifted during the transition from the development of the North in the late Soviet period to the contemporary system of international labor migration, with the Urals North and Central Asian countries playing an increasing role in migration exchange. Migration hubs and territorial clusters within migration networks are identified. The classification of migration flows allowed identifying groups of countries which have social, economic, cultural relations with the regions of the Russian North. The study highlights the special role of the Sakhalin Region and the Republic of Karelia as northern regions with the largest migration exchange with non-CIS countries. The importance of the Arkhangelsk Region in international educational migration is also noted. The study confirms the effectiveness of the network approach in analyzing international migration flows. The findings can contribute to further research on international migration and to the formulation of strategic documents for the development of the North of Russia.
International migration, migration flows, network analysis, Russian North
Short address: https://sciup.org/147253866
IDR: 147253866 | UDC: 314.74(470.1/.2+571) | DOI: 10.15838/esc.2026.2.104.7
Text of the scientific article International migration in Russia’s northern regions: Spatial patterns and the role in provision of human resources
This work was supported by the grant of Russian Science Foundation No. 25-28-00482 project/25-28-00482/).
According to UN estimates, the number of international migrants exceeded 304 million (3.7% of the world population) by mid-2024, compared to 221 million in 2010 and 154 million in 1990. This is a 74% increase since the beginning of the century and nearly a 2-fold increase (98%) since 1990. The share of international migrants living in the USA was 17.2% in 2024. Germany ranked second with a share 3.1 times smaller (5.5%). Russia ranked tenth (2.5%) but this figure can be underestimated1. The sharp drop in the number of international migrants in Russia according to the 2024 UN estimates – from 11.2 million in 2010 to 9.1 million in 2015 and 7.3 million in 2020 – is rather difficult to interpret. The increase to 7.6 million in 2024 is likely to have its roots in forced migration from Ukraine, but its estimate also raises many questions2.
International migration issues are reflected in the UN Resolution “Transforming Our World: The 2030 Agenda for Sustainable Development”. Goal 10 underscores that reduction of inequality within and among countries implies orderly, safe, regular and responsible migration and enhanced representation for developing countries in decisionmaking in global international economic and financial institutions3. Other 16 goals are also linked to migration and include eradication of human trafficking, reduction of transaction costs of migrant remittances, promotion of student mobility, etc. (Fauzer et al., 2018, pp. 31–37).
International migration has always fascinated Russian researchers. During the Soviet period, such work was hindered by the lack of open data. In the post-Soviet period, studies have focused on assessing the scale of migration flows and their impact on regional labor markets, as well as on changing attitudes toward migrants in both host and sending communities (Metelev, 2017).
International migration is a coin with two sides: host communities seek skilled personnel culturally and religiously close to the local population; sending communities pursue several goals: reduction of youth unemployment, increase in the income of families receiving remittances, and establishment of “ethnic enclaves” in host countries – “Chinatowns” of their own – to further their “migratory and cultural expansion”.
Remittances between countries are very significant for international migration. In 2023, such transfers reached 656 billion dollars in total, with India being the largest recipient. The economies of many former Soviet republics depend on remittances from migrant workers. For instance, according to Central Bank data4, total amount of remittances from Russia to Kazakhstan in 2024 was 132.8 million dollars, a 44% decrease compared to 2023. However, Russia remains the leading country in terms of money sent to Kazakhstan. In 2024 541.2 million dollars was sent from Russia to Georgia, 65% less than the 1.5 billion dollars sent in 2023. Still, Russia is in the top three countries for remittances to Georgia, it is behind only the USA and Italy. The volume of transfers from Russia to Armenia for the first 11 months of 2024 decreased by 13%: 3.2 billion dollars in January– November 2024 compared to 3.6 billion dollars in January–November 2023. Russia is the primary source of remittances to Armenia. The Central Bank of Azerbaijan has published statistics only for the first nine months of 2024. The volume of transfers from Russia to Azerbaijan in January– September 2024 halved to 410.7 million dollars. Even so, Russia remains the main source of remittances to this country as well. An exception among nearby countries is Kyrgyzstan, where the volume of remittances increased by 12% over the year, reaching about 2.6 billion dollars. Unlike the countries mentioned above, Kyrgyzstan has a significant number of labor migrants in Russia. Remittances from Russia account for virtually all of the country’s international transfers.
The study of migration in the North of Russia is especially relevant due to the structure of its economy and demographic trends. The Far North and equivalent areas cover almost 70% of Russia’s territories. Mining is the key sector of the economy in the North of Russia. In a number of regions, it accounts for more than half of the value added: Nenets Autonomous Area (83.7%), Khanty-Mansi Autonomous Area (78.8%), Yamal-Nenets Autonomous Area (69.4%), Sakhalin Region (60.5%), Republic of Sakha (57.7%), Magadan Region (55.2%). The indicator of the Komi Republic (47.0%) and the Chukotka Autonomous Area (37.0%) is slightly lower. The Arkhangelsk and Murmansk regions have more diversity: manufacturing industries are developed there (more than 20% of the added value), including shipbuilding and ship repair. Fishing and aquaculture are the most important economic sectors in the Kamchatka Territory. There are no predominant industries in Karelia and Tyva, and the share of the social sphere is high. A significant proportion of oil, gas, coking coal, diamonds, non-ferrous metals, and apatite concentrate are produced in the North. Due to this, the share of the Russian North regions in federal budget tax revenues is 32.3%, although only 5.1% of the country’s population lives in them.
The North is mosaic in terms of social development and quality of life. Thus, the regions of Western Siberia specializing in oil and gas production show high values in almost all indicators. At the same time, the Republic of Tyva and the Chukotka Autonomous Area are among the least prosperous. Demographically, the northern regions are characterized by a slightly higher birth rate due to the residence of a number of indigenous peoples in the North, shorter life expectancy and the highest migration outflow. From 2010 to 2025 alone, the North lost 8% of its population, and in some regions significantly more: Komi Republic – 20.7%, Republic of Karelia and Arkhangelsk Region – 19.4% each, Murmansk Region – 18.1%. In the vast majority of northern municipalities (205 out of 294), intraregional and interregional decline is observed simultaneously. In this regard, international migration, along with rotational employment, has become one of the tools for attracting workforce to labor-scarce territories, which are of great importance for economic development and the realization of Russia’s geopolitical potential. It is necessary to assess the scale, trajectories, and characteristics of international migration.
The article aims to reveal the spatial patterns of international migration in the northern regions of Russia and assess its role in providing labor resources for the economy. We address the following tasks: examine the migration exchange between Russia, the Russian North, and foreign countries using official statistics, as well as traditional and network analysis; identify spatial patterns of international migration; assess the migration turnover between Russia’s northern regions and foreign countries. The time frame of the study covers two periods – the late Soviet and the contemporary. The object of the study is 13 constituent entities of the Russian North that are fully included in the list of Far North territories and areas equated to them5. Municipal-level data are analyzed across all territories on the list. The subject of the study is international migration in Russia and its northern regions.
Interest in international migration to Russia’s northern regions stems from the fact that their territory covers almost 70% of the country’s area. Due to large-scale natural resource extraction, the economy of the northern regions accounts for 32.3% of tax payments and contributions to the federal budget6. Meanwhile, the population of the Russian North7 decreased from 12 807 752 to 9 350 079 in 1989–2024, a loss is 3 457 673 people (Fauzer, 2025, pp. 35–36). Other Russian regions cannot fully compensate for these losses, which underscores the importance of studying international migration.
The theoretical significance of the study lies in the fact that international migration in the North is often selective, temporary, and specialized. Therefore, a detailed analysis of migration trajectories allows us not only to understand the geography of migrants and their routes, but also to identify stable connections between countries and regions, as well as to assess the significance of international migration for northern societies and labor markets. The results of the study can be applied in the development of demographic forecasts, spatial development planning, and social infrastructure management.
Literature review
International migration is as popular as internal migration among scholars. Classical works on migration stem from the foreign research and begin with the founder of migration theory E.G. Ravenstein who formulated 11 laws of migration, many of which are still valid today (Ravenstein, 1885). He argued that migration has mainly economic roots. E. Lee’s model has also been highly influential, positing that within each territory there are factors which hold people, attract or repel them, determining areas of origin and destination (Lee, 1966). Western sociologists W. Thomas and F. Znaniecki made a significant contribution to the study of international migration with their five-volume work “The Polish Peasant in Europe and America” analyzing the consequences of migration processes and migrant adaptation using qualitative methods (Thomas, Znaniecki, 1958).
M.S. Blinova’s monograph provides a detailed analysis of sociological theories of migration, both Russian and foreign, including those of international migration (Blinova, 2009). V. Piche’s publication on migration theories in contemporary foreign literature is also noteworthy (Piche, 2015). In the context of this study, the network theory of migration within R. Jenissen’s model is particularly relevant, according to which migration networks are, on the one hand, a result of migration, and on the other, act as a mechanism for a further increase in the number of migrants within the same flows (Jenissen, 2004).
Among Russian scholars, L.L. Rybakovskiy provides a comprehensive overview of global migrations and their history in his monograph “World Migrations: Historical Fragments and Their Determinants”. Considering the development of global migrations, the author identifies three historical eras, the first of which covers the period from the appearance of humans on Earth up to the beginning of the Age of Discovery. The second and third eras cover approximately 1.5 millennia, with almost 14 centuries belonging to the second era and approximately the last 100 years to the third (Rybakovskiy, 2016, pp. 5–7).
V.A. Iontsev’s work “International Migration: Theory and History of Studies” can be considered a classic publication on international migration. It examines contemporary theoretical directions in explaining international migration, provides a classification of major scientific approaches to its study, identifies key migration concepts and definitions, and highlights historical and contemporary features of international migration in Russia (Iontsev, 1999).
Notable monographs and articles by S.V. Ryazantsev on labor migration cover virtually all countries of the world. In his monograph “Labor Migration in the CIS and Baltic Countries” the author discusses terminology and classification issues of labor migration, factors and dynamics of labor migration to and from the CIS and Baltic countries, and the impact of labor migration on the demographic, socio-economic, and political development of these countries (Ryazantsev, 2007). In another work, he examines objective (ecological and geographical, ethnic, military and political, economic, social, demographic) and subjective (eco-psychological, ethno-psychological, political-psychological, socio-psychological, demographic-psychological) factors of migration (Ryazantsev, 2001, pp. 21–22).
I.P. Tsapenko’s work explores the causes and contemporary features of migration to developed countries, the impact of international migration on host societies, and the mechanisms for managing migration processes. The author shows how international migration affects ethnic entrepreneurship, how interethnic tensions grow, and discusses in detail the conditions for integrating migrants into host communities (Tsapenko, 2009).
In a collective monograph (V.I. Mukomel, K.S. Grigor’eva, G.A. Monusova, G.S. Smidovich, A.Yu. Tolmacheva, O.S. Chudinovskikh, A.A. Endryushko), researchers focus on issues such as integration indicators, attitudes toward migrants in Russian society, migrant employment in the Russian labor market, working conditions of migrants in Russia, labor mobility of migrants, values of migrants and the host population, etc. (Mukomel et al., 2022).
Hundreds of articles have been written on international migration, many published in the specialized journal “World Economy and International Relations”, a leader in international topics. At Lomonosov Moscow State University, a series titled “International Migration: Russia and the Modern World” has been published since 1998 and edited by Professor V.A. Iontsev. The following review will be limited to articles relevant to the research topic.
O.V. Neterebskiy writes about the role of international migration, noting that it infuses “new blood”, is beneficial in terms of introducing new experience and knowledge, prevents the indigenous population from becoming complacent, and fosters competition in the labor market (Neterebskiy, 2016, p. 231).
L.L. Rybakovskiy and O.L. Rybakovskiy note that labor immigrants in Russia predominantly occupy niches in the economy where wages are the lowest, jobs in these “niches” are not prestigious for the country’s citizens, and do not require any significant skills from the workforce. These are primarily trade, construction, agriculture, and municipal services (Rybakovskiy, Rybakovskiy, 2016, p. 208). A.V. Topilin explains that increasing inequality (economic, social, political, demographic) and globalization are two mainsprings determining the nature and scale of migration processes in the modern world (Topilin, 2016, p. 44).
We concur with I.V. Ivakhnyuk’ s assertion: “Labor migration cannot be interpreted solely as a desperate flight from poverty... people choose migration not only as a survival strategy but also as a development strategy. And this development does occur – through return flows of remittances, experience, ideas, and people” (Ivakhnyuk, 2015, p. 44).
International migration in the Russian North is relatively understudied compared to internal migration, but there are some individual works. An article by V.V. Fauzer and colleagues provides data on the contribution of the most numerous nationalities of Russia and foreign countries to the population composition of the Russian North. It is noted that the Russian labor market is attractive for people from Central Asia and the South Caucasus. It shows that, except for the Republic of Belarus, northern regions have a positive net migration with former Soviet republics (Fauzer et al., 2017, p. 38). The impact of the COVID-19 pandemic on international migration in the Arctic regions of Russia has been studied (Smirnov, Lytkina, 2022).
The migration of Russia Germans, who made an invaluable contribution to the development of the North and Siberia, is of particular interest. They were among the top ten largest nations in Russia until 1989. They ranked 7th in 1926–1939, 9th in 1959–1989, then became 23rd by 2010, and 28th by 2021. The maximum number of Russia Germans was in 1939 – 862 504; the minimum was in 2021 – 195 256. Their population decreased by 667 248 mainly due to emigration, as well as assimilation (Fauzer, 2019).
A systematic review of international migration across different world regions is provided in the monograph “The Age of Migration” (Haas et al., 2020). International migration in Northern Europe, including issues of migrant integration, has been systematically studied by the international research institute Nordregio. There is an analysis of international migration indicators at the municipal level in the report “State of the Nordic Region 2022” (Heleniak, Jokinen, 2022). Case studies of
Northern Canada show how the global labor market influences northern communities through migration (Amati et al., 2015) and discuss the channels and mechanisms for attracting migrants (Xhardez, Tanguay, 2024). International migration in the North on a global scale is discussed in the Arctic human development reports for 2004 and 2014, as well as in the Atlas of population, society and economy in the Arctic8.
At the end of the literature review, we highlight three aspects of international migration that have not been sufficiently addressed in previous works. The first one is migration trajectories reflecting existing socio-economic and cultural relations between the northern regions of Russia and the countries of the world. The second aspect is the age-sex patterns of migration showing how the propensity to move changes at different stages of life. The third aspect is the results of international migration exchange at the municipal level, reflecting local characteristics of northern territories. Addressing these issues requires a detailed (down to the level of individual settlements) and extensive (covering all northern regions) analysis of migration statistics.
Methods and data
The analysis of international migration in northern regions requires making some assumptions. The former Soviet republics were part of the USSR, and population exchange with them was considered internal migration; from the early 1990s, such migrations became international. Consequently, migration exchange with these countries should be divided into two periods: Soviet and post-Soviet. Migration exchange with non-CIS countries can be analyzed using continuous time series or the same periods as for CIS and Baltic countries. There has always been criticism that migration flow records are incomplete and sometimes unreliable. To answer this, we cite Professor L.L. Rybakovskiy: “... our requirement for the numbers is not so much their accuracy as their magnitude, which allows identifying trends and features of migration processes...” (Rybakovskiy, 2016, p. 6).
The Soviet Union’s international migration was limited, especially with non-socialist countries; therefore, the data on such migrants, even if recorded, were not intended for open publication. However, population censuses included foreign citizens in data on the national composition of the country. For instance, the 1926 census recorded 157 foreign citizens in the Arkhangelsk Governorate, 398 in the Karelian ASSR, 148 in the Murmansk Governorate, 3,614 in the Yakut ASSR, 233 in the Kamchatka Okrug, and 1,190 in the Sakhalin Okrug, the total number for these territories being 5,740, or 0.54% of the population9.
In this work we used network analysis developed for studying any data with network structure to examine the aggregate of international migration flows. Within the framework of the network approach (or network science) flows are represented as directed graphs where the weights correspond to the number of movements between nodes (countries or regions). The network approach allows viewing the aggregate of flows, assessing the characteristics of flows, nodes, and the entire network (Smirnov, 2025). It provides an opportunity to cover migration networks consisting of many thousands of flows. The application of this approach is becoming more relevant due to the development of big data analysis tools and the emergence of new extensive sources of information about migration movements in the digital environment. Network analysis is well-suited for combining with more traditional demographic methods and indicators, such as spatial analysis and migration intensity coefficients.
The network approach allows describing the structure of migration space, identifying central and peripheral nodes in the migration network, and finding stable migration corridors and clusters. It also aligns with the concept of social capital accumulation through migration, where flows are supported by social networks formed through earlier migrations of friends, relatives, and diasporas. The network approach provides a language and tools for analyzing these self-sustaining mechanisms of migration.
Calculation algorithms were implemented in the Python and Julia programming languages using the NetworkX and Graphs.jl packages. The key migration flows were identified in each network and grouped according to spatial principles. Migration hubs were identified using the PageRank algorithm. It measures the “importance” of nodes in directed networks and considers not only the number and magnitude of edges directed toward a node, but also the importance of the nodes which produce these edges (Page et al., 1998). The graph was drawn using a modified force-directed placement of nodes which minimizes the number of edge crossings and places nodes connected by an edge near each other (Fruchterman, Reingold, 1991). Chord diagrams were created using the chorddiag package in the R programming language (Abel, Cohen, 2019).
Data sources included the results of the 1989 All-Union Population Census and current records from the Unified Interdepartmental Information and Statistical System (EMISS) for 2015–2023. In the case of census data, the exact timing of a move (or even several intermediate moves) is unknown, and it is assumed that residents migrated throughout their lives. For comparability with contemporary data, migration between northern territories and regions of the union republics (excluding the RSFSR) is considered international, although it was internal in the Soviet Union.
There are 110 nodes in the network of migration flows between northern regions and union republics constructed based on 1989 census data, including 13 northern regions and 96 regions of the union republics (with the largest share of the Ukrainian
SSR represented by 26 regions). The last node includes foreign countries and those who did not state their place of birth. The number of edges is 2481. A total of 1.9 million people moved, of which 26.8% originated from the North, and 73.2% moved to the North. This more or less corresponds to the share of movements between northern and other regions of the RSFSR. In-migration is three times larger than out-migration. The average number of movements per flow is lower than within the RSFSR (675.5 vs 2614.5). Network density is lower than in the RSFSR, and the number of directions without any movements is much higher – 184.
Contemporary records, in turn, reflect migration for a period exceeding nine months. Since tables of departures and arrivals contained missing values and mutual inconsistencies, data harmonization was performed. If the number of movements was missing in one table but present in another, the value from the table without the missing entry was used. If there were values in both tables but they did not match, their mean value was calculated. This helped minimize the impact of data entry errors. The contemporary international migration network (2015–2023) consists of 182 nodes including 13 northern regions and 169 countries and territories. According to EMISS data, Russia in general had migration exchange with 235 countries and territories. This means that 66 of them did not have migration exchange with the northern regions during the study period. The network has 1644 edges. Network density is significantly lower – 0.05. The total number of movements is 626.6 thousand with 40.3% of outflows and 59.7% of inflows. The average number of movements per flow is lower than in the first network – 377 people.
Municipal-level migration data for 2015–2023 were obtained from the Rosstat database of municipal indicators.
Results
Russia’s migration exchange with foreign countries: a traditional approach. International migrations in the USSR played an insignificant role in population exchange or the formation of labor potential. There were “labor shifts” which included the construction of industrial and hydro-technical facilities in third-world countries10, and a modest contingent of the Soviet Army and Navy was stationed abroad, but these can hardly be classified as foreign migrants (although most wore civilian clothes).
In the new Russia, international migrations became commonplace and cover over 190 countries. The closest ties developed with 17 states, of which 14 provide a positive net migration, and 3 provide migration loss. Russia’s international net migration gain for the period 2015–2023 was 1 837 412 people. To understand the scale of international migration, this number equals 1.3% of Russia’s population at the beginning of 2024 (146 150.8 thousand people). Positive net migration was contributed by (%): Ukraine – 27.6, Tajikistan – 24.9, Kazakhstan – 12.7, Armenia – 7.6, Kyrgyzstan – 5.8, Azerbaijan – 4.9, Moldova – 4.6, Uzbekistan – 4.5, Belarus – 2.5, Turkmenistan – 1.4, Georgia – 1.0, Baltic countries – 0.3, other countries – 2.8. Three states showed net migration loss (%): Israel – 0.1, USA – 0.1, and Germany – 0.4.
Three countries accounting for 65.2% of the net migration gain showed unstable positive migration over different periods. For example, there was a continuous decline in positive net migration with Ukraine. Its share was (%): 43.5 in 2015– 2017, 25.5 in 2018–2020, 10.4 in 2021–2023; Kazakhstan showed a similar trend – 14.5, 14.4, and 9.1 respectively; Tajikistan, on the contrary, demonstrated a steady increase in its share of international migration – 10.2, 23.0, and 44.1 ( Tab. 1 ).
Table 1. International net migration gain (loss) of the Russian Federation, 2015–2023, people
|
Rank in exchange with Russia |
Country |
Rank in exchange with Russian North |
2015–2017 |
2018–2020 |
2021–2023 |
2015–2023 |
|
Total |
719 210 |
516 431 |
601 771 |
1 837 412 |
||
|
1 |
Ukraine |
2 |
312 641 |
131 836 |
62 318 |
506 795 |
|
2 |
Tajikistan |
1 |
73 289 |
118 822 |
265 557 |
457 668 |
|
3 |
Kazakhstan |
5 |
104 633 |
74 119 |
54 805 |
233 557 |
|
4 |
Armenia |
7 |
46 525 |
47 623 |
45 717 |
139 865 |
|
5 |
Kyrgyzstan |
3 |
40 333 |
25 485 |
40 681 |
106 499 |
|
6 |
Azerbaijan |
4 |
29 698 |
36 635 |
23 463 |
89 796 |
|
7 |
Republic of Moldova |
8 |
41 349 |
16 566 |
27 249 |
85 164 |
|
8 |
Uzbekistan |
6 |
21 171 |
30 858 |
31 193 |
83 222 |
|
9 |
Belarus |
9 |
18 806 |
12 070 |
15 002 |
45 878 |
|
10 |
Turkmenistan |
11 |
7611 |
9926 |
8278 |
25 815 |
|
11 |
Georgia |
10 |
8189 |
6140 |
4413 |
18 742 |
|
12 |
Latvia |
12 |
1522 |
763 |
1562 |
3847 |
|
13 |
Lithuania |
13 |
574 |
514 |
567 |
1655 |
|
14 |
Estonia |
14 |
376 |
-115 |
76 |
337 |
|
15 |
Israel |
16 |
-454 |
-889 |
-473 |
-1816 |
|
16 |
USA |
15 |
-1005 |
-1317 |
-683 |
-3005 |
|
17 |
Germany |
17 |
-1764 |
-5416 |
264 |
-6916 |
|
other countries and territories |
15 716 |
12 811 |
21 782 |
50 309 |
||
|
Ranked in descending order of net migration gain for 2015–2023. Compiled based on: 2015–2017 – EMISS data, 2018–2023 – Rosstat statistical bulletins “Population and Migration in the Russian Federation”. |
||||||
10 For example, the Aswan High Dam, the largest hydroelectric complex on the Nile in Aswan, Egypt, was built between 1961 and 1971 to address important economic issues: to regulate the annual Nile floods, create an efficient irrigation system, and provide the country with electricity.
The Russian North is also involved in international migration, particularly regions specializing in the oil and gas sector. The net migration gain with foreign countries was 151,579 people in 2015– 2023. This positive net migration partially offset (by 33.9%) the natural population decline in the Russian North, which from 2015 to 2023 was 447,638 people. The scale of migration is most pronounced when compared with the population of the Russian North at the beginning of 2024 – 7,441,483 people. Thus, the share of international net migration there was 2.0% over 8 years, which is 0.7 p.p. higher than in Russia in general. Considering dynamics, the share of the Russian North in Russia’s net migration gain was (%): 5.9 in 2015–2017, 8.4 in 2018–2020, 10.9 in 2021–2023.
Three countries, being the main migration donors, provided a net migration gain of 116,507 people, or 76.9% of the total gain. Notably, these countries also showed varying gains across periods. There was a continuous decline in the share of net migration with Ukraine (%): 51.6 in 2015–2017, 8.1 in 2018–2020, 4.4 in 2021–2023; Tajikistan, conversely, showed a steady increase in its share – 16.0, 35.6, and 62.3% respectively; Kyrgyzstan demonstrated an increase from 11.0% to 24.5% in the first two periods, then its share dropped to 14.8% (Tab. 2).
It should be noted that international migration is the only type of migration with a non-negative balance in the vast majority of municipalities in the North of Russia (186 out of 287 for which data are available, or 64.8%). Such municipalities are highlighted in pink in Figure 1a . Blue indicates municipalities with positive net migration for all types of migration: intra-regional, interregional, and international. There are only six such municipalities, three of them are island territories (Novaya Zemlya Urban Okrug, Severo-Kurilsky Urban Okrug, and Yuzhno-Kurilsky Urban Okrug), and the other three specialize in the extractive industry (Khanty-Mansiysk Urban Okrug, Surgut Urban Okrug, and Egvekinot Urban Okrug). The median share of international migration turnover in total migration at the municipal level is only 3.3%, but for some territories it exceeds one-third: Nogliksky
Table 2. International net migration gain (loss) of the Russian North, 2015–2023, people
|
Rank in exchange with Russian North |
Countries |
Rank in exchange with Russia |
2015–2017 |
2018–2020 |
2021–2023 |
2015–2023 |
|
Total |
42 664 |
43 455 |
65 460 |
151 579 |
||
|
1 |
Tajikistan |
2 |
6839 |
15 462 |
40 768 |
63 069 |
|
2 |
Ukraine |
1 |
21 998 |
3530 |
2869 |
28 397 |
|
3 |
Kyrgyzstan |
5 |
4708 |
10 639 |
9694 |
25 041 |
|
4 |
Azerbaijan |
6 |
2641 |
4594 |
3706 |
10 941 |
|
5 |
Kazakhstan |
3 |
2214 |
3079 |
1595 |
6888 |
|
6 |
Uzbekistan |
8 |
-958 |
3827 |
2925 |
5794 |
|
7 |
Armenia |
4 |
892 |
2475 |
2272 |
5639 |
|
8 |
Republic of Moldova |
7 |
1870 |
320 |
501 |
2691 |
|
9 |
Belarus |
9 |
1056 |
310 |
411 |
1777 |
|
10 |
Georgia |
11 |
105 |
77 |
213 |
395 |
|
11 |
Turkmenistan |
10 |
31 |
154 |
71 |
256 |
|
12 |
Latvia |
12 |
15 |
8 |
31 |
54 |
|
13 |
Lithuania |
13 |
-2 |
10 |
21 |
29 |
|
14 |
Estonia |
14 |
11 |
-20 |
-3 |
-12 |
|
15 |
USA |
16 |
222 |
-140 |
-142 |
-60 |
|
16 |
Israel |
15 |
-33 |
-19 |
-29 |
-81 |
|
17 |
Germany |
17 |
-137 |
-107 |
-29 |
-273 |
|
other countries and territories |
1192 |
-744 |
586 |
1034 |
||
|
Ranked in descending order of net migration gain for 2015–2023. Compiled based on: 2015–2017 – EMISS data, 2018–2023 – Rosstat statistical bulletins “Population and Migration in the Russian Federation”. |
||||||
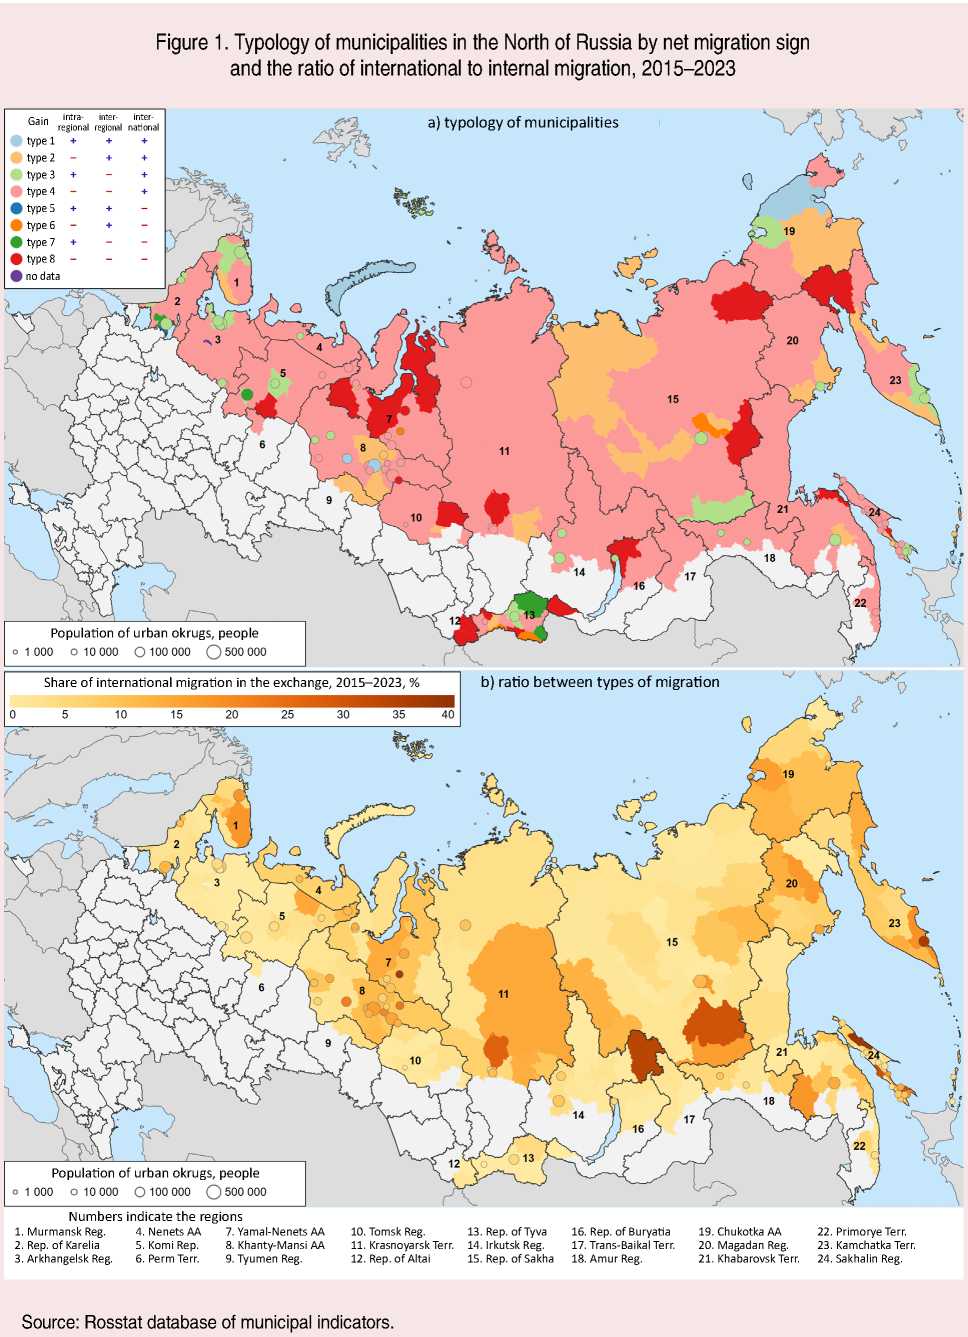
Urban Okrug (38.4%), Gubkinsky Urban Okrug (36.6%), Petropavlovsk-Kamchatsky Urban Okrug (36.1%), and Bodaybinsky District (33.7%). In ten municipalities, no international migration was recorded during the study period, seven of which are located in the Republic of Tyva ( Fig. 1b ). Municipal statistics confirm the high importance of international migration for the northern regions.
Russia’s migration exchange with foreign countries: a network approach. We will sequentially examine the largest flows based on the 1989 census data and contemporary records for 2015–2023.
During the Soviet period, the largest inflows to northern regions exceeded outflows but were smaller than flows from some regions of the RSFSR. Apart from Russian territories, the Donetsk Region of the Ukrainian SSR played the most significant role in shaping the population of the Russian North. It accounts for six out of ten flows. The largest flows were to the Khanty-Mansi Autonomous Area (28.3 thousand movements), Yakut ASSR (20.6
thousand), and Yamal-Nenets Autonomous Area (15.6 thousand). Two large flows originated from the Voroshilovgrad Region (now Lugansk People’s Republic). The Khanty-Mansi Autonomous Area also received many people from the Moldavian SSR and the Azerbaijan SSR. The average movement distance for the ten largest flows is 3400 km.
The source of the four largest outflows according to the 1989 census was the Arkhangelsk Region (excluding the Nenets Autonomous Area). The receiving regions were the Crimean, Odesa, Donetsk, and Dnipropetrovsk regions of the Ukrainian SSR. The Donetsk Region also received a large number of residents from the Magadan Region, Komi ASSR, and Sakhalin Region. Migration flows are known to generate counterflows. The Donetsk Region, being the major contributor of labor resources for the Russian North, also received return flows. The average movement distance (3450 km) exceeded only slightly the average for inflows ( Tab. 3 ).
Table 3. Largest migration flows of northern regions outside the RSFSR, 1989 census
Rank Region of departure Region of arrival Movements, units Distance, km Inflows 1 Donetsk Region Khanty-Mansi Autonomous Area 28 329 2432.3 2 Donetsk Region Yakut ASSR 20 636 5379.0 3 Donetsk Region Yamal-Nenets Autonomous Area 15 564 2630.3 4 Voroshilovgrad Region Khanty-Mansi Autonomous Area 14 035 2310.6 5 Donetsk Region Magadan Region 13 720 6337.3 6 Donetsk Region Komi ASSR 13 562 1722.6 7 Donetsk Region Murmansk Region 12 482 2335.6 8 Moldavian SSR (without Kishinev) Khanty-Mansi Autonomous Area 12 478 2962.6 9 Azerbaijan SSR (without Baku) Khanty-Mansi Autonomous Area 12 158 2623.7 10 Voroshilovgrad Region Yakut ASSR 11 319 5269.3 Outflows 1 Arkhangelsk Region Crimean Region 8 953 2207.1 2 Arkhangelsk Region Odesa Region 8 477 2089.1 3 Arkhangelsk Region Donetsk Region 7 884 1842.6 4 Arkhangelsk Region Dnipropetrovsk Region 6 265 1814.9 5 Magadan Region Donetsk Region 5 442 6337.3 6 Komi ASSR Donetsk Region 5 174 1722.6 7 Sakhalin Region Donetsk Region 5 103 6849.6 8 Murmansk Region Crimean Region 5 103 2655.6 9 Komi ASSR Dnipropetrovsk Region 4 256 1766.7 10 Sakhalin Region Crimean Region 4 114 7217.7 Ranked in descending order of number of movements. Compiled based on: Demoscope Weekly. Available at:
The largest migration hubs according to the Soviet dataset were the Khanty-Mansi Autonomous Area (PageRank score 85.8), Murmansk Region (63.6), Komi ASSR (48.9), and Yakut ASSR (45.0). Among regions outside the RSFSR, the leaders were the Donetsk Region (23.6), Crimean Region (23.4), Dnipropetrovsk Region (16.7), and Kharkiv Region (15.3).
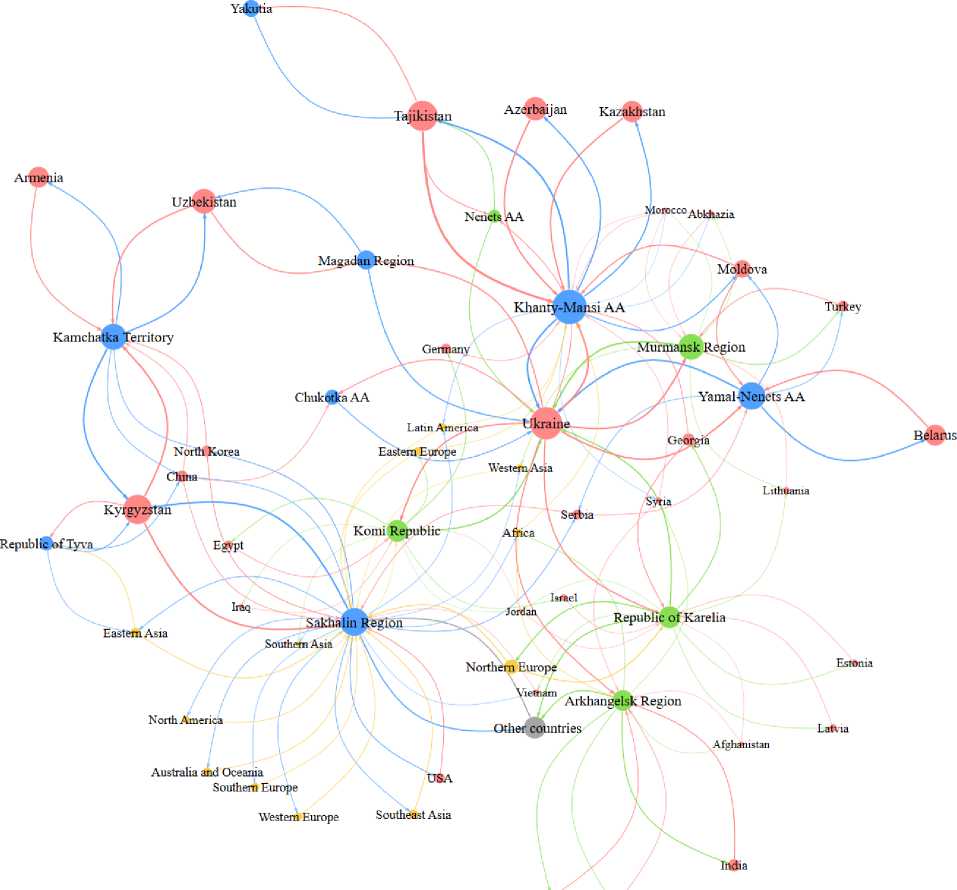
Visualization of the contemporary network of international migration flows is presented in Figure 2. It reflects the largest flows from each node, as well as all flows accounting for at least 5% of the migration exchange. The largest hubs of migration among the regions of the Russian North are the Khanty-Mansi Autonomous Area (PageRank centrality index value 95.1), Sakhalin Region (73.4),
Figure 2. Network of key international migration flows of the Russian North regions, 2015–2023
Turkmenistan. . .
Nigferia
Compiled based on: EMISS data.
Yamal-Nenets Autonomous Area (47.4), and Kamchatka Territory (42.7), while among countries the leaders are Ukraine (97.5), Kyrgyzstan (65.0), Tajikistan (52.5), and Uzbekistan (34.9).
International migration flows based on 2015– 2023 data are examined in two directions ( Tab. 4 ). The largest inflow exceeding others by a wide margin is from Tajikistan to the Khanty-Mansi Autonomous Area (64.2 thousand people). The second-largest flow is from Ukraine to the Khanty-Mansi Autonomous Area (27.1 thousand), and the third is from Kyrgyzstan to the Sakhalin Region. Unsurprisingly, five out of ten largest flows are directed to the Khanty-Mansi Autonomous Area. There are several reasons for this. First, this region is the largest in the Russian North. Second, it has significant economic influence.
The area is the major contributor to gross product and tax revenues for the federal budget. Top ten countries include only Ukraine (four times), Azerbaijan, and the Central Asian republics (Tajikistan, Kyrgyzstan, and Kazakhstan). The average movement distance is 2,857 km. This relatively small distance is explained by the proximity of the Central Asian republics to the Khanty-Mansi Autonomous Area. Outflows mirror the inflows but are smaller. The largest outflows are from the Khanty-Mansi Autonomous Area to Tajikistan (16.8 thousand) and Ukraine (16.6 thousand). The average movement distance for the ten largest outflows is 3439 km, slightly more than for inflows. The longest distance (6,181 km) has the flow from the Kamchatka Territory to Uzbekistan.
Table 4. Largest international migration flows of the Russian North regions, 2015–2023
Rank Region/country of departure Region/country of arrival Movements, units Distance, km Inflows 1 Tajikistan Khanty-Mansi Autonomous Area 64 188 2478.5 2 Ukraine Khanty-Mansi Autonomous Area 27 106 2618.5 3 Kyrgyzstan Sakhalin Region 19 428 5141.8 4 Kyrgyzstan Kamchatka Territory 15 977 5880.4 5 Ukraine Murmansk Region 15 000 2058.4 6 Ukraine Yamal-Nenets Autonomous Area 14 382 2678.1 7 Azerbaijan Khanty-Mansi Autonomous Area 11 604 2623.7 8 Kyrgyzstan Khanty-Mansi Autonomous Area 10 938 2226.9 9 Kazakhstan Khanty-Mansi Autonomous Area 9 028 1107.4 10 Ukraine Komi Republic 7 611 1757.5 Outflows 1 Khanty-Mansi Autonomous Area Tajikistan 16 809 2478.5 2 Khanty-Mansi Autonomous Area Ukraine 16 641 2618.5 3 Sakhalin Region Kyrgyzstan 15 884 5141.8 4 Kamchatka Territory Kyrgyzstan 13 432 5880.4 5 Yamal-Nenets Autonomous Area Ukraine 13 059 2678.1 6 Murmansk Region Ukraine 11 923 2058.4 7 Yamal-Nenets Autonomous Area Belarus 7 110 2501.9 8 Kamchatka Territory Uzbekistan 6 673 6181.3 9 Khanty-Mansi Autonomous Area Azerbaijan 5 954 2623.7 10 Khanty-Mansi Autonomous Area Kyrgyzstan 5 901 2226.8 Ranked in descending order of number of movements. Compiled based on: EMISS data. Available at: ;
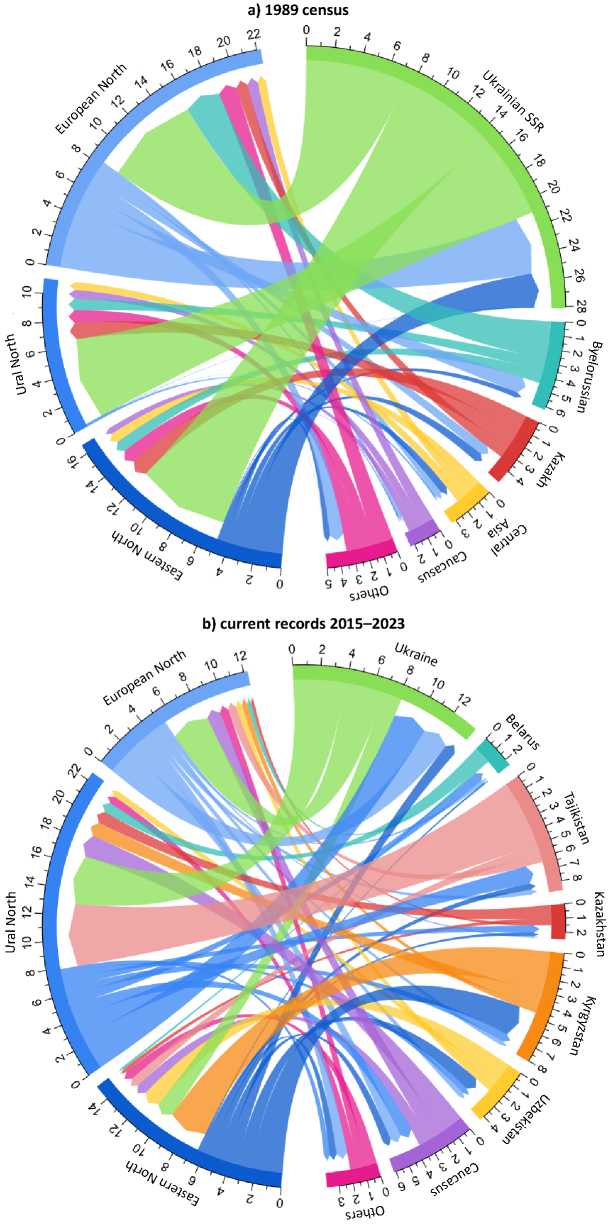
Figure 3. Grouping of international migration flows by regional clusters and countries, 1989 census and current records 2015–2023
a) 1989 census
b) current records 2015–2023
* $ v >
^°
X ® » b X
N e г уэфО
5)ЭЦ1О
Compiled based on: Demoscope Weekly, EMISS data.
To facilitate further analysis, the regions of the Russian North are grouped into clusters based on the territorial principle. Three clusters are identified: European (republics of Karelia, Komi; Nenets Autonomous Area, Arkhangelsk and Murmansk regions), Ural (Khanty-Mansi and Yamal-Nenets autonomous areas), and Eastern (republics of Tyva, Sakha (Yakutia); Kamchatka Territory; Magadan and Sakhalin regions; Chukotka Autonomous Area). The grouping of flows clearly demonstrates the huge contribution of the Ukrainian SSR to the composition of the Russian North population, which is more than that of all other union republics together. There are some spatial patterns. While people from the Ukrainian and Kazakh SSRs moved to all three clusters of northern regions, those from the Byelorussian SSR and Caucasian republics moved primarily to the European North. Figure 3 demonstrates again that inflows exceeded outflows.
In contemporary Russia, the spatial patterns of international migration have become more pronounced. Flows from Ukraine are directed to the Ural North and, to a lesser extent, the European North; from Tajikistan, Kazakhstan, and Belarus to the Ural North; from Kyrgyzstan and Uzbekistan to the Eastern North. The net international migration is positive. In terms of flow magnitude, Ukraine, Tajikistan, and Kyrgyzstan stand out. Next, we examine migration patterns at the level of individual countries ( Tab. 5 ). It shows the distribution of migration flows from a country to northern regions.
First, we will consider the countries of the near abroad. During 2015–2023, Ukraine’s inflows and outflows were primarily connected with the Khanty-Mansi Autonomous Area (28.8%), Yamal-Nenets Autonomous Area (18.2%), and Murmansk Region (17.7%). Over half of Belarus’s migration movements (51.7%) were linked to the Yamal-Nenets Autonomous Area. Over half of Tajikistan’s migration flow (68.2%) was associated with the
Khanty-Mansi Autonomous Area. Kyrgyzstan exchanged people with the Sakhalin Region (35.1%), Kamchatka Territory (29.2%), and Khanty-Mansi Autonomous Area (16.7%). Uzbekistan exchanged people mainly with the Kamchatka Territory (27.8%), Sakhalin Region (13.5%), and Khanty-Mansi Autonomous Area (13.7%). Over half of Turkmenistan’s movements (61.7%) were connected with the Arkhangelsk Region. Nearly half of Kazakhstan’s exchange (49.2%) was associated with the Khanty-Mansi Autonomous Area, and 12.6% with the Yamal-Nenets Autonomous Area.
Azerbaijan gravitates toward the Khanty-Mansi Autonomous Area (41.1%), Yamal-Nenets Autonomous Area (13.8%), and Murmansk Region (12.0%). Migration movements of Armenia are more evenly distributed: Kamchatka Territory (17.7%), Khanty-Mansi Autonomous Area (14.3%), Yamal-Nenets Autonomous Area (13.9%). Georgia’s migration exchange is more intensive with Karelia (44.4%) and Khanty-Mansi Autonomous Area (24.9%). Moldova exchanges populations mainly with the oil and gas regions: Khanty-Mansi Autonomous Area (41.7%) and Yamal-Nenets Autonomous Area (24.6%).
The Baltic countries gravitate toward the Republic of Karelia and Murmansk Region due to their spatial proximity. Karelia also accounts for 94.1% of migration movements with Finland. The Republic also leads in exchange with Israel. Norway, sharing a border with the Murmansk Region, gravitates toward it (62.0%). India exchanges most actively with the Arkhangelsk Region (84.1%), which can be attributed to Indian students (primarily in medicine) and the construction of naval ships for India in Severodvinsk. Nigeria also shows 87.2% of its movements directed to the Arkhangelsk Region.
China’s migration is significant with the Kamchatka Territory (22.7%), Sakhalin Region (23.2%), and Republic of Tyva (20.1%). Almost all
Table 5. Distribution of migration turnover of foreign countries with the Russian North regions, 2015–2023
|
Country |
z co co ОС 1 CD ^ ъ. |
Distribution of turnover between northern regions, % |
||||||||||||
|
.55 "cd cB QC |
ОС Ё ^ |
DC CD XZ |
оз CD CO CO CD CD z |
a? DC co 03 E 1 |
.55 оз xz 03 CO S’ DC |
03 S’ DC |
eg E 03 ^ |
S1 DC s 03 оз ^ |
a? DC "E XZ 03 CO |
03 CD CO CO 03 s s ^ |
03 CD CO XZ |
оз CD CO CO CD CD "E E |
||
|
All countries |
626 603 |
5 |
5 |
4 |
1 |
10 |
2 |
1 |
10 |
3 |
14 |
32 |
1 |
13 |
|
Ukraine |
151 734 |
6 |
8 |
4 |
1 |
18 |
1 |
0 |
4 |
5 |
5 |
29 |
2 |
18 |
|
Tajikistan |
118 762 |
3 |
2 |
4 |
1 |
2 |
3 |
0 |
1 |
1 |
7 |
68 |
0 |
8 |
|
Kyrgyzstan |
100 613 |
1 |
2 |
0 |
0 |
6 |
1 |
2 |
29 |
1 |
35 |
17 |
1 |
5 |
|
Uzbekistan |
51 401 |
2 |
4 |
5 |
0 |
9 |
2 |
1 |
28 |
11 |
14 |
14 |
1 |
9 |
|
Azerbaijan |
42 733 |
3 |
11 |
4 |
1 |
12 |
2 |
0 |
6 |
1 |
5 |
41 |
0 |
14 |
|
Kazakhstan |
29 065 |
3 |
3 |
1 |
0 |
8 |
1 |
0 |
5 |
5 |
8 |
49 |
2 |
13 |
|
Belarus |
27 540 |
4 |
6 |
2 |
1 |
11 |
0 |
3 |
3 |
1 |
4 |
10 |
3 |
52 |
|
Armenia |
25 855 |
7 |
6 |
3 |
0 |
13 |
5 |
1 |
18 |
2 |
16 |
14 |
1 |
14 |
|
Moldova |
13 421 |
6 |
5 |
3 |
1 |
8 |
1 |
0 |
3 |
3 |
3 |
42 |
1 |
25 |
|
Finland |
3 619 |
94 |
0 |
1 |
0 |
4 |
– |
– |
0 |
– |
– |
0 |
– |
0 |
|
India |
3 322 |
0 |
2 |
84 |
– |
1 |
0 |
– |
– |
– |
11 |
0 |
0 |
0 |
|
Georgia |
2 983 |
42 |
5 |
4 |
0 |
4 |
3 |
1 |
1 |
1 |
4 |
25 |
0 |
8 |
|
China |
2 465 |
0 |
1 |
2 |
– |
1 |
16 |
20 |
23 |
1 |
23 |
1 |
12 |
0 |
|
North Korea |
2 016 |
– |
0 |
– |
– |
– |
0 |
– |
41 |
– |
59 |
0 |
– |
– |
|
T u rkiye |
1 834 |
3 |
3 |
3 |
0 |
43 |
1 |
– |
4 |
0 |
9 |
7 |
10 |
15 |
|
USA |
1 658 |
5 |
3 |
1 |
– |
3 |
1 |
0 |
4 |
0 |
78 |
3 |
1 |
1 |
|
Germany |
1 343 |
16 |
22 |
8 |
– |
9 |
1 |
1 |
3 |
1 |
11 |
22 |
0 |
6 |
|
Turkmenistan |
1 317 |
4 |
1 |
62 |
– |
10 |
1 |
0 |
0 |
– |
7 |
14 |
– |
2 |
|
Serbia |
1 265 |
0 |
4 |
1 |
– |
4 |
– |
– |
0 |
0 |
46 |
5 |
2 |
36 |
|
United Kingdom |
1 148 |
2 |
1 |
2 |
– |
2 |
– |
– |
0 |
– |
91 |
1 |
0 |
0 |
|
Egypt |
617 |
5 |
62 |
6 |
0 |
9 |
0 |
– |
– |
0 |
8 |
7 |
– |
2 |
|
Norway |
550 |
7 |
1 |
13 |
– |
62 |
– |
– |
1 |
– |
16 |
1 |
– |
– |
|
Mongolia |
451 |
0 |
– |
– |
– |
0 |
21 |
76 |
– |
2 |
0 |
0 |
– |
– |
|
Canada |
446 |
7 |
2 |
2 |
– |
3 |
0 |
1 |
2 |
1 |
70 |
5 |
6 |
1 |
|
Latvia |
407 |
26 |
10 |
10 |
1 |
16 |
1 |
1 |
2 |
2 |
7 |
14 |
0 |
9 |
|
Philippines |
365 |
1 |
0 |
– |
– |
1 |
– |
– |
– |
– |
97 |
1 |
0 |
– |
|
Nigeria |
358 |
1 |
1 |
87 |
1 |
– |
– |
1 |
– |
– |
7 |
2 |
– |
0 |
|
South Korea |
350 |
1 |
1 |
– |
– |
1 |
– |
1 |
2 |
0 |
88 |
6 |
– |
0 |
|
The Netherlands |
326 |
4 |
2 |
3 |
– |
3 |
0 |
0 |
0 |
0 |
85 |
2 |
– |
– |
|
Israel |
312 |
24 |
15 |
8 |
– |
16 |
8 |
– |
2 |
3 |
7 |
11 |
– |
6 |
|
Other 140 countries / territories |
38 327 |
18 |
6 |
14 |
0 |
9 |
2 |
3 |
5 |
1 |
29 |
8 |
2 |
4 |
Note: “0” denotes value close to zero (less than 0.5%), “–” denotes zero value.
Ranked in descending order of migration turnover.
Compiled based on: EMISS data. Available at: ; https:/
Table 6. Distribution of migration turnover of Russian North regions with foreign countries, 2015–2023, %
Country .55 "aS CO ОС S’ ОС Ё ^ DC 00 CD S XZ оз CD CO CO CD CD S S’ DC "co 03 E 1 .55 03 JZ 03 co S’ DC 03 S’ DC CO E 03 ^ DC S co co S S’ DC "co JZ CO CO CO CD CO CO CO s ^ CO CD CO co CD CO CO CD CD S "co E All countries 32 32 26 4 61 12 6 65 19 87 197 7 80 Ukraine 29 39 21 28 44 13 1 10 42 8 22 37 34 Tajikistan 10 7 17 35 4 31 2 2 4 10 41 3 11 Kyrgyzstan 2 6 1 2 11 9 34 45 5 41 9 10 7 Uzbekistan 4 7 10 6 8 10 7 22 31 8 4 6 6 Azerbaijan 4 15 7 10 8 8 1 4 1 2 9 1 7 Kazakhstan 3 3 1 1 4 3 2 2 7 3 7 10 5 Belarus 3 5 2 9 5 1 16 1 1 1 1 11 18 Armenia 5 5 3 3 5 11 5 7 3 5 2 3 4 Moldova 2 2 1 3 2 1 0 1 2 0 3 1 4 Finland 11 0 0 0 0 – – 0 – – 0 – 0 India 0 0 11 – 0 0 – – – 0 0 0 0 Georgia 4 0 1 0 0 1 0 0 0 0 0 0 0 China 0 0 0 – 0 3 8 1 0 1 0 4 0 Turkiye 0 0 0 0 1 0 – 0 0 0 0 3 0 Turkmenistan 0 0 3 – 0 0 0 0 – 0 0 – 0 Other 155 countries and territories 23 10 22 2 7 8 23 5 2 19 2 12 3 Note: “0” denotes value close to zero (less than 0.5%), “–” denotes zero value. Compiled based on: EMISS data. Available at: ; https:/ exchange of North Korea involves the Sakhalin Region (58.9%) and Kamchatka Territory (40.8%). Turkiye tends to exchange with the Murmansk Region (43.3%), while Egypt shows strong ties with the Komi Republic (61.8% – mostly students). Mongolia exchanges populations primarily with the Republic of Tyva (76.1%) due to spatial and cultural proximity.
A number of far-abroad countries demonstrate intensive migration exchange with the Sakhalin Region, which can be linked to the implementation of international projects in the oil and gas sector. For example, Canada accounts for 69.7% of its movements with the Russian North to Sakhalin,
Australia – 71.3%, USA – 77.6%, The Netherlands – 84.7%, Japan – 84.9%, South Korea – 88.0%, United Kingdom – 90.8%, Philippines – 97.0%. Among European countries, Serbia and Germany are also noteworthy. Serbia exchanges populations with the Sakhalin Region (46.2%) and Yamal-Nenets Autonomous Area (36.0%), while Germany’s exchange is with the Khanty-Mansi Autonomous Area (22.0%) and Komi Republic (21.8%). Germans have been one of the major nationalities in the Komi Republic since the second half of the 20th century.
Next, we examine the distribution of migrants by country across the northern regions ( Tab. 6 ).
Ukraine has the largest share in migration exchange for 7 out of 13 northern regions. Exceptions are the Nenets Autonomous Area, Republic of Sakha, and Khanty-Mansi Autonomous Area, where Tajikistan leads, as well as and the Republic of Tyva, Kamchatka Territory, and Sakhalin Region, where Kyrgyzstan leads. Some unusual but intensive migration exchanges are worth noting: Karelia with Finland (10.7%), Komi with Azerbaijan (15.1%), Arkhangelsk Region with India (10.6%) and Nigeria (1.2%), Yakutia with Armenia (10.8%), Republic of Tyva with Belarus (15.6%), China (8.4%), and Mongolia (5.8%), Sakhalin Region with the USA (1.5%) and North Korea (1.4%), and Chukotka Autonomous Area with Turkiye (2.7%).
Conclusion
In the 21st century characterized by depopulation in most countries the challenge of attracting labor resources to national economies becomes acute. Russia faces a similar issue – a shortage of human resources in both old- and new-developed regions, including the Russian North and Arctic. Attracting population from other Russian regions, which are experiencing similar depopulation issues, is problematic. Remote rotation partially solves this issue but it also creates drawbacks for local communities. International migration is one of the reserves for attracting human resources. However, its volume is not comparable to the losses the Russian North has suffered. The adopted “Concept of the State Migration Policy of the Russian Federation for 2026–2030”11 was intended to change this situation. However, many experts believe that the new Concept will limit the inflow of migrants into the country12.
Despite the relatively short period, stable migration links have developed between Russia’s northern regions and the countries of the near abroad, largely because they were established during the Soviet era. Some migration flows are based on the territorial principle – cultural and social ties develop due to proximity and ease of movement between territories. Other connections are based on the sectoral aspect: for example, there are coal and oil extraction industries in both the Russian North and other post-Soviet countries (such as Azerbaijan). The findings allow better understanding the spatial mobility patterns in the Russian North and assessing the role of international migration in forming the labor resources of these northern regions.
The article addresses all the tasks set. As a result, an assessment of international migration as a source of human resources for the economy of the Russian North and Arctic is provided. The use of two approaches (traditional and network) to international migration allowed both assessing its effectiveness and studying the entire set of migration flows and their characteristics.
The inter-regional and international migration flows of the northern regions of Russia in the late Soviet period and in 2015–2023 are analyzed. The focus on the configuration and characteristics of migration networks allowed us to introduce an additional perspective into the study of international migration. An analysis of the totality of connections between the nodes made it possible to find groups of territories that are similar in terms of migration trajectories. Three migration clusters have been identified in the Russian North (European, Ural, and Eastern). When finding the main centers of gravity, both the absolute volume of migration and the “importance” of those nodes from which the population moves are taken into account, which makes the estimates more comprehensive. The largest migration hubs in each cluster and the key migration flows have been identified.
Network graphs and charts make migration processes more visible. They allow us not only to calculate how many people are moving and where, but also to see the properties of the migration network: where it is dense, where it is broken, where there are bridges between parts of the network. Visualizations of the international migration network of the Russian North regions are constructed. The influence of the Soviet republics on the composition of the Russian North population is assessed. The international migration flows between the countries and the northern regions are considered in detail.
Despite all efforts by the Russian Government to transition the national economy from the fuel and energy oriented GDP toward an alternative innovative development path, the Energy Strategy up to 2030 notes that the response to external challenges/threats is to ensure the contribution of national energy sector to increased efficiency of foreign economic activity of Russia and its better position in the global economic system13. This indicates that the extraction of energy resources located in the North and Arctic remains a top priority and will require sufficient human resources in these regions.
