Intragroup variation of the facial skeleton in 16th-19th century rural Russian populations in the worldwide context: a principal component analysis

Author: Evteev A.A., Dvurechensky O.V.
Journal: Archaeology, Ethnology & Anthropology of Eurasia @journal-aeae-en
Section: Anthropology and paleogenetics
Article in issue: 4 т.45, 2017.
Free access
Short address: https://sciup.org/145145337
IDR: 145145337 | DOI: 10.17746/1563-0110.2017.45.4.143-151
Text of the review article Intragroup variation of the facial skeleton in 16th-19th century rural Russian populations in the worldwide context: a principal component analysis
Statistical analysis. The question of which multivariate statistical method is optimal for intergroup comparisons of cranial samples has been hotly debated in the last two decades (Deryabin, 2008: 115, 212–229). However, none of the techniques designed for ordination of sample means describes the pattern of intragroup variation in the samples properly. The positions of two sample means in a plot with respect to each other (be they similar or very different) do not tell much about the distribution of individuals of both samples in morphospace, nor about to what extent these distributions overlap. For instance, there may be several individuals in a sample that, morphologically, differ substantially from the bulk of the sample (so called “mechanical admixture”). But
the presence of such individuals can barely be identified through a comparison of sample means.
Visual empirical search for “components” inside a cranial sample (typological approach) has been convincingly criticized (see (Debets, 1948; Alexeev, 2008a)), and is largely abandoned at present. But typological thinking, surprisingly, survives, and can still be found, in different forms, in craniological literature. This could arguably be explained by the unusual relationships between inter-and intragroup variation in Homo sapiens . It is well established that, at the global level, intergroup differences account only for some 20 % of total variance of most genetic markers and morphological variables in humans (Kozintsev, 2016; Lewontin, 1972; Relethford, 1994). As a result, values of intergroup genetic distances (e.g. Fst) in humans, even between the most distinct populations, are quite low compared with those in chimp subspecies and other primates (see (Weaver, 2014) and citations therein). Such a phenomenon can be explained by the uniquely rapid pace of migration and dispersal of modern H. sapiens , as well as by a decreased pressure of stabilizing selection in our species due to the development of social adaptation (Alekseeva, 1986; Miklashevskaya, Solovieva, Godina, 1988). Taken together, these factors might have led to the increased intragroup variability and long-standing persistence of diverse phenotypes in human populations. The issue of exploring intragroup variation becomes even more vivid when studying archaeological cranial samples, in which intragroup variation is not only a matter of migration and admixture. On the one hand, archaeological documentation relating to the sample might be absent, scarce or misinterpreted; on the other hand, theoretical views on classification of archaeological cultures and their dates often change. These factors directly affect the composition of the archaeological sample, which in some cases represent a mix of individuals from different groups and time periods (Alekseev, 2008a: 123–125).
Principal component analysis (PCA) is considered the method of choice for exploring intragroup variation (Deryabin, 2008: 76). In canonical discriminant analysis (CDA), the distribution of individual points around the sample mean can be also assessed, but “…the main purpose of this method is to solve the task of discrimination, and many features of the method are aimed to achieving the best possible separation of the multidimensional correlation ellipsoids that include individual observations…” (Ibid.: 212). This feature of the method is not that desirable, since the extent of the similarity between samples is not any less important than usually subtle, but exaggerated by CDA, differences between them. However, employing PCA for comparison of intragroup structure of multiple samples requires the solution of two important problems:
-
1. What is a “group” and what is the boundary between intra- and intergroup analyses (see (Alekseev, 2008a: 128–135))?
-
2. How to make the results of intragroup analyses of different samples fully comparable?
Clearly, the morphological meaning and variance of principal components are strongly dependant on the sample’s composition (Deryabin, 2008: 22). This means that the pattern of overlap between distribution plots of two given samples will depend upon how many, and which, reference samples are used in a PCA.
An answer to the first question might be found in the practice of morphometric research in zoology, wherein PCA is used in quite a flexible way in order to explore inter-individual variation in a number of populations of the same species simultaneously, or in several species simultaneously (O’Higgins, Jones, 1998; Cardini, Elton, 2008; Nanova, 2014). Such an approach has also been employed successfully for studying human and hominin cranial variation (Harvati, 2003; Roseman, Weaver, 2004; Freidline, Gunz, Hublin, 2015). The second question can be dealt with using the method developed by V.E. Deryabin for constructing typological schemes of body constitution (2008: 101).
Only mid-facial measurements were used in this study since the mid-face, according to existing views, is less susceptible to the influence of social and environmental factors and secular trends as compared to the neurocranium (Alekseeva, 1973, 1986; Beals, Smith, Dodd, 1984). While rapid changes of the shape of the latter can occur during a few generations and obstruct the comparison of diachronic samples (Debets, 1948; Godina et al., 2005), the mid-facial skeleton seems to be more stable.
Craniofacial morphology of the rural ethnic Russian population * : state of research. There have been numerous studies on the modern (17th to early 20th centuries)
population of various Russian cities published in the last two decades (see (Shirobokov, Uchaneva, 2015) and citations therein). Nevertheless, there are still only a few samples from synchronous rural cemeteries: Nikolskoye (Trofimova, 1941) and Kozino (Evteev, 2011) in the Moscow region, and from Sebezh and Staraya Ladoga from northwestern Russia (Alekseev, 2008b: 46–49). The two latter samples are, in fact, “conditionally rural” since they belong to small settlements that were considered cities at some periods of their history. The vast samples of ethnic Russians from anatomical collections in St. Petersburg, Moscow, Kazan, and Odessa described by V.P. Alekseev (Ibid.) can only very cautiously be considered representative of the rural population of Central Russia. A sample of peasants who have migrated to a large city does not necessarily represent their various rural social groups and layers equally (see (Shirobokov, Uchaneva, 2015)). Also, owing to the specifics of the class system of the Russian Empire, a substantial part of those nominal “peasants” could well have been born and raised in the city (Rubakin, 1912). Finally, it should be borne in mind that the crania published by Alekseev were aggregated into samples according to the province (gubernia) that the individuals came from (2008b: 46– 49); and so the samples cannot be used for describing morphological variation in local rural populations. Thus, the craniofacial morphology of those populations is still poorly understood.
Main theoretical views on the cranial morphology of modern ethnic Russians and the factors that have shaped it were formulated in classic works by T.A. Trofimova (1941), T.I Alekseeva (1973), and V.P. Alekseev (2008b). The results of these studies are generally in good agreement with each other, and have not been seriously questioned in recent decades. According to those views, the modern Russians display a strongly pronounced Caucasoid craniofacial morphology, and in this respect are more similar to medieval Western, rather than Eastern, Slavs (Alekseev, 2008b: 216–218). The latter, in turn, were more similar to Baltic than to the Finno-Ugrian medieval tribes of Eastern Europe (Alekseeva, 1973: 267–273). Both modern and medieval Eastern Slavs exhibit a characteristic craniofacial pattern that clearly distinguishes them from German-speaking populations (Ibid.). The anthropological type of modern Russians is quite uniform throughout their population distribution, and local variants of this type do not differ substantially from each other. These variants have been formed because of the differences in mating networks rather than because of different population origins. The Caucasoid pattern of craniofacial morphology became even more pronounced (e.g. nasal and facial protrusion increased) in Central Russia in late medieval times as compared to the earlier centuries. Meanwhile, in the northern and northwestern Russian regions, there was an opposite temporal trend.
Those changes are thought to be due to migrations, and the turnover of population.
But the results of those classic anthropological works and recent genetic studies are not in full agreement. So, the degree of genetic intergroup differentiation of ethnic Russian populations is much higher than that of European local populations (thus, they are not as “uniform”), and their gene pool contains a substantial admixture from the neighboring Finno-Ugrian populations (Balanovskaya, Balanovsky, 2007). The latest genome-wide SNP research also points to a close genetic relatedness between Russians, Finns, and Mordovians (Lazaridis et al., 2014). Contrary to the results based on uniparental markers (Balanovskaya, Balanovsky, 2007), the share of East Asian alleles in the gene pool of these peoples is substantial, as compared to other European populations (Lazaridis et al., 2014, Suppl.). In our opinion, the contradictions mentioned above could not be solved by studying sample means only, but can be addressed better through an analysis of intragroup variation. The main research questions of this study are:
-
1. How high is the level of intra- and intergroup variation in ethnic Russian rural populations as compared to other ethnic groups?
-
2. How high is the degree of admixture from Eastern European Finno-Ugrian populations in the gene pool of ethnic Russians?
-
3. Can Mongoloid (East Asian) admixture be convincingly traced in a cranial sample as the presence of a few individuals of Mongoloid craniofacial morphology, the number of which is too small to change the sample mean?
Our study was by no means intended to resolve these important and long-standing questions completely. Rather, its main purpose was to introduce the “world PCA” technique as a new method for intergroup craniological analysis and to test its effectiveness in respect to other existing techniques.
Material and methods
The “world” PCs were calculated using 14 linear measurements of the mid-face. The set includes 9 commonly used variables: simotic chord (Martin 57, Biometric school SC), simotic subtense (Biom. SS), interorbital breadth at maxillofrontale (Mart. 50), zygomaxillary chord at zygomaxillare anterior (Mart. 46, Biom. GB) and the subtense from subspinale to the zygomaxillary chord, nasal breadth (Mart. 54), orbital height (Mart. 52), zygoorbitale chord (Mart. 45(3)), the subtense from nasomaxillare to the zygoorbitale chord. Also, 5 author’s measurements were taken (see (Evteev, 2010) for a detailed description): height of the frontal process of the maxilla (number 2.5 according to
(Evteev, 2010)), cheek height (3.4 + 3.5), palate breadth (4.5), nasal aperture height (4.6), and the lateral length of the body of the maxilla (5.1). The reader can also find details of the protocol at site/worldpcaeng. The measurements employed here were previously chosen from a much more numerous set of variables on the base of the results of a correlation analysis (Evteev, 2010, 2014).
The training sample included 357 male skulls representing 27 samples from Eurasia, Africa, and America (for details see (Evteev, 2014: Tab. 1) and . As compared to this earlier publication, the number of individuals in some samples was slightly reduced, and two new samples were added: Saami (13 individuals) and Druze (18 individuals). The PC coefficients from the trainingsample analysis were further used to calculate PC scores for the individuals of the test sample that included rural Russian samples and reference data (see Table). Note that some population samples are common, at least partially, between the training and test samples. Missing variables
(not more than one or two per individual) were replaced by the mean of the respective population sample.
Notably, the sample of Napoleon’s Great Army soldiers who died in Königsberg (now Kaliningrad) during the Russian retreat is in fact a composite sample, which might include people from various European countries, mostly French, Germans, Dutch, and Italians (Khokhlov, 2014). The individual points of the skulls belonging solely to the training sample are not plotted in the graphs.
The ellipses in the graphs outline the 90 % range of empirical distributions; larger markers stand for sample means. All raw data used in this study, as well as a lot of additional illustrations and texts, can be found at
Results
Training-sample analysis. The results of this analysis are only briefly outlined here, while a more comprehensive description can be found at
Sample
|
Population |
Provenance |
Date |
Number of skulls |
Depository |
|
Ethnic Russians |
||||
|
Nikolskoye |
Moscow Region |
16th–18th cc |
17/0/2 |
RIMA |
|
Staraya Ladoga |
Leningrad Region |
17th–18th cc |
17/0/1 |
MAE |
|
Sebezh |
Pskov Region |
17th–18th cc |
34/0/3 |
MAE |
|
Kozino |
Moscow Region |
18th to early 19th cc |
63/15/12 |
RIMA |
|
Eastern Finns (Volga-Ural region) |
||||
|
Mordovians (Erzya), Novaya Pyrma |
Republic of Mordovia |
17th–18th cc |
28/0/8 |
RIMA |
|
Komi (Zyryane), Podielsk, Griva |
Komi Republic |
19th–20th cc |
28/0/7 |
MAE |
|
Western Finns |
||||
|
Karels |
Republic of Karelia |
19th–20th cc |
49/0/11 |
MAE |
|
Finns (Suomi) |
Finland, mainly Helsinki |
19th–20th cc |
20/12/4 |
RIMA, MAE |
|
Saami |
Kola Peninsula |
19th–20th cc |
25/18/10 |
MAE |
|
Baltic-speaking peoples |
||||
|
Latvians (Latgal), Ludza |
Latvia |
18th c |
22/14/3 |
RIMA |
|
Western and Northern Europe |
||||
|
Königsberg (Great Army soldiers) |
Kaliningrad |
19th c |
65/13/5 |
RIMA |
|
Norse (Oslo and Bergen) |
Norway |
19th c |
18/16/2 |
NHM |
Notes: Number of skulls – total / of which in the training sample / individuals with missing measurements (one or two) replaced by the mean of respective sample; RIMA – Anuchin Research Institute and Museum of Anthropology, Lomonosov Moscow State University (Moscow, Russia); MAE – Peter the Great Museum of Anthropology and Ethnography (Kunstkamera), Russian Academy of Sciences (St. Petersburg, Russia); NHM – Natural History Museum (London, Great Britain).
worldpcaeng. The PC1 of the analysis can definitely be considered a “Caucasoid-Mongoloid vector”: the distributions of the skulls from European and East Asian populations have almost no overlap along this PC. PC2 describes a narrowing and a decrease in protrusion of the nasal bones and nose in general, a narrowing of the nasal bridge and, to a lesser extent, of the face and piriform aperture. This PC is highly variable in both Caucasoid and Mongoloid groups. PC3 and PC4 are related to the peculiarity of Sub-Saharan Africans and the difference between Northern and Southern Caucasoid populations.
As the rural Russian samples, as well as the reference samples, are weakly differentiated along PC3 and PC4, we will only discuss the first two PCs further.
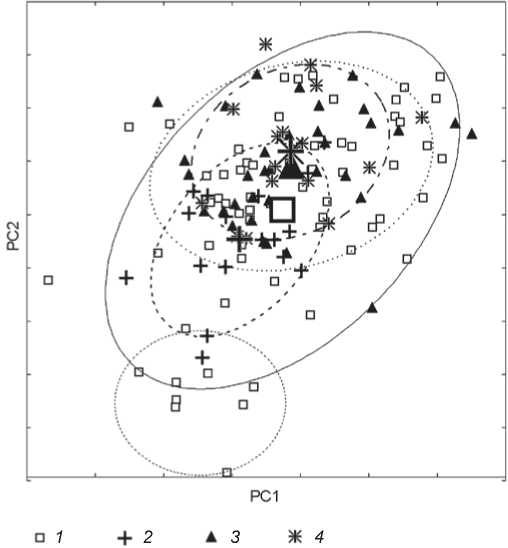
Intra- vs. intergroup variation in the rural Russian samples. The position of the mean of Kozino is apparently intermediate with respect to other sample means (Fig. 1), but in fact this sample displays the widest range of intragroup variation. The plot of individuals from Kozino fully covers the distributions of the three other Russian samples. A number of skulls in Kozino and, to a lesser extent, from Staraya Ladoga, are distinguished by having very low scores on PC2 (see above). According to the standard deviations (SD) of PC1 and PC2 (see Fig. 2; a unit was extracted from original SD values), Kozino is one of the most diverse of all samples studied: it shows a higher level of intragroup variation than even does the “international” sample from Königsberg. In contrast, the three other Russian samples are among the most homogenous. As the difference between the means of these samples is fairly strong, intergroup variation among these samples is high with respect to their intragroup variance.
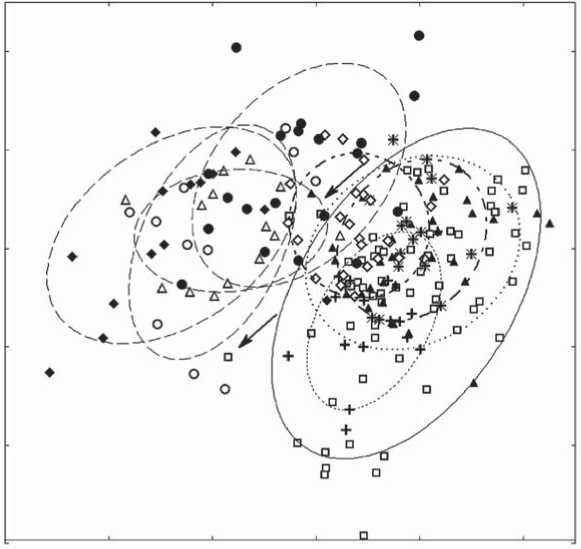
To the question regarding Mongoloid, Uralic, and Lappanoid admixture in ethnic Russians. The plot in Fig. 4 confirms the well-established opinion about the absence of any substantial East Asian admixture in the ethnic Russian population. The same applies to a possible admixture from typical representatives of Uralic anthropological variants (e.g. Khanty or Mansi). But there are single skulls in the Russian samples that are plotted quite close to the margins of the distributions of some Mongoloid or admixed populations (note arrows in the graph). Importantly, the skulls are not only close to those distributions but also notably remote from the centroids of their own samples. A similar picture is observed in some European samples, namely in Königsberg, Latvians, and Karels: some two or three skulls in each of these samples display Mongoloid features of craniofacial morphology to the same extent as the Russian individuals mentioned above.
The Saami sample shows the lowest level of intragroup variability of all populations studied, and plots very densely in morphospace of PC 1and PC2. A substantial part of this sample plots outside the range of Caucasoid groups.
Eastern Finn admixture in the Russian samples. The distribution of individuals of the Mordovian sample is notably compact: this is one of the most homogenous
РС1
A 3 Ж 4
□12
Fig. 1. Relationship between intra- and intergroup variation in the samples of ethnic Russians.
1 – Kozino; 2 – Staraya Ladoga; 3 – Sebezh; 4 – Nikolskoye.
Kozino О
0.7
Konigsberg о
Komi о

0.4
Karels о
0.1
Mordovians о
Nikolskoye
о Ladoga
о Norse
Finns о
Sebezh о
Latvians
О Saami
-0.3
0.3
0.6
Standard deviation of PC1
Fig. 2. Standard deviations of PC1 and PC2 in the samples used in
this study.
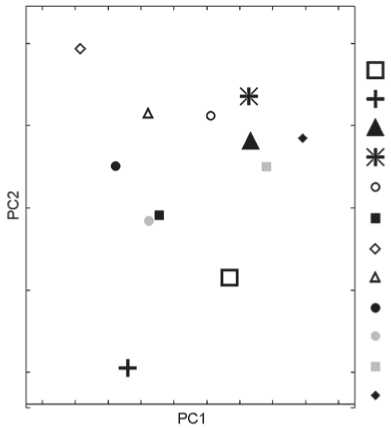
populations (Fig. 5). Unlike Saami, this distribution lies completely in the range of variation of the Russian samples. 76 % of individuals from Nikolskoye, 68 % from Sebezh, and 71 % from Staraya Ladoga plot inside the ellipse outlining 90 % of the distribution of the Mordovian sample. But despite the fact that centroid of Kozino is closer to the centroid of Mordovians than is the centroid of Staraya Ladoga, only 46 % of individuals from Kozino plot inside the ellipse (see Fig. 3). The same percentage for the European samples ranges from 42 (Königsberg) to 50 (Latvians and Norse), and to 60 (Finns and Karels). Thus, three out of four Russian samples studied are substantially more morphologically similar to the Mordvinian sample than to any of the European populations.
Russian samples and Baltic populations: Karels, Finns, and Latvians* . As both the means and the distributions of the Finns and Karels are very similar, only the latter are discussed further. All individuals from Nikolskoye and Staraya Ladoga are plotted inside the range of the Karelian sample, but occupy just a relatively small part of this range. Of the skulls from Nikolskoye, 57 % are found inside the 90 % range ellipse of Karels, while the same figure for Staraya Ladoga is only 31 %. Note
Fig. 3. Means of PC1 and PC2 in the samples used in this study. 1 – Kozino; 2 – Staraya Ladoga; 3 – Sebezh; 4 – Nikolskoye; 5 – Karels; 6 – Finns; 7 – Saami; 8 – Mordovians; 9 – Komi; 10 – Latvians; 11 – Königsberg; 12 – Norse.
that centroids of Nikolskoye and Karels lie quite close in the plot, while the mean of Staraya Ladoga is quite remote from them (Fig. 3). The similarity between Karels and Sebezh is more “genuine”, as the distributions of the two samples are almost identical.
A notable feature of the Latvian sample is the presence of several skulls displaying fairly well-defined Mongoloid morphology (low scores on PC1). In this sense, Latvians are similar to Komi, both in terms of means and distributions (see Fig. 3).
Ethnic Russian population against the background of Central and Western European craniofacial variation: preliminary results. The distribution of Königsberg completely covers those of three Russian samples but Kozino. The latter is in fact more diverse than Königsberg according to the scores of the first two PCs. The main difference between Königsberg and Kozino is the presence of several skulls with very low scores on PC2 in the latter. The distribution of the Norse lies fully inside the range of the Russian samples. Among these, Staraya Ladoga exhibits the least similarity to the Norse: distributions of the two samples overlap weakly.
и
РС1
1 □
+2
А3
*4 О 5 о 6
♦7
△ 8 е 9
*Illustrations for this and following sections can be found at https://sites.
Fig. 4. Evaluation of the proportion of Mongoloid, Uralic, and Lappanoid admixture in the ethnic Russians.
1 – Kozino; 2 – Staraya Ladoga; 3 – Sebezh; 4 – Nikolskoye; 5 – Saami; 6 – Kalmyks; 7 – Mongols; 8 – Khanty; 9 – Chinese, Koreans.
Conclusions
The distribution of the individuals from the training sample in morphospace of the “world” PCs of craniofacial measurements is perfectly consistent with the established views on the worldwide variation of cranial shape in man. Using this morphospace provides a more solid base for the assessment of the degree of intragroup variation (Fig. 2), as well as for detecting skulls of atypical morphology in cranial samples (see Fig. 1, 4, 5). For example, a quite impressive finding is that the sample from Kozino, an 18th century village near Moscow, demonstrates a higher level of intragroup variation (according to PC scores) than the sample from Königsberg, which includes people from multiple regions of several European countries. Moreover, it is more variable than the sample of Native Americans from all parts of North American continent.
Intergroup variation between the Russian samples, in respect to their intragroup variation, is prominent as well (see Fig. 1, 3). The difference between
Nikolskoye and Staraya Ladoga is almost “typological”: distributions of both samples are very compact, while the distance between their means is exceptionally great (see Fig. 1). As a result, the distributions overlap minimally. According to the position of the mean in the plot, the sample from Kozino seems to display an intermediate morphology between the two samples mentioned above. But in fact it is extremely morphologically heterogeneous (see above). Its distribution covers not only the distributions of Nikolskoye and Staraya Ladoga, but almost the whole range of variation in all Caucasoid populations. This observation might be explained by the turbulent history of this region of Central Russia in the 17th–19th centuries: village of Kozino lies very close to the road connecting Moscow with Poland through Belarus. In relation to this, it is worth recalling the peculiarity of the Russian populations assigned to the “Upper Oka” local anthropological variant, to which the region belongs (Proiskhozhdeniye…, 1965: 155). Taken together, the results of this study are in better agreement with the genetic data pointing to a high level of intergroup differentiation among local populations of ethnic Russians (Balanovskaya, Balanovsky, 2007) than with the widely accepted views on modern ethnic Russians as an anthropologically homogenous people (Alekseev, 2008b: 216–218; Alekseeva, 1973: 267–273; Proiskhozhdeniye…, 1965: 130, 163, 191).
About 3 % of the individuals from the Russian samples display unusually low scores on PC1 and thus,
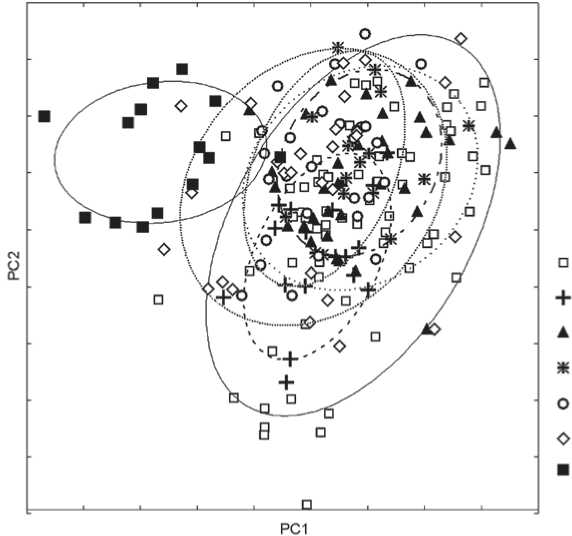
Fig. 5. Evaluation of admixture from Eastern (Volga-Ural) Finns in the ethnic Russians.
1 – Kozino; 2 – Staraya Ladoga; 3 – Sebezh; 4 – Nikolskoye; 5 – Mordovians; 6 – Komi; 7 – Khanty.
as compared to the bulk of the skulls from their samples, lie farther from their respective centroids and closer to the distributions of some Mongoloid populations (Fig. 4). But importantly, the outliers are plotted only at the margins of those distributions. This finding is in good agreement with population genetic studies that show that the frequency of Eastern Eurasian haplogroups in modern Russians is 2 % (Balanovskaya, Balanovsky, 2007); while according to genome-wide SNP data, the proportion of East Asian admixture in this group is estimated as 6 % (Lazaridis et al., 2014). A similar proportion of “Mongoloid” skulls is observed in the samples from Königsberg, Latvia, and Karelia (note that respective modern populations— Germans, Latvians, and Karels—were not studied by Lazaridis et al.). Such skulls are absent in the Norse and Finns, as well as in two out of four Russian samples. The presence of individuals displaying some Mongoloid craniofacial features is interesting, and should not be ignored; but in general, the Russians do not seem more “Mongoloid” than most European populations employed in this study.
The population means of the Russian samples are plotted closer to the means of the European groups than to centroid of the Mordovian sample (Fig. 3). But the analysis of their individual distributions has shown that in fact all Russian populations but that of Kozino are definitely more similar to the Mordovians (Fig. 5). The sample from Sebezh also exhibits a similarity to Karels, both in terms of means and distribution. The results of genetic studies showing a specific similarity of ethnic Russians to Eastern and, to some extent, Baltic Finns (Balanovskaya, Balanovsky, 2007; Lazaridis et al., 2014) are better supported by our data than the views on the Russians as “mean Europeans” (Alekseev, 2008b; Alekseeva, 1973). At the same time, the hypothesis about a “Lappanoid” component in the Russian population (see, e.g., (Trofimova, 1941)) is not supported by our results.
Notably, one of the Russian samples, the 18th century one from Kozino, shows no more similarity with the Mordovians than do the Königsberg or the Norse samples. This fits well into the conception of “caucasoidisation”* of the population of central (but not northwestern) regions of the European part of Russia in the late medieval times (Trofimova, 1941; Alekseev, 2008b: 216–218; Alekseeva, 1973: 267–273). This temporal change in craniofacial morphology, due to a hypothetical gene flow from more (south)western regions, is particularly evident when Nikolskoye (16th–18th centuries) and Kozino (18th to early 19th centuries) are compared, as the two sites are situated just few dozen kilometers from each other.
The Latvian sample employed in this study shows a morphological similarity to the Russians neither in terms of mean nor in terms of distribution of individual skulls. Rather, the pattern plotted in the graph provides yet another piece of evidence for an “attenuation of Caucasoid features” in this population (Alekseev, 2008b: 114).
The individuals of three out of four Russian samples are plotted inside the distribution of the sample from Königsberg, which suggests that the craniofacial morphology of those Russian samples varies inside the range of the European population. But the sample from Kozino is special. First, according to PC1 and PC2 scores it is more variable than Königsberg; and second, it includes a substantial number of skulls of a particular craniofacial morphology that is very rarely observed in any other sample (Fig. 1, 5: the area of high scores on PC1 and low scores on PC2). The typical features of these skulls are very large nasal bones, a very wide nasal bridge, and a wide face.
