Колебания цен на нефть и их влияние на экономический показатель устойчивого развития, представленный ВВП Ирака за период 2010–2023 гг.

Автор: Мохаммед Мадлул Ибрахим
Журнал: Informatics. Economics. Management - Информатика. Экономика. Управление.
Рубрика: Экономика и финансы
Статья в выпуске: 5 (1), 2026 года.
Бесплатный доступ
Доходы от продажи сырой нефти имеют решающее значение для финансовых ресурсов Ирака, поскольку служат основным источником финансирования проектов развития в рамках государственного бюджета страны. Цель данного исследования - определить роль нефти как ключевого элемента производства и важнейшей составляющей производственного процесса, а также проанализировать, как колебания цен на нефть влияют на ВВП, являющийся экономическим индикатором устойчивого развития. Автор использовал традиционный количественный метод для оценки влияния изменений цен на нефть на экономический показатель устойчивого развития (ВВП). Краткосрочный анализ показал положительную взаимосвязь между независимой переменной (ценой на нефть) и зависимой переменной (ВВП). Например, рост цены на нефть на одну единицу сопровождается увеличением ВВП на 10 единиц. Однако в долгосрочной перспективе наблюдается обратная зависимость между ценой на нефть и ВВП: повышение цены на нефть на одну единицу приводит к снижению ВВП на 1,8 единицы. В заключение автор рекомендует использовать нефтяные доходы более оперативно и эффективно. На протяжении длительного времени эти доходы не использовались должным образом вследствие доминирования иностранных монополистических компаний, войн, экономических санкций, а также коррупции, поражавшей Ирак. Рост цен на нефть открывает новые возможности для расширения различных форм экономического роста и увеличения объёма производства в долгосрочной перспективе.
Цены на нефть, ВВП, устойчивое развитие, Ирак, анализ временных рядов, модель ARDL.
Короткий адрес: https://sciup.org/14135116
IDR: 14135116 | DOI: 10.47813/2782-5280-2026-5-1-3038-3048
Текст статьи Колебания цен на нефть и их влияние на экономический показатель устойчивого развития, представленный ВВП Ирака за период 2010–2023 гг.
DOI:
Oil is still a highly important commodity on global markets as of 2019. The commodity is non-renewable and finite, and its price varies. The price of the commodity is determined solely by the cost of production and the supply and demand pricing mechanism. Pricing may be affected by political and economic factors. Both importing and exporting countries are impacted by these factors. As a consequence, many crises involving fluctuations in oil prices began to occur in the oil markets in early 2010. The largest oil price decline in 2014 was a momentous occasion that signaled a shift in the market. The repercussions have generated discussion about the threat that the loss of oil presents to oilexporting countries in general and Iraq in particular, given its strategic importance in the global economy. In essence, the Iraqi economy is a rentier economy that mostly relies on oil earnings to finance its own growth. The country's trade balance and other economic activity are therefore greatly impacted by oil prices, which also have an effect on the GDP, a gauge of sustainable growth. In keeping with this line of thinking, the present study quantifies and examines how fluctuations in oil prices affect Iraq's GDP, a gauge of sustainable development, using the ARDL program.
The general budget of Iraq is increasingly financed by oil income, and the fluctuations of the global oil market have an impact on the sustainability of the gross domestic product and the Iraqi economy. It is the following query that poses the study's difficulty.
How can changes in the price of oil impact Iraq's gross domestic product, which serves as an economic barometer of sustainable development?
According to the theory, Iraq's GDP, which is a measure of sustainable development, would positively correlate with changes in the price of oil globally.
The oil is the one that is used either as raw material or as a form of energy in the production process. Therefore, this study is significant. As prices fluctuate disturbances and crises to emerge. The research aims to present and analyse the most significant repercussions of oil price fluctuations on the sustainable development economic indicator, that is the gross domestic product in Iraq.
The study aims to identify the effects of oil price fluctuations on the economic indicator of sustainable development, which is the gross domestic product, and to determine the importance of oil as an important element in the production process and a major factor of production.
METHODOLOGY
The study relied on connecting the theoretical side of things by first examining the relationship between oil and the economic indicator of sustainable development, which is the gross domestic product. Next, it examined the relationship between changes in oil prices and the GDP, and finally, it used standard analysis techniques to measure the relationship between the two variables using the ARDL model.
In this study, the spatial dimension is represented by the Iraqi economy, considered as an integrated national economic system in which the oil sector is the main source of revenue and the key transmission channel through which global oil price movements affect GDP dynamics. The temporal dimension covers the period 2010–2023, which makes it possible to analyse the impact of successive oil price shocks on the path of economic growth across different phases of the oil price cycle and to capture both short-run and long-run effects. The overall research design links the theoretical discussion of the relationship between oil prices and GDP with an empirical assessment of the impact of oil price fluctuations on the sustainable development indicator represented by GDP, using an ARDL framework for quantitative estimation.
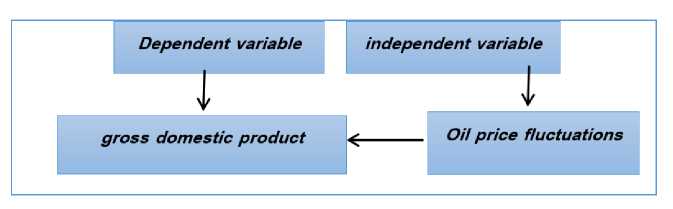
Figure 1. Hypothetical scheme of the study showing the spatial and temporal dimensions and the relationship between oil price fluctuations and Iraq’S GDP (2010–2023).
Figure 1 presents a simplified schematic independent variable (oil price fluctuations) and the representation of the study design. It shows the dependent variable (GDP as an indicator of Iraq’s sustainable development), together with the spatial dimension (the Iraqi economy) and the temporal dimension (2010–2023), and it summarizes the main stages of the analysis based on the ARDL approach.
RESULTS AND DISCUSSION
The theoretical framework of the concept of oil price and GDP
The concept of oil price is regarded as a key commodity and an important component needed for commerce and industry. This resource, known as "black gold," has been associated with modern economic history and has had the most influence on the characteristics of the world economy. The discovery of a scarce and restricted fundamental commodity that dominates whole economies is no accident. Existing economies might be effectively paralyzed and moved by a single oil shock [1]. The worth of a petroleum commodity stated in a monetary unit at a certain moment and location is known as the oil price [2]. The worth of a petroleum substance or commodity stated in cash during a certain time period and under the impact of a number of economic, social, political, and other variables is another definition of oil prices. "Sudden and unexpected changes in oil prices, sometimes so sharp that they have obvious economic effects on both producers and consumers, are referred to as oil price fluctuations. The type of these effects varies depending on the producer [3].
The monetary worth or monetary image of a barrel of crude oil, which is measured in US dollars and comprises (159) liters, expressed in US monetary units is known as the oil price. Due to the dynamic and unstable nature of the global oil market, this price is subject to constant fluctuations. This instability has been reflected in oil prices, making them unstable and subject to constant fluctuations until the phenomenon of fluctuations has become a concerning global phenomenon since the early 1970s and has continued to this day. The global financial crisis that swept the world economy had detrimental effects on the oil economy, which were evidently reflected in the international oil market in the form of a sharp decline in oil prices. These criteria lead us to the conclusion that changes in the price of oil affect both importing and exporting nations in both good and negative ways [4]. When oil prices rise, exporting nations benefit while importing nations suffer, and when prices fall, the opposite is true. Because other industries rely heavily on oil revenues for general government spending, importing countries profit from this decline due to higher real income gains, and exporting countries experience the opposite effect .
There are many reasons and variables that affect oil prices and make them subject to fluctuations. Some of these variables are economic, some are political, and others are climatic. The most important factors that affect oil prices can be summarized as follows :
-
• Economic factor . In addition to the global oil reserve, the balance between supply and demand is crucial for maintaining market stability as oil is a key commodity that plays a significant role in economic expansion. A number of variables influence the global supply and demand for oil [5].
-
• Technological development and renewable energy. Improving the pattern and methods of oil operations in their various stages, reducing costs, and increasing the efficiency of oil extraction from oil fields and reservoirs leads to a positive impact on overall prices. Oil-consuming
countries have agreed to establish the
International Renewable Energy Agency to reduce the need for crude oil, search for environmentally friendly alternatives, and confront the risks of depletion of oil and gas reserves. Among these were the use of methanol as a fuel for cars, the use of electric cars, and the use of solar energy, wind, water currents, and hot water in the earth's crust to generate electricity, in addition to nuclear energy. There is what is known as cosmic electromagnetic energy to drive car wheels without fuel, which is known as the third industrial revolution, which is still at the level of future research that has not been applied on the ground. The decline in oil prices no longer affects the process of growth and increase in renewable energies due to the continuous support of this agency [6].
-
• Political factors . The oil commodity is greatly impacted by world political events and many geopolitical threats in various regions of the world, especially in... Analysts agreed that the market fundamentals of demand, supply, and inventory levels are insufficient to explain the imbalance in price levels, especially in recent years when oil crises, geopolitical factors, and natural disasters have played a significant role in influencing oil prices, even though there was no shortage of oil supplies, which is the primary traditional factor behind any rise or fall in prices [7].
-
• Oil reserve size. Since the discovery of new and proven oil reserves that can be produced at economic costs commensurate with the level of crude oil prices existing in the oil markets impacts
the price level, the size of the oil reserve is one of the primary variables influencing oil prices [5].
-
• Climate change. Climate changes throughout the year affect the levels of demand for oil. For example, it has been observed that demand levels in consuming countries decrease during the summer due to high temperatures, while demand increases in the winter [8].
-
• US dollar exchange rate . Since there is a strong and stable correlation between the price of the dollar and the price of oil, all oil transactions are handled in US dollars, which is how crude oil is priced on international markets. The economy of producing nations will thus be impacted either negatively or favorably by the maintenance or increase of the dollar price. Crude oil prices are impacted by changes in the exchange rate because when the dollar declines, oil prices increase in dollars [6].
The theoretical framework of the gross
DOMESTIC PRODUCT
The concept of gross domestic product
The value of all market products and services generated in an economy during a given year is referred to as GDP. According to one definition, the value of all produced goods and services during a given time period is the gross domestic product, or GDP. The national economy's annual production [9]. This refers to the amount or value of products and services produced by members of a certain community during a specific time period, often a year, by residents within that nation's geographic region, irrespective of their nationality.
Because the computation is based on the country's physical area, the domestic product is thus a geographical notion [10]. According to certain interpretations, heterodox GDP is the total of the added values produced by different economic sectors (within the nation's boundaries) as a result of the contributions of both domestic and foreign production forces (Alhasnawi, 2014:190). On the other hand, it alludes to the whole output value. The national gross domestic product (GDP) is also used to determine the gross value of the whole output.
As a result, the output of a foreigner who lives on the state's territory is counted, however the production of a person who is outside the state is not [9].
The importance of GDP
GDP provides a thorough overview of the economy's condition. Policymakers and central banks may use GDP to determine whether the economy is growing or decreasing, whether it needs to be stimulated or restrained, and if risks like a recession or excessive inflation are imminent. Policymakers, economists, and businesspeople can analyze the effects of factors like monetary and fiscal policy, as well as economic shocks like rising oil prices, taxes, and spending plans, on particular subgroups and the economy overall by using national income and product accounts, which serve as the foundation for measuring GDP. Since the conclusion of World War II, national accounts have made a substantial contribution to lessening the severity of economic cycles, together with more knowledgeable institutions and policies.
Methods of calculating the gross domestic
PRODUCT
There are three main means that may be relied upon to measure the GDP of any country, which are illustrated by the following items [11].
It is measured according to the production item. It is measured according to the production items and the economic sectors that make up this country. This method ultimately relies on the general supply side of the economy. GDP is calculated according to the difference between the sum of the values of the final production of goods and services for all production units operating in the economy, and the values of the goods and services that were consumed as intermediary in the production process, so we obtain in the end what is called the value added to all economic sectors the total of which is the GDP.
Calculated according to expenditure items. It is the second indicator for calculating GDP. This method focuses on the overall demand side and includes the following items :
-
• Total domestic consumption. It consists of two parts, one is total private consumption, which represents the total expenditure on goods and services produced locally by households and public institutions for the purpose of their own consumption. The other part represents total public consumption, which is what was spent by the government to purchase goods and services that it consumes itself .
-
• Total local investment. This is represented by spending on public projects, such as spending on establishing a project to produce electricity, establishing a housing project, establishing transportation companies, or what they spend to
purchase fixed assets such as equipment used in the production process or the infrastructure for the public and private sectors .
-
• Net exports are exports of goods and services minus imports of goods and services .
-
• Calculated according to income items. The gross domestic product is calculated according to this indicator by adding up all the returns that the country obtains from the various elements of production represented by land, capital, and organization [1].
Analytical framework for oil price and
GDP
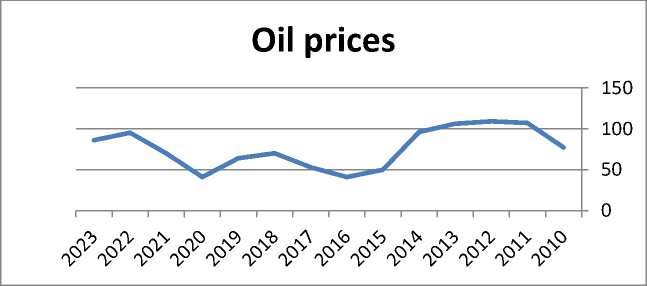
Oil prices fluctuated during the study periods due to the instability that the year was exposed to during this period. We note from Table (1) that oil prices reached (77) dollars per barrel in 2010, after which they began to rise and fall. The highest year for oil prices was recorded in 2012, when it was (109) US dollars per barrel, while the lowest year was 2016, when oil prices reached (41) US dollars, while the average for the years from 2010-2023 reached (76.07) US dollars, as in Table 1.
-
T able 1. E valuation of the reality of oil price developments for the 2010-2023 period .
|
Growth rate |
Oil prices dollar |
Years |
|
0.39 |
77 |
2010 |
|
0.02 |
107 |
2011 |
|
0.03 |
109 |
2012 |
|
-0.09 |
106 |
2013 |
|
-0.48 |
96 |
2014 |
|
-0.18 |
50 |
2015 |
|
0.29 |
41 |
2016 |
|
0.32 |
53 |
2017 |
|
-0.09 |
70 |
2018 |
|
-0.36 |
64 |
2019 |
|
0.71 |
41 |
2020 |
|
0.36 |
70 |
2021 |
|
-0.09 |
95 |
2022 |
|
-1.00 |
86 |
2023 |
|
76.07 |
Average |
|
Source: IMF data, OPEC, various editions.
As the graph (Figure 1) shows during the study period (2010-2023) the prices of oil were the highest in 2012 when they reached (109) dollars, and the reason for this is the improvement of the security situation and the political situation in the world and stability while they were the lowest in 2016 when they reached (41) dollars, which is very low because of deteriorating the security situation and economic instability in the countries as in the following graph in Figure 1.
Source: Prepared by the researcher based on data in Table 1.
Figure 1. The trend of Iraqi oil prices for the period 2010-2023.
Analysis of the reality of the gross domestic product in Iraq
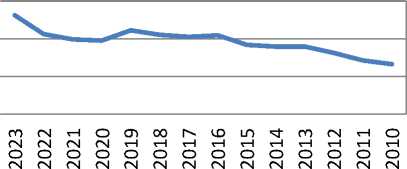
The overall GDP has grown significantly in comparison to previous years, with the exception of a few years that saw exceptional events that caused the GDP to fall. Along with the significant rise in Iraqi oil exports, opening the country's economy to the outside world with the lifting of economic sanctions contributed to GDP growth and strengthened the Iraqi dinar, which in turn raised the dinar's exchange rate against other currencies. Increases in the oil sector's value added and crude oil income as a result of higher export volumes and rising oil prices have contributed to a phased rise in GDP at different rates and helped Iraqi economic sectors achieve a kind of recovery. The GDP was worth 132,687,028.6 million dinars in 2010. The value continued to rise steadily. Due to the effects of the security situation that Iraq faced at the start of 2014 which was exemplified by the entry of terrorist groups and their control over some governorates, the sharp decline in oil prices, and consequently the deterioration of oil revenues, demand did see some growth, but this recovery was brief as it started to reverse course and enter a downward spiral once more.
With an annual growth rate of -0.01%, the GDP thereafter gradually climbed to reach to (205,130,066.9) million dinars in 2021. After it, there was a slow growth in the GDP. This resulted from the situation improving and the criminal ISIS groups being eradicated. Another factor was the deportation of Iraqi cities that had been seized. Furthermore, we saw both the rise in oil prices and the rise in oil exports. Later on, the gross domestic product reflected this. Table 2 describes the analysis of the reality of the development of the gross domestic product in Iraq for the period 2010-2023.
T able 2. D evelopment of the gross domestic product in I raq for the period 2010-2023.
|
Growth rate |
gross domestic product |
Years |
|
- |
132687028.6 |
2010 |
|
0.07 |
142700217.7 |
2011 |
|
0.13 |
162587533.1 |
2012 |
|
0.07 |
178951406.9 |
2013 |
|
0.02 |
178951406.9 |
2014 |
|
0.02 |
183616252.1 |
2015 |
|
0.13 |
208932109.7 |
2016 |
|
-0.01 |
205130066.9 |
2017 |
|
0.02 |
210532887.2 |
2018 |
|
0.05 |
222141229.7 |
2019 |
|
-0.12 |
195402549.5 |
2020 |
|
0.015 |
198496540.5 |
2021 |
|
0.07 |
212408657.3 |
2022 |
|
0.23 |
262431112.3 |
2023 |
|
192497785.6 |
Average |
|
Source: Ministry of Planning, Central Statistical
Agency, National Accounts Directorate.
According to graph (Figure 2), the GDP peaked in 2013 at 262431112.3 million dinars, the largest amount recorded throughout the 2010–2023 research period. It was at its lowest level in 2010, when it reached (132,687,028.6) million dinars, which is extremely low according to the following graph. The reasons for this are the current increase in global oil prices, the growth in exports, and the improvement in the security situation, which in turn led to an increase in oil revenues.
GDP
GDP
Source: Based on data in Table (2), this was prepared by the researcher.
-
Figure 2. The path of the GDP trend in Iraq for the period 2023.
The contribution of oil revenues to public
REVENUES AND THE GROSS DOMESTIC PRODUCT
Income from the oil industry are the main source of GDP and state income. This makes Iraq's economy what we would refer to as a quarterly economy. This sector will be impacted by any changes that occur internally or outside, and the GDP structure will be impacted in one way or another. Table 3 shows that, at constant prices, the oil industry contributed 95.2% of the Iraqi economy's gross domestic product and state revenue formation between 2010 and 2023.
Fifty-four percent of state income come from oil earnings. Up until 2014, the proportion of oil earnings to the gross domestic product kept increasing. The advent of ISIS gangs and their takeover of several major Iraqi cities, together with the decline in oil prices to $50, caused the oil income contribution to state revenues to reach 77.2% and to the GDP to reach 54.2%. Price increases Oil money now accounts for 94% of all governmental revenue. Table 3 shows that the GDP of the nation is around 76.2%.
T able 3. P rojection of the contribution of oil revenues to public revenues and GDP in I raq for the period 2010-2023.
|
Description |
Variable name |
Variable symbol |
|
The dimension is dependent |
Gross domestic product |
GDP |
|
The dimension is independent |
Oil prices |
OIL Price |
Source: Ministry of Planning, Central Statistical
Organization, Baghdad, Iraq. OPEC, various issues.
The statistical aspect of the impact of oil
PRICE FLUCTUATIONS ON THE ECONOMIC INDICATOR OF SUSTAINABLE DEVELOPMENT
Table 4 describes the study indicators. Before starting the statistical measurement, it is necessary to know the Stationarity of the time series through unit root tests.
T able 4. S tudy indicators .
|
Oil price |
Relative importance |
Gross domestic product |
Relative importance |
General revenues |
Oil revenues |
Years |
|
77 |
50.4 |
132687028.6 |
95.2 |
70178223 |
66819670 |
2010 |
|
107 |
68.7 |
142700217.7 |
98.1 |
99998776 |
98191214 |
2011 |
|
109 |
71.7 |
162587533.1 |
97.6 |
119466403 |
116597176 |
2012 |
|
106 |
63.2 |
178951406.9 |
97.3 |
113767395 |
110677542 |
2013 |
|
96 |
54.2 |
178951406.9 |
77.2 |
105386623 |
97072410 |
2014 |
|
50 |
27.9 |
183616252.1 |
81.4 |
66470252 |
51312621 |
2015 |
|
41 |
21.2 |
208932109.7 |
84.4 |
54409270 |
44267063 |
2016 |
|
53 |
31.7 |
205130066.9 |
89.7 |
77335955 |
65071929 |
2017 |
|
70 |
47.2 |
210532887.2 |
92.2 |
106569834 |
95619820 |
2018 |
|
64 |
46.8 |
222141229.7 |
86.3 |
107566995 |
99216318 |
2019 |
|
41 |
27.9 |
195402549.5 |
86.3 |
63199689 |
54448514 |
2020 |
|
70 |
47.8 |
198496540.5 |
87.3 |
109081464 |
95270298 |
2021 |
|
95 |
72.1 |
212408657.3 |
95 |
161697437 |
153623277 |
2022 |
|
86 |
76.2 |
262431112.3 |
94 |
175787564 |
165432176 |
2023 |
Source: Prepared by researchers.
Table 4 shows the Stationarity test of the time series. Therefore, we relied on the Phelps-Perron test. Only for study because of the accuracy of its results .
T able 5. P hillips -P erron test statistic results .
|
Stability test |
||||||
|
Variable |
Level |
1 st Difference |
||||
|
PP |
Sig. |
Result |
PP |
Sig. |
Result |
|
|
OIL Price |
2.9983 |
0.0015 |
stationary |
2.1009 |
0.0000 |
stationary |
|
GDP |
4.3454 |
0.0765 |
stationary |
2.6723 |
0.0000 |
stationary |
Source: Eviews.13 output
The results of the table 5 showed that the data are stationary at the level and the first difference, so the data are economically measurable .
Estimating the simple regression model to DETERMINE THE IMPACT OF OIL PRICE FLUCTUATIONS ON THE ECONOMIC INDICATOR OF SUSTAINABLE DEVELOPMENT
Based on the results from this test, the values of some of the main statistical tests can be understood as long as the data is stationary at the level and at the first difference as shown in Table 6.
T able 6 P reliminary estimation findings for the ARDL model .
|
Dependent Variable: GDP |
||||
|
R-squared |
0.97846 |
Mean dependent Var |
19304.23 |
|
|
Adjusted R-squared |
0.97758 |
SD dependent var |
272836.1 |
|
|
F-statistic |
1113.188 |
Durbin-Watson stat |
2 .195178 |
|
|
Prob(F-statistic) |
0.000000 |
|||
Source: Eviews13 outputs.
Table 6 showed the results of the R2 test of oil prices. It explained (97 %) of the change that occurs in (GDP), and the remaining percentage (12 %) is due to External variables. As for the (F) test, it shows the overall significance of the model at a probability level of less than 5%.
Table 7 shows that, by employing Bound Test, it is possible to determine whether or not these study indicators are co-integrated.
T able 7. B ound T est : R esults of L imit T est .
|
Null hypothesis: No relationship levels |
|
|
Test Statistic |
Value |
|
F-statistic |
10.9797 |
|
5% |
|
|
I(1) |
I(0) |
|
4.233 |
3.34 |
It is clear from the results in the previous table that (F) obtained from the previous test was (10.9797) which exceeds the table value (F). At a probability level of (5 %). That is, the joint integration relationship between the independent dimension of oil price fluctuations and the gross domestic product is a strong and good integration relationship, that is, the dimensions move in one direction .
The simple decline between oil prices and GDP in the short term
This test aims to show the results of the short-term simple regression between the research variables to see the size of the effect between the independent dimension and the dependent dimension. Table 8 shows the relationship.
Table 8. The simple decline between oil prices and GDP in the short term
|
Dependent Variable: D(GDP) |
||||
|
Method: ARDL |
||||
|
Variable |
Coefficient |
Std. Error |
t-Statistic |
Prob. |
|
COINTEQ* |
0.0541857 |
0.0250729 |
2.161126 |
0.0356 |
|
OIL Price |
10.078656 |
27.478867 |
3.667784 |
0.0006 |
Source: Eviews.13 outputs
The results of the simple regression showed through the previous table the presence of effect Positive between the independent dimension OIL Price GDP dimension. That is, the regression relationship is successful and positive. That's high if the OIL price increases by one unit, GDP increases by 10 times .
The simple decline between oil prices and GDP in the long run
Through this test, we know the long-run parameter estimates to show the support of the independent variable to the dependent variable. Also, it studies the type of long-run relationship as in Table 9.
Table 9. Long-term parameter estimation results.
|
Variable * |
Coefficient |
Std. Error |
t-Statistic |
Prob. |
|
OIL Price |
-1.860020 |
7.36528.4 |
-2.525388798 |
0.0147 |
|
C |
2.580178 |
4.208406 |
6.797979848 |
0.0000 |
Source: Eviews.13 outputs
The results of the simple regression showed through the previous table that there is a negative effect between the independent dimension OIL Price and the dependent dimension GDP, meaning that the regression relationship is successful and inverse, meaning that if OIL Price increases by one unit, then GDP increases. It decreases by 1.8 times
Post-tests (confirmatory)
After completing the main statistical estimations, a set of post-estimation diagnostic tests was carried out in order to verify the robustness and reliability of the obtained results. First, the serial correlation problem was examined using the Breusch–Godfrey LM test. As shown in Table 10, the probability values associated with the F-statistic and the Chi-square statistic are greater than 5%, which indicates the absence of serial correlation in the residuals and confirms that the model does not suffer from autocorrelation problems.
Table 10. Self-association.
|
LM Test |
|||
|
F-statistic |
0. 08764 |
Prob. F (2,37) |
0.6654 |
|
Obs*R-squared |
0. 08764 |
Prob. Chi-Square (2) |
0. 4432 |
Second, the heteroskedasticity problem was tested using the ARCH test. The results reported in Table 11 show that the probability values of both the F-statistic and the Chi-square statistic exceed the 5% significance level, which implies that there is no evidence of heteroskedasticity in the residuals. These post-estimation diagnostics support the validity of the estimated model and suggest that the results can be considered statistically reliable.
Table 11. heterogeneity of variance
|
ARCH |
|||
|
F-statistic |
2.0098 |
Prob. F(1,42) |
0.2253 |
|
Obs*R-squared |
2.7865 |
Prob. ChiSquare (1) |
0.2634 |
The normality problem was examined to verify whether the residuals follow a normal distribution. This was assessed using the normality test and the associated significance level, as illustrated in Figure 3. If the probability value exceeds 5%, the residuals can be considered approximately normally distributed, which supports the validity of the estimated model.
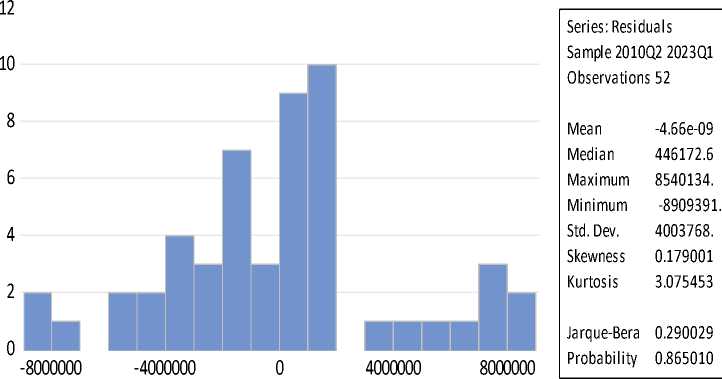
Figure 3. Normal distribution .
CONCLUSION
This study examined the impact of oil price fluctuations on the economic indicator of sustainable development represented by Iraq’s GDP over the period 2010–2023. On the basis of the applied econometric tests and models, a number of empirical findings and practical implications were obtained.
The unit root test showed that the study variables do not suffer from stationarity problems, which confirms the validity of the time-series data for econometric analysis. The adjusted R-squared statistic indicated that oil prices explain about 97% of the variation in GDP, while the remaining share is attributable to external factors that are not explicitly captured in the model. The results also revealed the presence of cointegration between the variables, which means that they move together in the long run and that a stable equilibrium relationship exists between oil prices and GDP. In the short run, the regression results indicate a positive relationship between oil prices (independent variable) and GDP (dependent variable): an increase in the oil price by one unit leads to an increase in GDP by about 10 units. In the long run, however, the regression results point to an inverse relationship, whereby a one-unit increase in oil prices leads to a decrease in GDP by about 1.8 units, reflecting potential adverse long-term effects of oil price booms on economic performance.
In light of these findings, several policy-oriented proposals can be formulated. It is necessary to invest oil wealth in existing and newly discovered fields, increase production capacity, and diversify export outlets to reduce vulnerability to disruptions and ensure continuity of production and exports. Oil revenues should be used more effectively to compensate for past periods of mismanagement associated with foreign monopolies, wars, sanctions, waste, and corruption. In addition, long-run GDP growth and higher output can be supported by making better use of periods of high oil prices, channeling windfall revenues into productive and diversification-oriented investments. This requires reliance on a well-balanced production system and efficient economic governance capable of exploiting available opportunities and mitigating the long-term risks associated with oil price volatility.
Overall, the results highlight both the strong dependence of Iraq’s GDP on oil prices and the complex nature of this relationship, underscoring the need for prudent resource management and structural policies to enhance the sustainability of economic development.
