Layers of Protection Analysis Using Possibility Theory

Author: Nouara Ouazraoui, Rachid Nait-Said, Mouloud Bourareche, Ilyes Sellami
Journal: International Journal of Intelligent Systems and Applications(IJISA) @ijisa
Article in issue: 1 vol.5, 2012.
Free access
An important issue faced by risk analysts is how to deal with uncertainties associated with accident scenarios. In industry, one often uses single values de-rived from historical data or literature to estimate events probability or their frequency. However, both dynamic environments of systems and the need to consider rare component failures may make unrealistic this kind of data. In this paper, uncertainty encountered in Layers Of Protection Analysis (LOPA) is considered in the framework of possibility theory. Data provided by reliability databases and/or experts judgments are represented by fuzzy quantities (possibilities). The fuzzy outcome frequency is calculated by extended multiplication using α-cuts method. The fuzzy outcome is compared to a scenario risk tolerance criteria and the required reduction is obtained by resolving a possibilistic decision-making problem under necessity constraint. In order to validate the proposed model, a case study concerning the protection layers of an operational heater is carried out.
LOPA, Uncertainty, Possibility Theory, Risk Reduction
Short address: https://sciup.org/15010350
IDR: 15010350
Text of the scientific article Layers of Protection Analysis Using Possibility Theory
Published Online December 2012 in MECS
The problem of reducing risks generated by process industry is a permanent concern of managers and risk experts. In petrochemical industries for instance, there is a wide range of flammable and toxic materials that have the potential to impact the health and safety of workers and the public, the assets and the environment. Therefore, reducing risks to an acceptable or tolerable level becomes an obligation imposed by social and economic considerations. This aim is usually achieved by using a combination of several safeguards including technical and organizational barriers [1,2]. Technical safety barriers include Basic Process Control Systems (BPCS), relief systems, dump systems and Safety Instrumented Systems (SIS).
Layers of Protection Analysis (LOPA), as described in the IEC 615 11 standard [3], are a semi-quantitative technique for analysing and assessing risk. It can be used at any time in the life cycle of a process or a facility, but it is most frequently used during the design stage or when modifications to an existing process or its safety systems should be performed [4]. LOPA is a special form of event tree analysis that is optimized for the purpose of determining the frequency of an unwanted consequence which can be prevented by one or more protection layers. This frequency is a risk measure for a scenario and is compared to a maximum tolerable risk in order to decide whether or not further risk mitigation is needed, according to the principle of “as low as reasonably practicable” (ALARP).
In many systems like chemical process plants, complexity of technologies and human operator tasks increases uncertainty on their behaviour. The more complex system the less precise information is available, as stated by Zadeh in [5]. Although great efforts based on good scientific knowledge and past experiences are deployed to prevent accident risks, there is still lacking and uncertain information in many parameters and models, especially in the field of rare events like technological major accidents and/or when considering dynamic environments of systems [6,7].
In conventional LOPA, numbers are usually selected to conservatively estimate failure probabilities rather than to closely represent the actual performance of safety barriers. So, the outcome frequency is intended to be conservative and the risk is overestimated with higher installation and maintenance costs [4,8]. Another alternative more reassuring and supported by certain experts of system safety, is the use of confidence intervals with lower and upper bounds to quantify failure probabilities [9-12]. Moreover, several data bases like the one of the Center for Chemical Process Safety [13], IEEE standard 500 [14], and OREDA [15] provide such intervals. Although this approach is very well suited for refining worst case analysis with the presence of less pessimistic lower boundaries, it seems that the probability intervals of certain failures are large (e.g. two magnitude orders and more) and not useful in many real world situations and should be readjusted [16]. Furthermore, as for single probabilities, there is a lack of data for rare failures. In this case, using expert judgements will be well justified and even become a data source that could not be bypassed.
Possibility theory [17,18] seems to be one of the promising frameworks for risk assessment. Fuzzy numbers and more generally fuzzy intervals might be robust representations of imprecision and uncertainty when emp irical information is very sparse [9,10, 16,19,20]. In this case, instead of failure probabilities, one can use failure possibilities, i.e. failure fuzzy probabilities, that are subjectively assigned distributions. In this paper, an approach of fuzzy LOPA is proposed in order to add more power features to the conventional method. Fuzzy models allow the analyst to assess the elements of an accident scenario and risk reduction measures in a more flexible and less constraining way. To illustrate the proposed approach, it has been applied to an operational system, which is a heater in a gas treatment process.
This paper is organized as follows. Section II addresses an overview of conventional LOPA. Section III focuses on the uncertainty problem in risk assessment. In section IV, we describe the proposed fuzzy LOPA model. Section V deals with a realistic case study, and section VI contains concluding remarks.
-
II. Conventional Layers of Protection Analysis
2.1 General Presentation -
2.2 LOPA Quantification
LOPA is a simplified risk assessment method, widely used in process industry [4]. Its primary purpose is to determine if there are sufficient layers of protection against a well-defined accident scenario, i.e. if the risk is reduced to a tolerable level. A scenario may require one or more protection layers depending on the process complexity and potential severity of a consequence. Protection layers include passive safeguards (containment, tank of retention, etc) and/or active safeguards (relief valves, SIS, etc.). LOPA is built on information provided by a qualitative hazard analysis such as process hazard analysis (PHA) and Hazards and Operability study (HAZOP).
LOPA is interested only in independent protection layers (IPL). An IPL is a device, system, or action that is capable of preventing an accident scenario independent of the initiating event or the components of any other layers of protection designed for the same scenario. The effectiveness of an IPL is quantified in terms of its probability of failure on demand (PFD)
LOPA is a semi-quantitative method. It typically uses orders of magnitude of the initiating event frequency and the PFD of IPLs to generate a risk frequency estimate of an accident scenario [8,21]. LOPA can be viewed as a variation of event tree analysis that is limited and optimized for the purpose of determining the frequency of an undesired consequence, which can be prevented by one or more protection layers . Whereas an event tree deals with all the possible consequences of an initiating event, LOPA focuses on one scenario at time, i.e. a single cause-consequence pair, which represents one path in the event tree as shown by the heavy line in Fig. 1. Thus, only harmful outcome frequency is usually ever calculated.
Layers of protection
Consequences
Success
Initiating event
IPL 1
IPL 2
1- PFD 1
IPL 3
C 1 : Safe outcome; reduction brought by IPL 1
C 2 : Safe outcome; reduction brought by IPL 2
1- PFD 2
Failure
PFD 1
PFD 2
C 3 : Safe outcome; reduction brought by IPL 3
1- PFD 3
C 4 : Unwanted consequence; failure of all IPLs
PFD 3
-
Fig.1: Example of event tree with three layers of protection
-
2.3 Using LOPA to Make Risk Decision
The outcome frequency is the initiating event frequency multiplied by the product of the IPL PFDs:
J
fC = 1 XH PFD (1)
j = 1
where f C is the frequency for consequence C for initiating event i ; f I is the in itiating event frequency for initiating event i ; PFD is the probability of failure on demand of the jth IPL that protects against consequence C for initiating event i. Equation (1) is applicable for low demand situations, i.e. f I is less than twice the test frequency for the first IPL, and assumes that all IPLs are independent. Data used in equation (1) should be representative of the industry or facility under study.
They should be used only if sufficient historical data are available over an adequate period of time [21].
LOPA is usually practiced to determine whether or not an accident scenario obeys to risk tolerance criteria. The following methods of risk judgment are used in LOPA:
-
1) The predominant one is to compare the calculated risk with predefined risk criteria. Quantitative risk criteria are preferred by some companies and may be required by law [22]. They may find simple and more convenient to have a numerical risk criterion expressed in terms of maximum tolerable frequency per scenario [4,23].
In its publication “Reducing Risks, Protecting People” [24], Health and Safety Executive in UK retained, for non-nuclear industrial plants, the individual risk criteria of 10-3 fatality/year and 10-4 fatality/year for maximum tolerable risks to workers and the public, respectively, and 10-6 fatality/year for broadly acceptable (or negligible) risk to workers and public. Apportioning plant risk criteria to individual scenarios must address a reasonable basis for assessing the contribution of individual scenarios to the risk of the whole facility. By assuming that the contributions of all scenarios are additive [4,23,25], the total individual risk may be defined as the sum of risk contributions from many scenarios (e.g. fire, explosion, toxic releases...). So, risk criterion for a single scenario can be derived as follows:
RC = C (2)
S Ns where RCs is the risk criterion for a scenario S; TRC is the total risk criterion; Ns is the number of scenarios.
Reducing the actual risk to a tolerable level is ensured by a risk reduction factor (RRF) derived from the reverse value of the PFD of an IPL. When f C exceed maximum tolerable risk frequency, noted TR, PFDPL is a variable given by:
fiC X PFDPL < TR (3)
and RRFPL can be derived as:
C
RRFp т > fi—
PL TR
The ratio f i corresponds then to Minimu m RRF re-
TR quired (MRRF) to reach TR.
-
2) Expert judgment method is needed when specific risk tolerance criteria are not available due to the novelty of process or its complexity [4]. Referring to their own experience, experts compare IPLs and other features of the scenarios to industry practice or similar processes.
-
III. Uncertainty in Process Industry
Risk assessment is a measuring process through which measurement error and uncertainty arise as a result of the limitation of the measuring tool, the measuring procedure, and the person performing the measurement. System complexity does increase behaviour uncertainty, since both theoretical and empirical models fail to take into account some relevant phenomena including their regimes, the mechanisms and the values of parameters, and may be based on a wide range of assumptions subject to uncertainty [5-7, 26]. Furthermore, operating environment of systems is constantly changing.
Historical data on failure frequency of the system and its defence are lacking. A typical example is the safety instrumented system (SIS) working in low-demand mode of operation which is the most common mode in processes. Demands to activate a safety instrumented function of the SIS are infrequent (less than once per year) and SIS components have not been operating long enough to provide reliable failure data. So, the use of historical experience is not obvious when dealing with rare failure [16,26,27].
Some assumptions are employed in setting risk scores when statistical data are unreliable or unavailable. The most known is “uncertainty increases risk”. This is a conservative approach requiring that risk should be overestimated by assuming unfavourable conditions. This approach enhances risk assessment credibility, especially for public, but it results in higher exploitation and maintenance costs.
Another approach, may be the optimal, is to deal carefully with the state of “no or bad information” by considering a range of risk scores. It seems that sufficient robustness in the outcome frequency may not be attained by using single values (often means or pessimistic values). For many systems it is often difficult to deal with initiating event frequency and IPLs PFD as exact values due to the uncertainty associated with component failure data [10]. Thus, decision making might be based on pessimistic and/or optimistic criteria according to the overall level of system safety [26].
-
IV. Fuzzy LOPA Model
-
4.1 Fuzzification
Fuzzy set theory [28] has emerged as a very appropriate tool in dealing with uncertainty in reliability and safety analysis. Several fuzzy models concerning fault tree analysis (FTA), event tree analysis (ETA), failure mode, effects and criticality analysis (FMECA), risk graph method, ... have been developed to deal with the behaviour of systems which are too complex or too ill-defined to admit of conventional quantitative techniques [9-11], [20,29]. Imperfect data are dealt with in a natural and flexible way by using fuzzy rules-based systems and/or fuzzy arithmetic.
In this context, Markowski and Mannan [12] have developed a fuzzy approach of LOPA to assess the risk of pipes. The model takes into account the outcome frequency, the consequence severity and the level of risk. The frequency is calculated using fuzzy multiplication. The severity is considered as a variable by introducing a severity reduction index derived from a fuzzy inference system. The risk level is determined from a fuzzy risk matrix as a fuzzy inference system. As an encouraging result, risk values are more accurate than those given by classical LOPA.
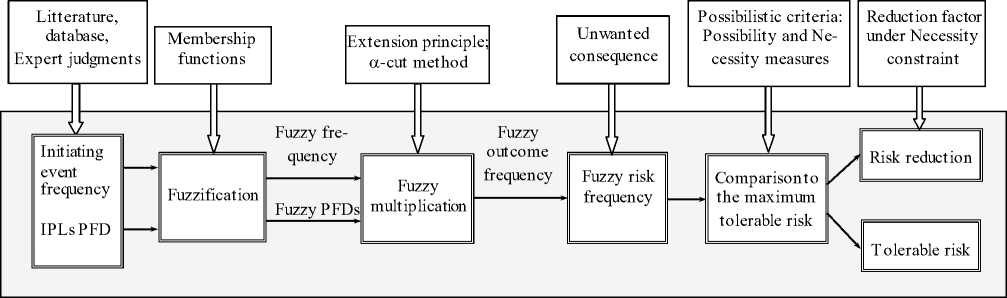
Fig. 2: Overall procedure of fuzzy LOPA.
In the present paper, the proposed fuzzy LOPA model belongs to what could be called “Fuzzy Quantitative Risk Analysis” (FQRA). The overall procedure of fuzzy LOPA model is shown in Fig. 2. Comparing to Markowski and Mannan’s model, there are two main differences: 1) the risk is expressed as a frequency of an unwanted consequence. Thus, risk criteria are based on a maximum tolerable risk frequency rather than on risk matrix. 2) Risk reduction is dealt with by the model, by considering a possibilistic risk reduction approach. The main steps of the fuzzy model are discussed below.
The first step is to fuzzify crisp values and/or intervals provided by literature, databases and/or expert judgment using possibility or fuzzy probability concept [17,20]. The possibility is a fuzzy set defined in probability space. In this paper, the possibilities of failure are fuzzy numbers defined on [0, 1] and with triangular membership functions, as shown in Fig. 3. The modal value m where µ(m)=1 corresponds to the value totally possible. The triangular representation leads to a reasonable approximation of the membership of the fuzzy outcome frequency, as discussed in the last step of the model.
A fuzzy number may be decomposed into its α-level sets, called α-cuts, through the resolution identity [30]. Let P ~ and P be a fu zzy number and its α-cuts, respectively. Then:
α = 1
P = U a • P a (5)
α = 0
with
P α = { p ∈ [0,1] µ P ~ ( p ) ≥ α } (6)
-
4.2 Calculation of fuzzy frequency
This calculation is based on extension principle [30]. In practice, the implementation of calculation procedure is not trivial since it corresponds to a non-linear programming problem. It is easy to show that fuzzy arithmetic operations are equivalent to the corresponding interval arithmetic operations for each α-cut with 0≤α ≤1. This method provides a discrete but exact solution to the extended operations in a very efficient and simple man-
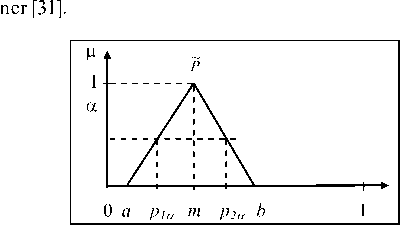
Fig. 3: Example of fuzzy probability.
The fuzzy outcome frequency is derived from the equation (1) by the extended multiplication, denoted by ⊗, as:
J
~ f i C = ~ f i I ⊗ ∏ PF ~ D ij (7)
j = 1
where ~ f C is the fuzzy frequency for consequence C for initiating event i ; ~ f I is the fuzzy initiating event frequency for initiating event i ; PF ~ D is the possibility of failure on demand of the j th IPL that protects against consequence C for initiating event i . Using α-cut decomposition:
a = 1 ^ J
~ C = U | a • fi- H a • PFD aj
a = 0
j = 1
where f1 and PFD stand for a-cuts.
J a i a ij
-
4.3 Comparison with the Maximum Tolerable Risk Frequency
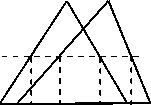
Risk reduction decision is based on comparing calculated frequency f C with maximum tolerable frequency TR (Section 2.3). When dealing with single values, this comparison is a straightforward question obeying to the relation (3). But when comparing fuzzy quantities it is sometimes difficult to claim that a fuzzy value is greater or smaller than another. The only case where we can say that a fuzzy number A ~is less than or equal to a fuzzy number 5, ~ < B' , is in which a ^ < b a and p < b for each a-cut, as illustrated in Fig. 4. Numerous research works have been devoted to the problem of ranking fuzzy quantities. A review of the different methods is given in [32-34].
In the framework of possibility theory [17,18], from a possibility distribution, one can define different uncertainty measures to characterize a given event. A possibility distribution is a mapping n from a universe of discourse U = { u } to the unit interval [0, 1] and it represents a fuzzy restriction on the possible values of a variable X . Let F ~ be a fuzzy set of U which is characterized by its membership function ц ~ .If F describes the label “high”, the proposition “ X is high” induces a possibility distribution кх = ц ~ with kx ( u ) is the possibility that X = u .
Ц
1 a
A ~ B ~
a a ь : a a ь a
Fig. 4: Comparison of two fuzzy numbers.
Given a fuzzy set A ~of U and the distribution possibility nx which takes values in V , the possibility and necessity (certainty) measures of A , denoted by П and N, respectively, are defined by [18]:
П F ~ ( A ) = sup min ( ц ~ ( u ), n x ( u ) ) u e V
N ~ ( ~) = 1 -П ~ (~) = inf max ( ц ~ ( u ),1 - n x ( u ) ) (10)
F F ueV A where A is the complement of A . П^(A) evaluates to what extent A is compatible with n x which represents the actual state of knowledge, and N^ (A) evaluates to what extent A is certainly implied by nx • The degree of necessity of A~is the degree of impossibility of A~ .
Since there is a ranking relation between the outcome frequency ~ f C and the maximum tolerable risk TR , we must consider the problem of comparing a fuzzy quantity and a crisp number using possibility and necessity measures. By considering the inequality p < r , where p is a possibilistic variable within a fuzzy interval Q and r is a crisp number, one can define the set of numbers possibly (resp. necessarily) greater than or equal to p values. They are denoted by[ Q , + ад ) and] Q , + ад [, respectively, and defined by [34]:
Ц q , +ад ) ( r ) = П q ( ( -ад , r ] ) = sup { a g ( P )| P < r } (11)
Ц]б, +ад)(r) = NQ ((-ад, r[ ) = inf {1 - ЦQ (P> IP > r} q 2) = 1 - suP{ЦQ (P)|P > r} where Пд and Ng are possibility and necessity measures defined by the possibility distributionц. Considering the fuzzy inequality fC
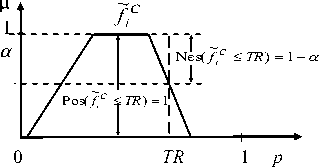
Po s( f-C < TR ) = sup { Ц f c ( P ) | P < TR } (13)
Nes( f-C < TR ) = 1 - s up { A ~ c ( p )| p > TR } (14)
and are depicted in Fig. 5.
~
Fig. 5: Possibility and necessity measures of fc < TR .
-
4.4 Risk Reduction
The decision regarding risk fall into one of the following categories: 1) Continue the safety management systems (SMS) that maintain the risk at its current level (assumed to be tolerable). 2) Mitigate the risk to make it tolerable by adding further safety barriers. 3) The risk is so high that it requires changes in the process design or the elimination of procedures and operations.
Much of the decision making in the real-life applications takes place in a fuzzy environment [35,36]. This refers to a decision process in which the goals and/or the constraints are imprecise and/or uncertain. In quantitative risk assessment (QRA), the choice of any risk-based decision mainly depends on the results derived from the comparison of the calculated risk with the maximum tolerable risk. However, risk experts are usually consulted when risk criteria are not available or ill-specified [4].
In our context, fuzziness in risk decision making is related to the fuzzy outcome frequency which is a critical parameter in risk reduction. We must deal with the fuzzy inequality ~ C < TR where f C is a fuzzy quantity. A problem of the type: “the risk per scenario must be substantially less than TR ” should be solved. One looks for determining satisfactory results instead of an optimal solution for this problem.
Fuzzy mathematical programming is developed for treating decisions in a fuzzy environment. Fuzzy decision-making supplies a natural framework to deal with vague concepts like bigger, smaller, satisfactory, adequate, etc. Fuzzy decision-making was initially developed by Bellman and Zadeh [35]. They considered the decision-making problem under fuzzy goals and constraints which are defined as fuzzy sets in the space of alternatives. From possibility theory, another type of fuzzy programming is developed [37]. It treats ambiguous and imprecise coefficients of objective functions and constraints. Possibilistic decision-making selects from a set of possibility distributions given the available information.
A fuzzy constraint which is a fuzzy event may be satisfied with certain predefined possibility and/or necessity degrees [37,38]. In LOPA, these possibility and necessity constraints may be imposed according to the company’s safety policy. The proposed possibilistic risk decision-making aims to reduce the fuzzy outcome frequency under a necessity constraint. This approach may refer to the concept of “necessary risk reduction” as defined by the IEC 61511 standard [3].
We consider the risk situation in which f C > TR . The risk function to be minimized may be written as:
f * = f C . X PL (15)
where ~ f C is a fu zzy interval denoted by the 4-tuple ( a , b , c , d ) and x is the PFD of a protection layer, as a decision variable. The possibilistic risk decision-making problem may write as:
~* min fi
. Nes f * < TR ) > X (16)
0 < X PL < 1
where X is a confidence level for the fuzzy constraint, whose values belongs to ] 0,1 ] . The choice of this interval guarantees a certain frequency reduction, since possibility constraint Pos( f * < TR ) = 1will be whenever satisfied. The fuzzy constraint may be solved by a de-fuzzication based on the interpretation of relation (1 4). From Fig. 6, it is clear that trapezoidal approximation of ~ f * results in:
Nes(f * < TR) = 1 - sup {дf * (p) |p > TR } = 1 — a with:
d — TR a = -*---* (17)
d — c
The parameters c * and d * are derived from the relation (15) by considering а-cut method for a=1 and a=0, respectively.
By taking into account the fuzzy constraint in (16), i.e. 1 — a > X , we arrived at:
TR
xPL < d — ( 1 — XXd — c )
The RRF may be a practicable decision variable. The relation (18) can write also as:
> d — (1 — X)( d — c) yPL >----------
So, MRRF depends on X value. More this value increases more the investment in risk reduction becomes important. The reduced frequency ~ f * is calculated from equation (15) by using а-cut method.
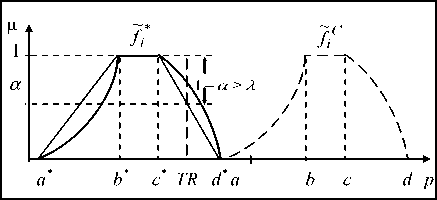
Fig. 6: Reducing frequency under necessity constraint
-
V. Case Study
5.1 Description of the Process
To demonstrate the applicability of the proposed fuzzy LOPA approach, our case study has focused on a heater of the MPP3-plant at Hassi R’Mel (South Algeria). The heater is one of the most critical systems in the gas treatment process and is able to generate catastrophic consequences on the persons, assets and environment.
The MPP3-plant recuperates heavy hydrocarbons (condensed and LPG) of crude gases from many oil wells to produce treated gases (gas for sale or reinjection gas). The process of gas treatment is based on: 1) Cooling gas by thermal exchange and simple relaxation (adiabatic). 2) Additional relaxation through turboexpander (isentropic). 3) Final temperature (- 40°C). Fig. 7 shows a simplified diagram of the production process of light fuel gases (gases for sale).
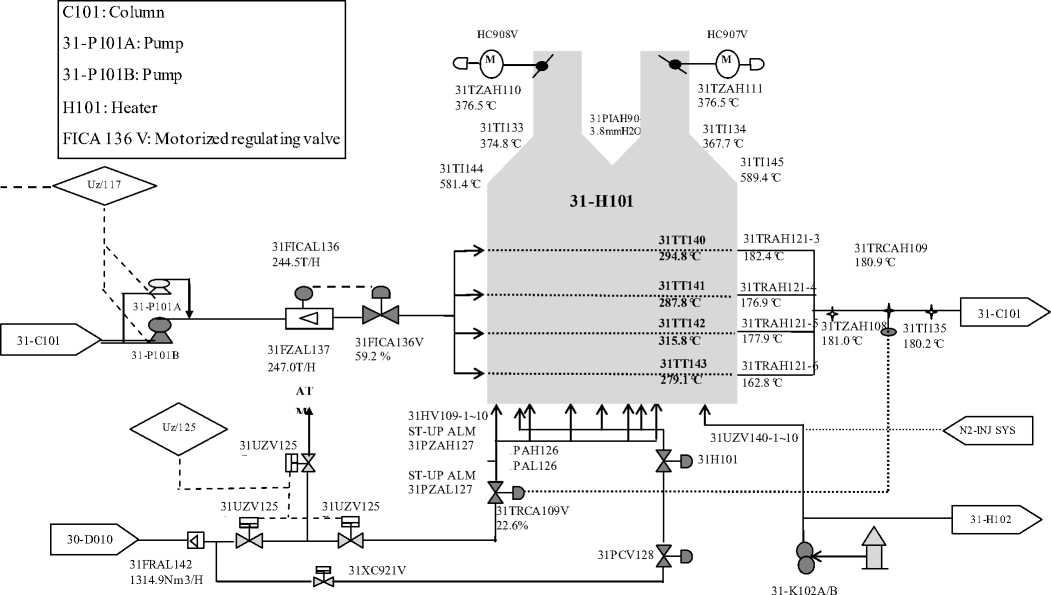
Fig. 7: Process flow diagram of the heat er H101
This process allows a better recuperation of liquid hydrocarbons, starting by pre-separation of crude gas coming from wells and its compression on the boosting station at a pressure of 117 kg/cm² and a temperature of 62°C. In high pressure separation section, the recovered liquid hydrocarbons are separated as a liquefied petroleum gas (LPG) and condensed in the deethanisor C102 of the fractionation section. After extracting light constitutions in the deethanizer C101 (composed of 28 valves), the accumulating plate separates these two parts. To avoid the formation of the hydrates in the upper part of the column C101, a glycol solution which is extracted from the accumulating plate is injected in the flow pipe. The separated liquid hydrocarbons are sent towards the highest plate of the lower part of C101. A part of these hydrocarbons is sent by means of pumps 31-P101 A and B towards the heater H101 for reheating at 150 °C. The flow hydrocarbon is regulated by the motorized regulating valve FICA 136. The outgoing fluid from of the heater at about 180°C is driven towards the column C101 in order to extract light fuel gases (gas of sale).
Our study particularly focuses on the heater H101 which represents critical equipment in the production of the light fuel gases (gas for sale) which are composed of methane and ethane.
-
5.2 Accident Scenarios and Safeguard Analysis
-
5.3 Failure data
-
5.4 Results and Discussion
-
5.4.1 Comparison of fuzzy frequencies and maximum tolerable frequency
-
Identifying accident scenarios is a preliminary step in LOPA. Representative accident scenarios (RAS) are selected according to risk criteria established by SONATRACH company [39].We are interested with scenarios that have the potential to result in release of flammable material and production loses. HAZOP study was performed to identify this kind of scenarios. Table 1 shows three potential scenarios with their causes and consequences. It should be noticed that initiating and top events in the event trees are well defined.
In order to reduce risks generated by these RAS, several IPLs are implemented. Conventional LOPA method allows the analysis of the different IPLs. Fig. 8a, 8b and 8c show the event trees of these scenarios. SONATRACH Company has retained the value of 10-5/year as a maximum tolerable frequency for accident scenarios resulting in more than one fatality on site [39].
Except for safety instrumented systems (SISs), uncertainty of failure probabilities is represented by considering fuzzy numbers as mentioned in section 4.1. Confidence intervals provided by experts or taken from databases and literature [13,15,39,40] are converted to fuzzy numbers by calculating quadratic mean value of interval boundaries. Triangular membership functions are chosen because they allow simple calculations of fuzzy frequency outcomes.
Tables 2a, 2b and 2c show initiating event frequency and fuzzy PFDs via a parametric representation. The parameters a, b and m are the lower bound, upper bound and modal value of the fuzzy number, respectively. When the failure probability is unique as the case of initiating event frequency in scenarios 1 and the proba bility of ignition in scenario 3, it could be considered as a fuzzy singleton number with a = b = m.
The average PFD of a safety function achieved by a SIS characterizes its safety integrity level (SIL) and is represented by an interval according to the IEC 61511 standard [3], with the interpretation that completely possible values are within this interval, i.e. ^ ~ ( p ) = 1 for all p belonging to this interval. For the heater H101, the implemented SISs operate in low demand mode of operation (less than once per year) and are designed to achieve SIL2.
The fuzzy frequencies of the three scenarios are calculated using equation (8) and a discretization of the membership functions of input data. Only eleven nested intervals (i.e. endecadarum system) are considered in the calculation [31]. Table 3 gives lower and upper bounds associated with each а-level. A graphical representation of these results is shown in Fig. 9. Compared with TR , the position of fuzzy frequencies ~ f C , ~ f C and ~ f C differs from one scenario to another. For ~ f C (whose the membership function is trapezoidal), except for the lower bound of the support, the other values of this set are greater than TR . This remark is consistent with respect to possibility and necessity measures given by table 4, i.e. Pos( / C < TR ) = Nes( / C < TR ) = 0 . Hence, / CC is an unacceptable frequency.
Table 1: Representative accident scenarios related to the heater H101
|
No° |
Guide-word |
Element |
Deviation |
Causes |
Consequences |
Safeguards |
|
1 |
No/ Less |
condensed flow |
No/ Less of flow |
Failure of the valve FICA-136V (closed) |
No liquid in the heater H-101, damage of serpentine, able to cause fire and process shutdown |
|
|
2 |
Less |
Air flow |
Less of flow |
Operator failure: Erroneous manipulation of manual valves HXC- 908V/907V (Stay closed) |
Incomplete Combustion, very high pressure inside the heater H-101, able to cause explosion and process shutdown |
- Alarm: PIAH-904 (≥ 10 MMH2O)
|
|
3 |
No/ Less |
Fuel gas flow |
No/ Less of flow |
Failure of the safety valve (TOR) UZ-125C (opened) |
|
Regulation and indication of the fuel flow according to the temperature of condensate. |
(a) Scenario 1
|
Initiating event |
Human response to alarm / Q ≤150 t/h |
SIS (FZAL137) Q ≤ 120 t/h |
Consequence |
|
■ Succes 1 - pfdx j |
|||
|
Failure of the valve |
Fail ▼ |
1 - PFD1X |
Safe situation Emergency shutdown and |
|
FICA-136V (closed) |
PF ~ D 11 |
PF ~ D 21 |
product off-spec Damage of serpentine, fire and process shutdown |
Initiating event
(b) Scenario 2
|
Human response to alarm / Q ≤150 t/h |
Open vent Q ≤ 120 t/h |
Consequence |
1 - PFDX2
Operator failure: Erroneous manipulation o f manual valves HXC-908V/907V (Stays closed)
Succes Fail
1 - pfd22
Initiating event
Failure of the safety valve (TOR) UZ-125C: Intempestive opening
PF ~ D 12
PF ~ D
Safe situation
Incomplete Combustion and product off-spec
(c) Scenario 3
|
Human response to alarm P ≤ 0,4 Kg/cm2 & Q ≤ 1250 Nm3/ht/h |
SIS (FZAL 125) P ≤ 0,2 Kg/cm2 ; Q < 120 t/h i |
Consequence |
1 - PFD^
Succes Fail
1 - pfd23
PF ~ D 13
1 - P g
PF ~ D
Safe situation
Emergency shutdown and product off-spec
Product off-spec, fuel gas release in atmosphere,
~
Pig
Ignition
Fire and process shutdown
Fig. 8: Event trees of accident scenarios.
Table 2: Fuzzy probabilities relative to accident scenarios
(a) Scenario 1
|
Fuzzy probability parameters |
a |
m |
b |
|
Valve failure frequency (per year) |
10-1 |
10-1 |
10-1 |
|
PF ~ D (Human response to alarm) |
10-1 |
3.16 x 10⁻¹ |
1 |
|
PF ~ D (SIS FZAL137) (SIL2) |
10-3 |
- |
10-2 |
|
(b) Scenario 2 |
|||
|
Fuzzy probability parameters |
a |
m |
b |
|
Human error frequency (per year) |
10-2 |
3.16 x 10 -2 |
10-1 |
|
PF ~ D (Human response to alarm) |
10-1 |
3.16 x 10⁻¹ |
1 |
|
PF ~ D (Open vent) |
10-3 |
3.16 x 10⁻³ |
10-2 |
|
(c) Scenario 3 |
|||
|
Fuzzy probability parameters |
a |
m |
b |
|
Frequency of safety valve failure (per year) |
10-3 |
3.16 x 10⁻³ |
10-2 |
|
PF ~ D (Human response to alarm) |
10-1 |
3.16 x 10⁻¹ |
1 |
|
PF ~ D (SIS FZAL 125) (SIL2) |
10-3 |
- |
10-2 |
|
P ~ ig (Ignition) |
3 x 10⁻¹ |
3 x 10⁻¹ |
3 x 10⁻¹ |
~ f C of scenarios 3 can be v iewed as possibly tolerable by referring to the possibility measure which is an optimistic criterion; we have Pos( /3C < TR ) = 1 . However, claiming that ~ f C is necessarily tolerable is not consistent with the value of Nes( /1c < TR ) which is of 0.38. The fuzzy frequency ~ f C is between the two previous frequencies but it tends much more toward the intolerable zone since even the optimistic criterion of comparison is not completely verified, namely Pos( /2C < TR ) = 0.53 .
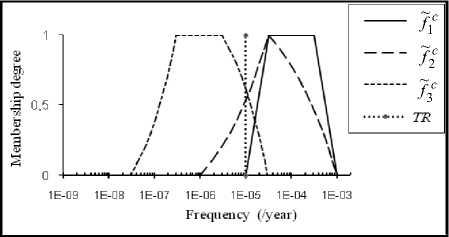
Fig. 9: Fuzzy frequencies compared with TR
-
5.4.2 Reduction of Consequence frequencies under necessity constraint
-
5.4.3 Consideration of practical aspects
Referring to the relation (19), it can be seen that we need the value of the confidence level X to calculate MRRF. X=0.5 seems to be a reasonable hypothetic value for three reasons: 1) as a value different to zero it perfectly guarantees the optimistic criterion based on the possibility measure, i.e Pos(~ * < TR ) = 1 . 2) it refers to the central point in the interval [0, 1] which corresponds to 50% of certainty. 3) it allows the necessity constraint as a pessimistic criterion to be moderate and therefore, both technological and financial constraints would not be an obstacle in necessary risk reduction.
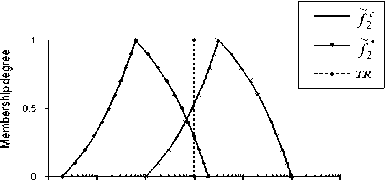
MRRFs for the specified scenarios are given by table 5 and reduced frequencies under necessity constraint are shown in Fig. 10a, 10b and 10c. Note that ~f C and ~f * are trapezoidal, except that they are plotted on logarithmic scale. As we can see, the results are in concordance with the results of table 4 which are based on the position of the estimated fuzzy frequencies against TR. Indeed, more the decrease part of the fuzzy frequency moves away from TR, more the MRRF value increases. MRRF for the scenario 1 is the highest; scenario 2 requires a MRRF not far away from the first. Scenario 3 may represent the best of the three scenarios since it only requires a low MRRF, namely MRRF=2, to meet TR. Table 6 shows possibility and necessity measures when considering fuzzy frequencies reduced under necessity constraint. Compared to the results of table 4, it can be seen that all the possibility measures are equal to 1 and all the necessity measures have increased considerably (0.5 is the minimum value). This result might be suitable for necessary risk reduction.
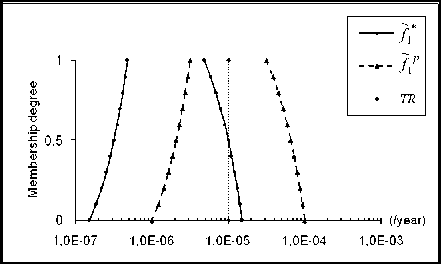
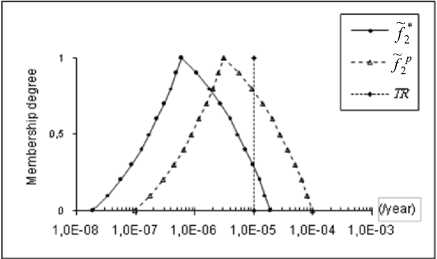
For further validation of the proposed approach, we have attempted to consider some practical aspects which could improve the safety integrity of protection layers and reduce therefore the consequence frequencies. For each scenario it was question to minimize either the initiating event frequency or the PFD of one IPL based on judgements of process experts. Table 7 shows the modifications provided by these experts and their effects. Both consequence frequencies reduced under necessity constraint (may be qualified as theoretical) and those issued from practical modifications are represented in figures 11a, 11b and 11c. From the results of table 8, we can say that for the scenarios 1 and 2, fuzzy frequencies related to practical considerations are between the estimated (or initial) fuzzy frequencies and the theoretical ones.
Table: 3 а -level intervals of fuzzy frequencies
|
a -level |
Scenario 1 |
(per year) |
Scenario 2 |
(per year) |
Scenario 3 |
(per year) |
|
0 |
10-5 |
10-3 |
10-6 |
10-3 |
3 x 10⁻⁸ |
3 x 10⁻⁵ |
|
0,1 |
1.22 x 10⁻⁵ |
9,32 x 10⁻⁴ |
1,80 x 10⁻⁶ |
8,09 x 10 -4 |
4,44 x 10⁻⁸ |
2,60 x 10⁻⁵ |
|
0,2 |
1,43 x 10⁻⁵ |
8,63 x 10⁻⁴ |
2,94 x 10⁻⁶ |
6,43 x 10 -4 |
6,16 x 10⁻⁸ |
2,24 x 10⁻⁵ |
|
0,3 |
1.65 x 10⁻⁵ |
7,95 x 10⁻⁴ |
4,48 x 10⁻⁶ |
5,02 x 10 -4 |
8,15 x 10⁻⁸ |
1,90 x 10⁻⁵ |
|
0,4 |
1,86 x 10⁻⁵ |
7,26 x 10⁻⁴ |
6,49 x 10 -6 |
3,83 x 10 -4 |
1,04 x 10⁻⁷ |
1,58 x 10⁻⁵ |
|
0,5 |
2,08 x 10⁻⁵ |
6,58 x 10⁻⁴ |
9,01 x 10⁻⁶ |
2,85 x 10 -4 |
1,30 x 10⁻⁷ |
1,30 x 10⁻⁵ |
|
0,6 |
2,30 x 10⁻⁵ |
5,90 x 10⁻⁴ |
1,21 x 10⁻⁵ |
2,05 x 10 -4 |
1,58 x 10⁻⁷ |
1,04 x 10⁻⁵ |
|
0,7 |
2,51 x 10⁻⁵ |
5,21 x 10⁻⁴ |
1,59 x 10⁻⁵ |
1,42 x 10 -4 |
1,90 x 10⁻⁷ |
8,15 x 10⁻⁶ |
|
0,8 |
2,73 x 10⁻⁵ |
4,53 x 10⁻⁴ |
2,03 x 10⁻⁵ |
9,29 x 10⁻⁵ |
2,24 x 10⁻⁷ |
6,16 x 10 -6 |
|
0,9 |
2,94 x 10⁻⁵ |
3,84 x 10⁻⁴ |
2,56 x 10⁻⁵ |
5,69 x 10⁻⁵ |
2,60 x 10⁻⁷ |
4,44 x 10⁻⁶ |
|
1 |
3,16 x 10⁻⁵ |
3,16 x 10⁻⁴ |
3,16 x 10⁻⁵ |
3,16 x 10⁻⁵ |
3 x 10⁻⁷ |
3 x 10⁻⁶ |
Note that the possibility measure is still equal to 1 for all the scenarios. This result is compatible with an optimistic risk reduction. On the other hand, necessity measure has considerably decreased, namely 0 and 0.22 versus 0.5 and 0.71, respectively. Necessary risk reduction is somewhat carried out for scenario 2 and it could be seen that both modal value and lower bound of the support of ~f p are less than TR.
Table 4: Possibility and necessity measures related to initial frequencies
|
Scenario |
Pos( f C < TR ) |
Nes( f C < TR ) |
|
1 |
0 |
0 |
|
2 |
0.53 |
0 |
|
3 |
1 |
0.38 |
(a) Scenario 1
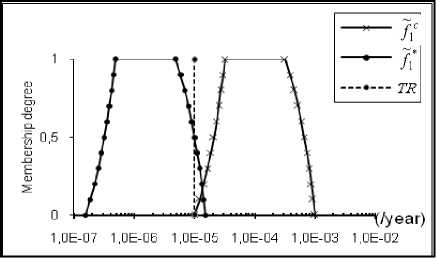
Table 5: MRRF for 1 =0.5 and TR =10-5/year
|
Scenario |
MRRF |
|
1 |
66 |
|
2 |
51.58 |
|
3 |
2 |
Table 6: Possibility and necessity measures related to theoretical reduction
|
Scenario |
Pos( f * < TR ) |
Nes( f * < TR ) |
|
1 |
1 |
0.5 |
|
2 |
1 |
0.71 |
|
3 |
1 |
0.62 |
|
Table 8: Possibility and necessity measures related to practical reduction |
||
|
Scenario |
Pos f < TR ) |
Nes( fp < TR ) |
|
1 |
1 |
0 |
|
2 |
1 |
0.22 |
|
3 |
1 |
1 |
(b) Scenario 2
1 OE-OS 1.0E-07 1.0E-06 1.0E-05 1.0E-04 1.0E-03 1.0E-02
(c) Scenario 3
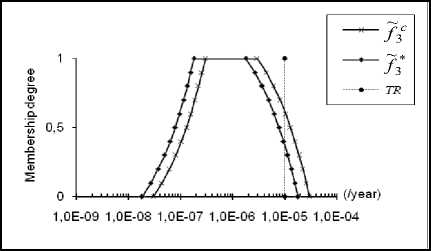
Fig. 10: Reduction of consequence frequency under necessity constraint
Table 7: Modifications provided by process experts
Scenario Suggested Modifications
Effects
For the SIS FZAL137 as an IPL, add another sensor identi-
1 cal to the first to modify the architecture of sensor-part from 1oo1 to 1oo2
To focus on the human factor as an initiating event by further training
Increasing the safety integrity of the SIF from SIL2 to SIL3 with PF ~ D belonging to [10-4 10-3]
Increasing human reliability at least of one magnitude order, i.e.
f I = (10 ' 3, 3.16 x 10 '3 , 10 '2 ) (per year)
For the SIS FZAL125 as an IPL, add another sensor identical to the first to modify the architecture of sensor-part from 1oo1 to 1oo2
Increasing the safety integrity of the SIF from SIL2 to SIL3 with PF ~ D belonging to [10-4 10-3]
(a) Scenario 1
(b) Scenario 2
(c) Scenario 3
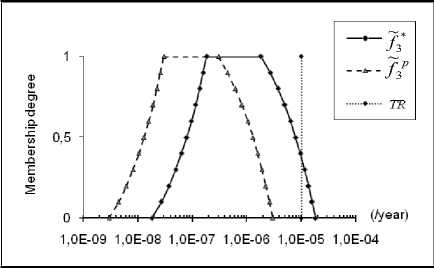
Fig. 11: Reduction of consequence frequency via practical modifications
However, for scenario 1 it seems clearly that modifications suggested by experts are not enough and further improvements are needed. Further improving the SIL of SIF associated with the SIS FZAL137, we recommend also the reduction of the initiating event frequency, i.e. valve failure frequency, by adding a redundant valve. For scenario 3 (Fig. 1 1c), p ractical modifications have resulted in net reduction, i.e. fuzzy consequence frequency due to practical modifications is less than the theoretical one, with a necessity measure equal to 1 (compared to 0.62 for theoretical fuzzy frequency). Therefore, we think that theoretical MRRF is so low (equal to 2) that it would be difficult to propose an adequate technical improvement. Therefore, compared to TR , the initial fu zzy frequency, ~ f C , may be accepted as it is without immediate action.
-
VI. Conclusion
In this paper, we have proposed a fuzzy LOPA model with four main characteristics: 1) The use of fuzzy probabilities or fuzzy frequencies to represent input data. 2) The use of fuzzy arithmetic to calculate the fuzzy outcome frequencies. 3) Comparison of these frequencies with maximum tolerable frequency by using possibility and necessity measures. 4) Application of necessary risk reduction via a possibilistic risk decision-making. For the latter, we have resolved a risk reduction problem under a necessity constraint.
A case study concerning a heater in a gas treatment process has shown the great applicability of the proposed approach and the results are encouraging. Referring to three accident scenarios with frequencies ranging from intolerable to almost tolerable, we have seen how the MRRF varies according to the difference between fuzzy frequencies and tolerable frequency. Furthermore, practical modifications as proposed by experts have shown the potential of the proposed approach in evaluating expert judgments.
In this paper, results can be viewed in some sense as partial. We believe that fuzzification stage needs more development, especially when dealing with single values and/or large intervals. A second problem concerns the choice of the confidence level, λ, in necessary risk reduction and its relationship with ALARP principle. The question is which λ value satisfies ALARP demonstration?
Beyond this kind of questions, we believe that fuzzy LOPA model might be an extension of conventional LOPA which can be applied successfully outside the probabilistic framework.
Acknowledgment
This work is a part of a research project supported by the Ministry of Higher Education and Scientific Research in Algeria under no J0201320110036.
References Layers of Protection Analysis Using Possibility Theory
- L. Harms-Ringdal, Analysis of Safety Functions and barriers in accidents, Safety Science, 2009, 47: 353-363.
- Sklet S, Safety barriers: Definition, classification, and performance, J. Loss Prev. Proc. Industries, v19, 2006, pp.494-506.
- Functional Safety-Safety instrumented systems for the process industry sector, IEC 61511-Parts 1 and 3, International Electrotechnical Commission Std., 2003.
- Layer Of Protection Analysis, simplified process assessment, Simplified process risk assessment, Center for Chemical Process Safety (CCPS) of the American Institute of Chemical Engineers (AICHE), 2001.
- L. Zadeh, Outline of a New Approach to the Anal-ysis of Complex Systems and Decision Processes, IEEE Trans. Systems, Man, and Cybernetics, vol. SMC-3,1973, pp.28-44.
- A.S. Markowski, M.S. Mannan, A. Kotynia, D. Siuta, Uncertainty aspects in process safety analy-sis, J. Loss. Prev. Proc. Industries, v23, 2010, pp.446-454.
- W.K. Muhlbauer, Pipeline risk management manu-al: Ideas, techniques and resources, 3rd ed., Else-vier InC, 2004.
- A.M. Dowell, D.C. Hendershot, Simplified Risk Analysis-Layers of Protection Analysis, presented at the National Meeting of the American Institute of Chemical Engineers, Indianapolis, Nov. 3-8, Pa-per 281a, 2002.
- J.B. Bowles, C.E. Pelaez, Application of Fuzzy logic to Reliability Engineering, Proceedings of the IEEE, v83, 1995, pp.435-449.
- M.H. Chun, K.I. Ahn, Assessment of the potential applicability of fuzzy set theory to accident pro-gression event trees with phenomenological uncer-tainties, Reliab. Eng. System Safety, v37, 1992, pp.237-252.
- R. Kenarangui, Event tree Analysis by fuzzy prob-ability, IEEE Trans. on Reliab., v40, 1991, pp.120-124.
- Markowski A S, Mannan M S, Fuzzy logic for pip-ing risk assessment (pfLOPA), J. Loss. Prev. Proc. Industries, v22, 2009, pp.921-927.
- Guidelines for Process Equipment Reliability Data With Data Tables, Center for Chemical Process Safety (CCPS) of the American Institute of Chemi-cal Engineers (AIChE), 1989.
- IEEE Guide to the Collection and Presentation of Electrical, Electronic, Sensing Component, and Mechanical Equipment Reliability Data for Nucle-ar-Power Generating Station, IEEE-Std-500, 1984.
- Offshore Reliability Data Handbook, 4th ed. Off-shore Reliability Data (OREDA), 2002.
- M. Abrahamsson, Uncertainty in Quantitative Risk Analysis-Characterisation and Methods of Treat-ment, Department of Fire Safety Engineering, Lund University, Report n1024, 2002.
- L.A. Zadeh, Fuzzy sets as a basis for a theory of possibility, Fuzzy Sets and Syst., v1, 1978, pp.3-28.
- D. Dubois and H. Prade, Possibility Theory. New York: Plenum, 1988.
- S. Murè, M. Demechela, Fuzzy Application Proce-dure (FAP) for the risk assessment of occupational accidents, J. Loss. Prev. Proc. Industries, v22, 2009, pp.593-599.
- H. Tanaka, L.T. Fan, F.S. Lai, K. Toguchi, Fault-Tree Analysis by Fuzzy Probability, IEEE Trans. on Reliab., vol. R-32, 1983, pp.453-457.
- C. Wei, W.J. Rogers, M.S. Mannan, Layer of pro-tection analysis for reactive chemical risk assess-ment, J. Hazard. Materials, v159, 2008, pp.19-24.
- E.M. Marszal, E.W. Scharpf, Safety Integrity Level selection-Systematic Methods Including Layer of Protection Analysis. The Istrumentation, Systems, and Automation Society (ISA), 2002.
- Guidelines for Developing Quantitative Safety Risk Criteria, Center for Chemical Process Safety (CCPS) of the American Institute of Chemical En-gineers (AIChE), 2009.
- Reducing Risks, Protecting People - HSE ’s Deci-sion-making Process, Health and Safety Executive (HSE), Her Majesty’s Stationery Office, London, 2001.
- Guidelines for Chemical Process Quantitative Risk Analysis, 2nd ed. Center for Chemical Process Safety (CCPS) of the American Institute of Chemi-cal Engineers (AIChE), 2000.
- F.P. Lees, Loss Prevention in the Process Industries. 2nd ed., vol.1, Butterworth-Heinmann, Ox-ford,1996.
- M. Sallak, C. Simon, J.F. Aubry, A Fuzzy Proba-bilistic for Determining Safety Integrity Level, IEEE Trans. on Fuzzy Syst., v16, 2008, pp.239-248.
- L.A. Zadeh, Fuzzy sets, Information and Control, v8, 1965, pp.338-353.
- R. Nait-Said, F. Zidani, N. Ouazraoui, Modified risk graph method using fuzzy-rule-based approach, J. Hazard. Materials, v164, 2009, pp.651-658.
- Zadeh L A, The concept of a linguistic variable and its application to approximate reasoning, Parts I and II, Information Sciences, v8, 1975, pp. 199-249, 301-357.
- A. Kaufman, M.M. Gupta, Introduction to Fuzzy Arithmetic Theory and Application. 1991, New York: Van Nostrand Reinhold.
- G. Bortolan, R. Degani, A review of some methods for ranking fuzzy substs, Fuzzy Sets and Syst., v15,1985, pp.1-19.
- D. Dubois, H. Prade, A unified view of ranking techniques for fuzzy numbers, Proceedings of the IEEE Conf. on Fuzzy Systems, v3, 1999, pp.1328-1333.
- D. Dubois, H. Prade, Ranking Fuzzy Numbers in the Setting of Possibility Theory, Information Sci-ences, v30, 1983, pp.183-224.
- R.E. Bellman, L.A. Zadeh, Decision-Making in a Fuzzy Environment, Management Science, v17, 1970, pp141-164.
- E. Muela, G. Schweickardt, F. Garcés, Fuzzy pos-sibilistic model for medium-term power generation planning with environmental criteria, Energy Policy, v35, 2007, pp.5643-5655.
- Inuiguchi M, Ramik J, Possibilistic linear pro-gramming: a brief review of fuzzy mathematical programming and a comparison with stochastic programming in portfolio selection problem, Fuzzy Sets and Syst., v111, 2000, pp.3-28.
- Das B, Maity K, Maiti M, A two warehouse sup-ply-chain model under possibil-ity/necessity/credibility measures, Mathematical and Computer Modelling, v46, 2007, pp.398-409.
- Methodology for Layer Of Protection Analysis, SONATRACH Company, Hassi-R’Mel, Rep. S-30-1240-140, 2007.
- Notebooks of Industrial Safety: Frequencies of accident initiating events, Institute for a Culture in Industrial Safety (ICIS), 2009, Available: http://www.icsi-eu.org/
