LMS analysis using IPA Matrix for Web Applications

Author: Rufman Iman Akbar, Denny Ganjar Purnama
Journal: International Journal of Education and Management Engineering @ijeme
Article in issue: 2 vol.13, 2023.
Free access
The use of learning websites in the field of education has now become a necessity. One of them is using a Learning Management System that supports the learning process. The Learning Management System is a system that tertiary institutions widely use to help the teaching and learning process run smoothly. Apart from providing benefits to tertiary institutions, this system must also be well received by the primary users, namely students. To assess the performance of a Learning Management System, tools that can be used include the Analysis using the Index – Performance Matrix. This matrix was initially developed to assess consumer satisfaction with the marketing of goods or services. Still, it can be developed to assess user satisfaction with the services of an LMS website. This study tries to assess one LMS using indicators to assess website user satisfaction, using the Importance – Performance Analysis Matrix, which is modified according to website assessment standards. The results of this Analysis obtained data on the gap between the performance expected by the user and the user's preferences regarding the level of importance of each indicator. Based on the data spread over the four quadrants, it can be determined which factors should be prioritized for improvement or improvement. These variables are variables 2, 3, 4 and 6, namely the Application features , application reliability, replication suitability and also ease of repair, we found several variables that need to be fixed immediately and which factors are not yet urgent. This research was conducted at a university in South Tangerang.
Learning Management System, IPA Matrix, Web Applications, four quadrants, Website Assessment
Short address: https://sciup.org/15018652
IDR: 15018652 | DOI: 10.5815/ijeme.2023.02.02
Text of the scientific article LMS analysis using IPA Matrix for Web Applications
The use of the internet in education has penetrated many fields. What is quite popular is as a tool for promoting educational institutions, disseminating information to the broader community, and distributing materials and learning processes. Almost all educational institutions have a website for their operational activities. This condition is done to make it easier for users to get information. Users can be academics or the general public.[1]
College websites generally contain college portfolios. But many tertiary institutions have websites to help carry out learning, academic administration, and other administrative processes. This includes online library sites, quality assurance, online journal editions, etc. All of this is used to support the smooth operation of higher education institutions. This website includes a Learning Management System. [2-4]
The quality of a website can be assessed from various aspects, including the information available, the appearance of the website, and the functions provided on it. Different preferences of users - cause not all website users are satisfied with the existing website, it is necessary to evaluate the website—a good website in terms of appearance, but not necessarily good in terms of performance. Likewise, a good website, in terms of performance, does not provide sufficient information for users. Based on this situation, a standard can be used to assess aspects of a website. [5,6]
Various analytical tools can measure the value of a website's services from the user's point of view. These tools exist in the form of qualitative analysis tools and quantitative analysis, and there is also a combination of the two. Each tool has its advantages and disadvantages. Likewise, easy to use. Some of the tools are analytical tools used in other fields of science. This tool can then be adapted into a tool for assessing a website. [7-9].
Gap analysis is one of the measurement methods used to determine whether there is a discrepancy between the performance of a variable and the user's expectations of that variable. The gap analysis is part of the IPA (Importance -Performance Analysis Matrix) calculation and depiction method. Matrix values are obtained from questionnaires distributed to consumers on certain variables. Against the results of the user's answer, then the sigma value is calculated to make a matrix. [5,10,11]
The Importance Performance Analysis method was first put forward by Martilla and James and published in 1977. The aim is to measure the relationship between consumer perceptions and the priority consumers expect to improve the quality of products/services. This method is also known as quadrant analysis. The importance Performance Analysis Matrix is used to describe the relationship between the importances of each attribute based on the consumer's view of the performance of each attribute offered. The difference in value indicates the gap between the performance and expectations of each of these attributes.[12,13]
Importance Performance Analysis Matrix has the primary function of displaying information about factors on the service side that consumers consider to influence their satisfaction and loyalty greatly. This matrix also describes service factors that need to be improved according to consumers. Respondents are users of products or services. Regarding website services, respondents or consumers are website users or people who are interested in using the website.[7,14,15]
The problem in this research is finding out the user's view of a website in terms of what is expected by the user and what is there according to the user's assessment. It is hoped that an overview of the existing gaps from the user's point of view will be produced. The case study raised is a user's assessment of the Learning Management System at University X, located in the South Tangerang area.
Researchers will use IPA Matrix to get an overview of this gap from this LMS website. The Matrix attribute has been adjusted to find out the gaps in website services based on what users want. The gap between what is expected and what is there is a gap that occurs. Developers can use this gap to improve websites to make them more optimal. Website owners can use it to evaluate how the website can meet user expectations. [8,16]
Several previous studies that have been conducted include the title "Using Modified IPA to Improve Service Quality of Standard Hotel in Taiwan" by Ho, L., Feng, S, "An Importance-Performance Analysis of Primary Health Care Services" by Miranda and Chamorro. The difference between this study and previous research is that the first study used the IPA Matrix to analyze the quality of hotel services. The second study deals with the quality of hospital services. This study uses the IPA Matrix to analyze the under-web LMS application. [17,18]
Other research is "Applying the IPA and DEMATEL models to improve the order-winner criteria: A case study of Taiwan's network communication equipment manufacturing industry" by Hu, Chiu, and Cheng, as well as: Using importance-performance analysis and decision making trial and laboratory evaluation to enhance order-winner criteriã a study of the computer industry" from Lee, Yen, and Tsai. The difference with this research is that this research is more directed at selecting hardware products. Meanwhile, this research is more directed at evaluating software.[19-21]
The main purpose of this study is to evaluate or see the gaps in one LMS website and determine priorities for improving the service attributes of the website. This tool uses the basic concept of the IPA Matrix from Martilla and James, which has been modified by including the evaluation variables of a website. The indicators used were obtained from tools to evaluate the value of a website from various sides.
2. Methodology
We conducted this research in several stages. Includes instrument preparation, instrument validation, data dissemination and collection, data analysis in matrix form, and results of gaps that occur.
The first stage is the preparation of the instrument. The preparation is carried out by referring to preliminary research that has been done and in combination with variables widely used in evaluating a website. We use the results of previous research to collect the variables that will be used. After getting the list of variables to be used, thent he next stage is to validate the selected variables instruments. First, instrument triangulation was conducted by assessing several experts or expert practitioners. Furthermore, the normality test was carried out on these variables. (see Fig 1)
After the instrument used has been validated, we try to collect data according to predetermined instruments. A set of online questionnaire is created using the Google form for data collection as needed. We distributed Google form links to student respondents because most users are students. Incidental Random Sampling was used for the sampling method by capturing the first 100 respondents who were met/filling out the survey.
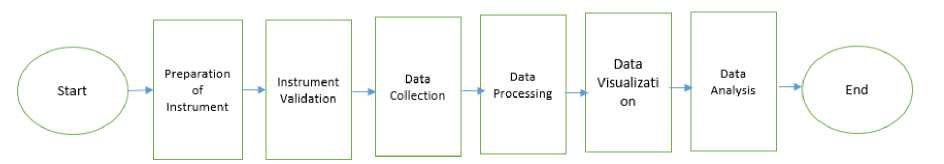
Fig. 1. Diagram Research Stages
After the data is collected through the Google form, the data is tested using the normality test to obtain normally distributed data . Data proven to have a normal distribution will be processed according to procedures to obtain Importance and Performance indexes based on user opinion according to the instrument in question. The data obtained from the processing results are described as an IPA matrix and 4 quadrant partitions after grouping accordingly the rules . An analysis of the distribution of variables in the 4 quadrants is carried out.
Comparison of the user's assessment of the performance of one variable with the user's preference regarding the level of importance is a gap or improvement target that systems must achieve. The gap and the magnitude of the index number for each variable determine the placement of each position on the four quadrant graphs that are formed. [15]
Based on the data obtained, a plot will be made for a 4 quadrant matrix that describes the relationship of each variable from the Importance side to Performance. This matrix can show indicators of which variables are suitable, good enough, or still lacking. The questionnaire adopts a scale of 5, so the matrix will also use a scale of 5 in describing relationships and assessments. Fig 2 shows the design of the matrix to be used.
Importance
Performance
1 2 3 4 5
Fig. 2. IPA Matyrix 4 Quadrans
3. Results and Discussion
The first stage is compiling the instrument. We used the instrument from previous research the researcher had done and then triangulated it with several experts and practitioners. Based on the triangulation of experts and practitioners, we concluded that we would use the following indicators in this study:
-
1. Application Capabilities
-
2. Application features
-
3. Application Reliability
-
4. Application suitability
-
5. Durability
-
6. Ease of repair
-
7. The beauty/aesthetics of the application
-
8. Application perception
The application capability variable measures the extent to which the application can accommodate user needs. The more needs that are met, the higher the ability value. Conversely, if fewer applications accommodate the needs, the value will be lower. [22,23]
The application feature variable measures the number of facilities or features the application provides. The more features provided, the higher the value will be. Conversely, the fewer features provided, the lower the value.
The application reliability variable measures how reliably users can use the application. The lower the error rate, the more reliable or reliable the application will be. A few problems faced by users characterize high reliability. Low reliability if errors or errors frequently occur in the application. [6,24,25]
The suitability variable assesses the functions provided compared to the functions expected by the user. The more functions that suit your needs, the higher the suitability value of the application.
The following variable is durability or durability, This variable measures the ability of the system to run following the developing technology. If the application is not disturbed by technological developments, its durability can be high. If you always need repair because of technological developments, then the level of durability is relatively low.
The ease of repair variable shows how much effort the user needs to make if a problem occurs. The higher the effort required, the lower the value of the ease of repair variable. Meanwhile, the less effort required, the higher the value of the ease of repair variable.
The beauty or aesthetics variable shows how aesthetically pleasing the appearance and use of an application is. This indicator relates to the design of the User Interface and also the User Experience when the application is designed. The more beautiful and aesthetic it looks, the better the value.
The application perception variable shows how the user perceives the application objectively. The higher the user's appreciation, the better the perceived value of the application. On the other hand, the worse the user's appreciation, the lower the perceived value.
After the instrument has been validated, the next step is data collection. To collect the data, we use Google Forms, and the result is stored on Google Drive. The link is sent via the WA group to the respondent. Namely active students at the University of X. The sampling method uses incidental random sampling. The sample is limited to the first 100 respondents to fill out. Based on the collected data, the researcher carried out data checking and cleaning. Based on the instruments that have been selected, the researcher creates a questionnaire with a choice of answers on a scale of 1 - 5. This selection is made to make it easier to fill in and calculate after the data is collected. For performance appraisal, the quantification used is;
-
1. Very Dissatisfied (Score 1)
-
2. Not Satisfied (Score2)
-
3. Fairly Satisfied (Score 3)
-
4. Satisfied (Score 4)
-
5. Very Satisfied (Score 5)
For the assessment of Importance (interest), the quantification used is;
-
1. Very Not Important (Score 1)
-
2. Not Important (Score 2)
-
3. Significantly Important (Score 3)
-
4. Important (Score 4)
-
5. Very Important (Score 5)
The results of the questionnaire obtained on Google Drive are still qualitative. This data is then saved in a CSV file format, where a comma delimiter separates each field. The CSV data is then opened with the Microsoft Excel application. Using Microsoft Excel, data cleaning and data processing are then carried out, as well as conversion for quantification. Furthermore, the quantification result data is processed and grouped according to the respondents' answers. Data processing is done using function commands in the Excel application. (see tabel 1 for the results)
Table 1. Qustionaire Calculation Results
|
Application Capabilities |
3,30 |
4,10 |
|
|
2 |
Application features |
3,70 |
4,00 |
|
3 |
Application Reliability |
3,50 |
4,10 |
|
4 |
Application suitability |
3,70 |
4,00 |
|
5 |
Durability |
3,40 |
3,90 |
|
6 |
Ease of repair |
3,50 |
4,20 |
|
7 |
The beauty/aesthetics of the application |
3,60 |
3,70 |
|
8 |
Application perception |
3,50 |
3,90 |
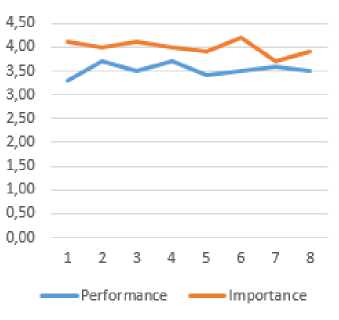
The data processing results obtained show that the Application features and Application suitability attributes have the highest value, 3.7 out of a scale of 5. This number means that the Application features and suitability of the application under study are relatively excellent. While Application Capabilities has the lowest score, namely 3.3 on a scale of 5. On average, the performance value is 3.53, meaning user satisfaction with performance is above 70.6%.
For preferences regarding the importance, the highest score is on the Ease of repair attribute, which is 4.2 out of a scale of 5. This number means that users consider repairs if problems occur to be very important. In contrast, the lowest preference is The beauty/aesthetics of the application, namely 3.7. This number means that users consider display variables less critical than other variables.
Based on the results of the quantification of the collected questionnaires, a graph can be made that depicts the performance line and the importance based on the respondents' assessments. See fig 3, that shows the appearance of the two graphs.
-
Fig. 3. Graphic Performance & Importance
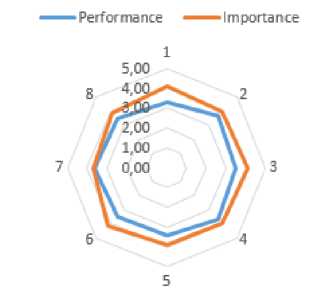
We also can make A Radar Chart from the Performance – Importance chart, which shows the gaps that occur in the form of a surface/radar chart (see fig 4). The highest gap that occurs is 0.8, while the lowest is 0.1. This result shows the highest gap below 16% on the 5 scales. At the same time, the lowest gap is 2%.
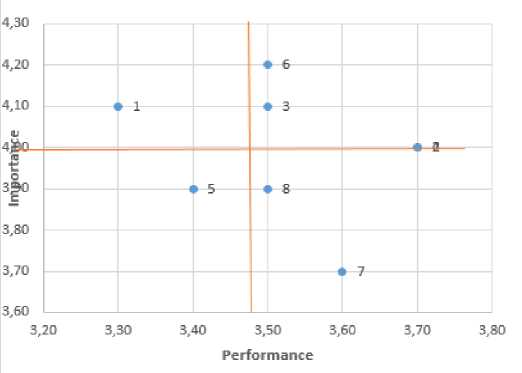
Furthermore, based on the results of the quantification of the questionnaire, an "Importance – Performance analysis matrix" can be made in four quadrants (see fig 3). The horizontal axis shows the performance assessment results, while the vertical axis shows the level of importance based on the user's preferences.
From the "Importance – Performance Matrix" calculation results, the difference between the current performance and the user's preferences regarding the importance of each indicator is obtained. The calculation results can be seen in Tabel 2.
-
Fig. 4. Radar graphic of Performance & Importance
Based on table 3, we can see that the highest gap
beauty/aesthetics of the application has the lowest gap, namely 0.10.
is Application Capabilities, which is 0.8. Meanwhile, The
-
Fig. 5. Importance – Performance Matrix
Using the quadrant division mapping, we can see that there is 1 variable in quadrant 1, namely attribute 1. This variable contains Application Capabilities. The variables included in this quadrant are attributes with a level of performance below the average (low), while the level of importance is high. The application developer should give attention to improvement to the attributes in this quadrant. LMS application managers should pay more attention to this variable. It is intended to increase the average performance by improving this variable.
Table 2. Gap Between Importance - Performance
|
No |
Indicator |
Gap |
|
1 |
Application Capabilities |
-0,80 |
|
2 |
Application features |
-0,30 |
|
3 |
Application Reliability |
-0,60 |
|
4 |
Application suitability |
-0,30 |
|
5 |
Durability |
-0,50 |
|
6 |
Ease of repair |
-0,70 |
|
7 |
The beauty/aesthetics of the application |
-0,10 |
|
8 |
Application perception |
-0,40 |
Then 4 variables are in quadrant 2. This quadrant contains variables with a high level of performance and a high level of importance. The recommended strategy is to maintain the current running system. These variables are variables 2, 3, 4 and 6, namely the Application features , application reliability, rpplication suitability and also ease of repair. With this assessment, the interests of the application have been fulfilled, as well as the suitability level of the application. Developers must maintain these four variables because they are in the Keep up the excellent work quadrant.
Table 3. Improvement Priority
|
No |
Indikator |
Action |
|
1 |
Application Capabilities |
Need |
|
2 |
Application features |
Keep it up |
|
3 |
Application Reliability |
Keep it up |
|
4 |
Application suitability |
Keep it up |
|
5 |
Durability |
Low Priority |
|
6 |
Ease of repair |
Keep it up |
|
7 |
The beauty/aesthetics of the application |
Very Low |
|
8 |
Application perception |
Very Low |
For quadrant 3 (low priority), there is 1 variable included in this section - Variable 5 or Durability. In this situation, the increase or improvement in this variable does not need to be prioritized.
While quadrant 4 (possible overkill) contains 2 variables, namely variables 7 and 8, which contain application aesthetics and application perceptions, variables in this quadrant have performance that is considered high. Still, users need to consider this attribute important enough. It is recommended that the resources spent on this variable be diverted to other variables more in need.
Based on table III, it can be seen the level of priority for the improvement of each variable. Point 1 is in the "necessary" phase, which means it must receive priority. Application capabilities must be immediately upgraded or adapted to user needs and technological developments. This condition should be the focus of the improvements made.
Then point 5 with low priority. Improvements regarding durability are also needed, but at a low priority level. For points 7 and 8, the priority is very low. Even though there needs to be improvement regarding the aesthetics of the application or the perception of the application, the priority is very low. Improvements can be made after those that have the highest priority come first.
For points 2,3,4 and point 6, the phase is at the "maintain" level, so there is no need for special treatment in repairs. Neither the performance, nor the level of importance – is considered sufficient by the user.
4. Conclusion
Based on the research, we can be concluded that the IPA Matrix can be used to evaluate a web-based LMS. The IPA Matrix results can show which attributes meet user needs and which need improvement. The IPA matrix also shows the gaps between what users expect and what exists. The IPA matrix also shows the size of the gap that occurs and the urgency of improvement for each attribute. The graphical depiction of 4 quadrants can make it easier for users to see the distribution of attributes based on ratings and positions in each quadrant. Graphical representation can clarify the spread of survey results and the difference between site importance and performance. In the LMS evaluation of university x in Southern Tangerang, we got 1 attribute with priority need, 1 low, 2 very low, and 4 keep it up attributes.
Acknowledgment
Thanks to LP2M for providing a grant to write the results of this research through an internal grant with the 2022 Research Contract Number: 002/PER-P2M/UPJ/05.22 at Pembangunan Jaya University, South Tangerang.
References LMS analysis using IPA Matrix for Web Applications
- B. Fetaji, M. Fetaji, M. Ebibi, and S. Kera, “Modern Education and Computer Science,” MECSJ. Mod. Educ. Comput. Sci., vol. 2, pp. 26–34, 2018, doi: 10.5815/ijmecs.2018.02.03.
- T. K. Saha, R. Shaharin, and U. K. Prodhan, “Modern Education and Computer Science,” Mod. Educ. Comput. Sci., vol. 2022, pp. 17–29, 2022, doi: 10.5815/ijmecs.2022.01.02.
- D. Sari, N. Moeliono, F. Oktafani, M. Fakhri, and R. Novirayanti, “Service Quality Analysis with Importance-Performance Analysis at Warunk Upnormal Bandung.”
- R. Cheung and M. Woo, “Determinants of Perceived Service Quality: An Empirical Investigation of Fitness and Recreational Facilities,” Contemp. Manag. Res., vol. 12, no. 3, pp. 363–370, Sep. 2019, doi: 10.7903/CMR.12369.
- S. M. Lee, W. Y. So, and H. S. Youn, “Importance-Performance Analysis of Health Perception among Korean Adolescents during the COVID-19 Pandemic,” Int. J. Environ. Res. Public Heal. 2021, Vol. 18, Page 1280, vol. 18, no. 3, p. 1280, Jan. 2021, doi: 10.3390/IJERPH18031280.
- P. Studi Manajemen, S. Yasmi, P. Studi Teknik Industri, and S. Tinggi Teknologi Bandung, “IMPORTANCE OF THE PERFORMANCE ANALYSIS (IPA) AND CUSTOMER SATISFACTION FOR DETERMINING THE SERVICE STRATEGIES THROUGH THE SERVQUAL MODEL APPROACH,” Manaj. dan Bisnis, vol. 18, no. 1, p. 1412, Mar. 2019, doi: 10.24123/jmb.v18i1.352.
- N. Karthiyayini, C. Rajendran, and M. Kumaravel, “Importance-performance analysis (IPA) for testing – and calibration – laboratories in India,” Benchmarking, vol. 25, no. 4, pp. 1232–1244, 2018, doi: 10.1108/BIJ-12-2016-0190.
- D. J. Ortinau, A. J. Bush, R. P. Bush, and J. L. Twible, “The Use of Importance-Performance Analysis for Improving the Quality of Marketing Education: Interpreting Faculty-Course Evaluations,” J. Mark. Educ., vol. 11, no. 2, pp. 78–86, 1989, doi: 10.1177/027347538901100213.
- H. Mastrisiswadi, D. N. Izzhati, and T. Talitha, “The use of importance-performance analysis for Indonesian smoked fish production strategy,” IOP Conf. Ser. Mater. Sci. Eng., vol. 403, no. 1, p. 012053, Sep. 2018, doi: 10.1088/1757-899X/403/1/012053.
- O. S. Tjitrohartoko and T. G. Saraswati, “Applying Importance Performance Analysis to Assess Customer Satisfaction: Mass Rapid Transportation in Indonesia,” Int. J. Manag. Entrep. Soc. Sci. Humanit., vol. 3, no. 1, pp. 16–23, Jun. 2020, doi: 10.31098/IJMESH.V3I1.138.
- Y. C. Lee, T. M. Yen, and C. H. Tsai, “Modify IPA for quality improvement: Taguchi’s signal-to-noise ratio approach,” TQM J., vol. 20, no. 5, pp. 488–501, 2008, doi: 10.1108/17542730810898458.
- T. M. Saviera, A. N. Hidayanto, and R. Kusumastuti, “Importance-performance analysis towards sustainable indigenous tourism (a lesson learned from Indonesia),” Int. J. Innov. Learn., vol. 31, no. 1, p. 91, 2022, doi: 10.1504/IJIL.2022.10043226.
- H. P. Ferreira and P. O. Fernandes, “Importance-performance Analysis Applied to a Laboratory Supplies and Equipment Company,” Procedia Comput. Sci., vol. 64, pp. 824–831, Jan. 2018, doi: 10.1016/J.PROCS.2015.08.634.
- H. L-H, F. S-Y, and Y. T-M, “Using Modified IPA to Improve Service Quality of Standard Hotel in Taiwan,” J. Serv. Sci. Manag., vol. 7, pp. 222–34, 2014.
- R. Ramadhani, R. Umam, A. Abdurrahman, and M. Syazali, “The effect of flipped-problem based learning model integrated with LMS-google classroom for senior high school students,” J. Educ. Gift. Young Sci., vol. 7, no. 2, 2019, doi: 10.17478/jegys.548350.
- R. I. Akbar, C. Anwar, and J. H. Siregar, “Training on the Use of Computer Applications in Making Learning Videos (Training for MTs Miftah Assa’adah Teachers),” JUDIMAS, vol. 1, no. 2, pp. 117–128, Feb. 2021, doi: 10.30700/JM.V1I2.1072.
- H. Y. Hu, Y. C. Lee, and T. M. Yen, “Amend importance-performance analysis method with Kano’s model and DEMATEL,” J. Appl. Sci., vol. 9, no. 10, pp. 1833–1846, 2019, doi: 10.3923/JAS.2009.1833.1846.
- F. J. Miranda, A. Chamorro, L. R. Murillo, and J. Vega, “An Importance-Performance Analysis of Primary Health Care Services: Managers vs. Patients Perceptions,” J. Serv. Sci. Manag., vol. 03, no. 02, pp. 227–234, 2010, doi: 10.4236/JSSM.2010.32028.
- H. Y. Hu, S. I. Chiu, C. C. Cheng, and T. M. Yen, “Applying the IPA and DEMATEL models to improve the order-winner criteria: A case study of Taiwan’s network communication equipment manufacturing industry,” Expert Syst. Appl., vol. 38, no. 8, pp. 9674–9683, Aug. 2021, doi: 10.1016/J.ESWA.2011.01.147.
- Y. C. Lee, T. M. Yen, and C. H. Tsai, “Using importance-performance analysis and decision making trial and evaluation laboratory to enhance order-winner criteria ̃ a study of computer industry,” Inf. Technol. J., vol. 7, no. 3, pp. 396–408, 2008, doi: 10.3923/ITJ.2008.396.408.
- R. I. Akbar, D. G. Purnama, A. Salsabila, and A. Salsabila, “IPA MATRIX METHOD FOR DETERMINING PRIORITIES FOR IMPROVEMENT OF SIAKAD SERVICE QUALITY ATTRIBUTES,” Pros. Semin. Nas. Penelit. LPPM UMJ, vol. 2022, no. 0, Oct. 2022, Accessed: Nov. 17, 2022. [Online]. Available: https://jurnal.umj.ac.id/index.php/semnaslit/article/view/14258.
- “IJERPH | Free Full-Text | Importance-Performance Analysis of Health Perception among Korean Adolescents during the COVID-19 Pandemic.” https://www.mdpi.com/1660-4601/18/3/1280 (accessed Nov. 18, 2022).
- T. M. Saviera, R. Kusumastuti, and A. N. Hidayanto, “Importance-performance analysis towards sustainable indigenous tourism (a lesson learned from Indonesia),” Int. J. Innov. Learn., vol. 31, no. 1, pp. 91–116, 2022, doi: 10.1504/IJIL.2022.119638.
- M. Mubasher Hassan, T. Mirza, and M. Waseem Hussain, “Education and Management Engineering,” Educ. Manag. Eng., vol. 5, pp. 17–27, 2020, doi: 10.5815/ijeme.2020.05.03.
- “From students with love_ An empirical study on learner goals, self-regulated learning and sense-making of learning analytics in higher education | Elsevier Enhanced Reader.” https://reader.elsevier.com/reader/sd/pii/S1096751620300348?token=7FCBBFDF434A38F06D93B3EA40CAF16DCB00F4E3CCADF86DD135656F08003C8E94C0ED3008EE5D72E1E5C8E028F6DFC2&
- originRegion=eu-west-1&originCreation=20210506072325 (accessed May 06, 2021).
