Long Range Forecast on South West Monsoon Rainfall using Artificial Neural Networks based on Clustering Approach

Author: Maya L. Pai, Kalavampara V. Pramod, Alungal N. Balchand
Journal: International Journal of Information Technology and Computer Science(IJITCS) @ijitcs
Article in issue: 7 Vol. 6, 2014.
Free access
The purpose of this study is to forecast Southwest Indian Monsoon rainfall based on sea surface temperature, sea level pressure, humidity and zonal (u) and meridional (v) winds. With the aforementioned parameters given as input to an Artificial Neural Network (ANN), the rainfall within 10x10 grids of southwest Indian regions is predicted by means of one of the most efficient clustering methods, namely the Kohonen Self-Organizing Maps (SOM). The ANN is trained with input parameters spanning for 36 years (1960-1995) and tested and validated for a period of 9 years (1996-2004). It is further used to predict the rainfall for 6 years (2005-2010). The results show reasonably good accuracy for the summer monsoon periods June, July, August and September (JJAS) of the validation years.
South West Monsoon, Clustering, Artificial Neural Networks, Self-Organizing Map
Short address: https://sciup.org/15012109
IDR: 15012109
Text of the scientific article Long Range Forecast on South West Monsoon Rainfall using Artificial Neural Networks based on Clustering Approach
Published Online June 2014 in MECS
Monsoon is an outstanding tropical phenomenon of the Indian sub-continent. The forecast of the Indian summer monsoon rainfall (JJAS) has been very crucial and advantageous for farmers. The south-west winds (often known as the southwest monsoon) blowing from the Indian Ocean onto the Indian landmass during the months of June through September is generally rain bearing winds that bring rainfall to most parts of the subcontinent. They split into two branches, namely, the Arabian Sea Branch and the Bay of Bengal Branch near the southernmost end of the Indian Peninsula. On the other hand, oceanographically, the Indian Ocean is the least explored of the major oceans. The Indian monsoon depends on many pre-monsoon factors of the Indian Ocean [1-3]. The empirical forecasting of the Indian monsoon has been achieved using a combination of climatic parameters, including the atmospheric pressure, the wind, the Sea Surface Temperature (SST), the snow cover and the phase of the El Niño–Southern Oscillation ENSO [4, 5]. Regression models based on these and other empirical correlations have been able to predict 60% – 80% of the total seasonal Indian rainfall by the month of May preceding the summer monsoon [6]. SST has been recognized as an important oceanic parameter because it directly influences the air-sea exchange of heat. The other parameters of interest are the Sea Level Pressure (SLP), the Humidity, and the U- and V-winds.
The initial work on Asian monsoon prediction was conducted by Walker [7] followed by several attempts [810] leading to the development of better models towards long range forecast of summer monsoon rainfall over India. For instance, the parametric and power regression models used [10] gave reasonably accurate results. These models are used by the India Meteorological Department (IMD) for long range forecasts for India. But these statistical models have some limitations. So attempts were made to develop better, alternate techniques for long range forecasts of Indian Summer Monsoon Rainfall (ISMR). The 8 parameter Hybrid Principal Component Model was developed [11] by using a 30-year (1958-87) training period and a 10-year (1988-97) verification period. An artificial intelligence approach for regional rainfall forecasting for Orissa (Indian state), on monthly and seasonal time scales was attempted [1]. In that study, the possible relation between regional rainfall over Orissa and the large scale climate indices like EL- Niño Southern oscillation (ENSO), Equatorial Indian Ocean Oscillation (EQUINOO) and a local climate index of ocean – land temperature contrast were first studied and then used to forecast monsoon rainfall. The time series of all India summer monsoon rainfall was generated by area weighting the rainfall at 306 rain gauges across the country [12, 13] and the empirical modeling approaches were used to forecast ISMR. [14] gives a general overview of forecasting models for ISMR. Later, [15] and [16] presented reviews on such empirical models.
The authors [17] explore the recent applications of Neural Networks (NN) and Artificial Intelligence (AI) and provides an overview of the field; they have discussed the critical role of NN and AI in different areas. Neural networks that model complex relationships between inputs and outputs or to find patterns in data have been employed in the past for rainfall prediction. ANNs have the capability of capturing complex nonlinearity in time series and also in prediction. In this context, the usefulness of NN for real time numeral recognition involved 150 online numerals written in different styles by 10 different persons and obtained accuracy ranging from 97% to 100% for different resolution of the input vectors [18]. Of course, NN technique learns the dynamics within the time series data [19]. In the early twentieth century, ANN’s were used to predict ISMR [19-21]. The time series approach was used to predict future values by [19]. Whereas in [20], the authors have predicted the Indian monsoon rainfall with the help of some predictors and compared the result with linear regression technique, a hybrid principal component and neural network approach to predict ISMR [21]. The ANN technique was applied to the monthly time series of June, July, August and September rainfall in [16] and it was noted that this gave better results compared to regression models. The ANN prediction for ISMR has also been carried out in [22]. Herein, the authors had divided the whole time series into two – the linear part and the non-linear part and applied ANN to the nonlinear part. However the above attempts have been limited to local/regional theatres and have limited predictive values. In this paper we have considered pre-monsoon oceanic factors, namely SST, SLP, humidity and the U- and V-winds components to predict the rainfall over southwestern sector of India. We propose a new model to forecast rainfall using the aforementioned parameters.
The rest of the paper is organized as follows: Section II deals with the analytical tools applied for data analysis and the methodology adopted. The results and discussion on the prediction of the south west monsoon by ANN are put forth in Section III. The concluding remarks are given in Section IV.
-
II. Materials and methods
-
A. Data
The data for this paper was collected from the International Comprehensive Ocean-Atmosphere DataSet (ICOADS) site [29] in 10 x 10 grids of the Indian ocean region (0.50- 24.50 N and 50.50- 77.50 E) for the parameters SST, SLP, Humidity, U-wind and V-wind (25 x 28 grids). The rainfall during the monsoon months of JJAS over south west India (8.50- 22.50 N and 74.5078.50 E) depends predominantly on pre-monsoon months, March to May (MAM) and the factors are: SST, SLP, Humidity, U-wind and V-wind over the Indian Ocean. The 10 x 10 gridded rainfall data (cumulative of monthly averages, in mm) of the monsoon period JJAS, for the Indian region is obtained from the India Meteorological
Department (IMD) site [30]. The south-west region of India is pooled out from this for rainy grids.
-
B. Artificial Neural Network
The most common neural network model is the Multi Layer Perceptron (MLP). The MLP is known as a supervised network because it requires knowledge of the desired output in order to learn. The goal of such a network is to create a model that correctly maps the input to the output using historical data so that the model can then be used to generate the desired output when it is unknown.
-
C. Self- Organizing Map
A Self Organizing Map (SOM) is a clustering and data visualization technique based on neural networks. The aim of an SOM is to find a set of centroids and to assign each object in the data set to the centroid that is closest to that object. In fact, in the current work, there is one neuron associated with each centroid. Unlike a NN, the SOM is an unsupervised learning technique.
-
D. Methodology
The raw weather data at hand may be considered to be in the form of a time series. The raw data requires preprocessing as 25% of each of the parameter values were missing. To preserve smoothness and consistency, the missing values are filled by spline interpolation and the outliers resulting from the interpolation are replaced by the available extreme values. We have considered a total of 36 years (1960-1995) of data for training the Neural Network (NN) and another nine years (1996-2004) for validation. Since it is difficult to analyze such a large amount of data separately, we employ clustering [23-25] to help us improve understanding of natural climate processes. The rainfall data is clustered into 10 clusters using SOM and the said clustering is implemented using the SOM toolbox in MATLAB. The clusters are labeled different, specific colors. The network had 40 hidden layers and each neuron in the network used a Levenberg-Marquardt activation function. Seventy nets were generated using the feed-forward back propagation algorithm and the net converged after 500 iterations. Having trained the NN and tested and validated the same, it is further used to predict the rainfall in the 10 x 10 grids of south west India for the years 2005-2010.
For clarity, a flowchart is given in Fig. 1 which shows the major steps involved in rainfall prediction right from preprocessing till the testing of the NN.
To assess the quality of results and to evaluate the preformance of the NN, we have used the following performance criteria that are given below.
-
E. Performance evaluation of the ANN model
-
1) Root Mean Square Error
-
/У ( y - У- ) 2
RMSE = J i (1)
N where y are the observed values, yˆ are the predicted values for rainfall and N is the number of observations.
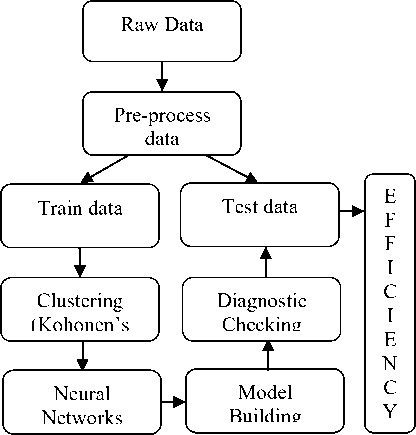
Fig. 1. Flow chart on data processing
-
2) The normalized root-mean-square error (NRMSE) is the RMSE divided by the range of observed values of a variable being predicted and is expressed as a percentage.
NRMSE =
RMSE
x max x min
where and x are the maximum and minimum max min values of the observed values.
-
3) Mean Absolute Error (MAE)
-
У- - У
- MAE = '— (3)
N where y are the observed values, yˆ are the predicted values for rainfall and N is the number of observations.
-
4) Accuracy = 100 - RMSE (4)
-
III. Results
By adopting the technique of clustering, based on ANNs, the rainfall in Southwest India has been successfully hind-casted, and later used for forecasting. The visualizations of the clusters of the actual and predicted rainfall are shown in Figs. 2 to 10. Figs. 2 and 3 show the actual and predicted clusters for the year 1960, Figs. 4 and 5 for 1971, Figs. 6 and 7 for 1982, Figs. 8 and 9 for the year 1995 and Figs. 10 and 11 for 2004. Fig. 12 is the plot of the actual and predicted rainfall for the year 2004. Fig. 13 is the probability plot of the residuals corresponding to the rainfall of the year 2004. Having trained and validated the NN with data of 36 and 9 years respectively, it is further tested for the years 2005-2010. Figs. 14, 15 and 16 show the respective rainfall clusters for the years 2005, 2007 and 2010 obtained from the
model. Table 1 shows the comparison of the ANN forecasted rainfall of a few grids with the observed rainfall for the months JJAS. It can be seen that except for some grids, the model results are fairly accurate and this model predicts the trials reasonably well during the testing period. The error and accuracy for the entire validation period of 9 years are shown in Table 2. It is directly evident from the performance results of this model that at RMSE 8.8 %, the predicted results are excellent. The present ANN model has performed comparatively better than such other models [1, 2, 11, 27].
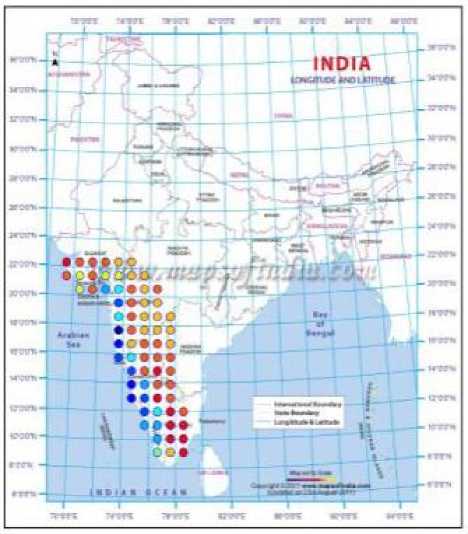
Fig. 2. Clusters based on the actual data for the year 1960
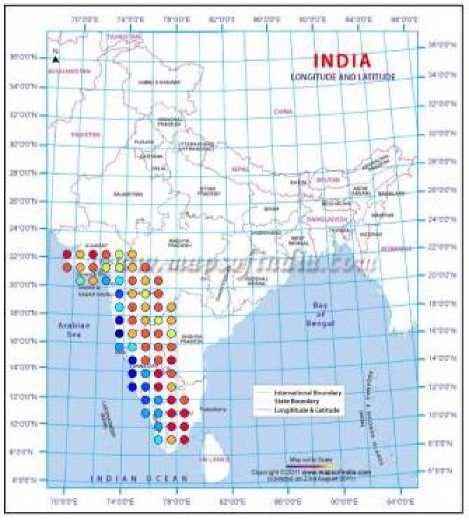
Fig. 3. Predicted clusters for the year 1960
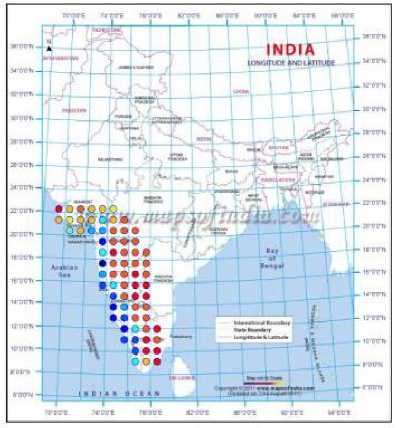
Fig. 4. Clusters based on the actual data for the year 1971

Fig. 7. Predicted clusters for the year 1982
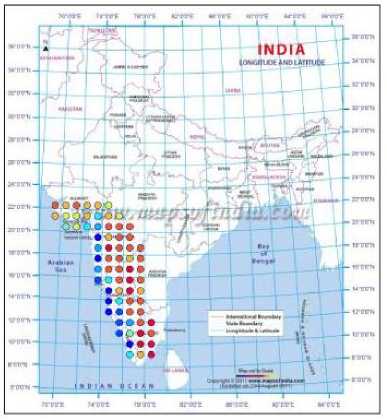
Fig. 5. Predicted clusters for the year 1971

Fig. 8. Clusters based on the actual data for the year 1995
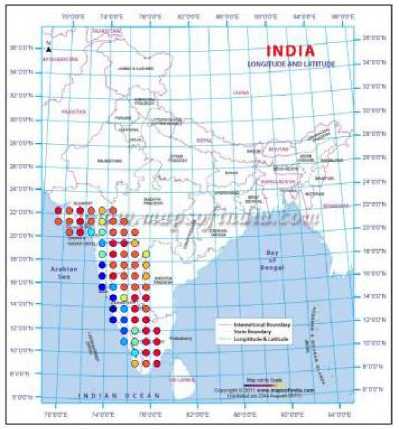
Fig. 6. Clusters based on the actual data for the year 1982

Fig. 9. Predicted clusters for the year 1995
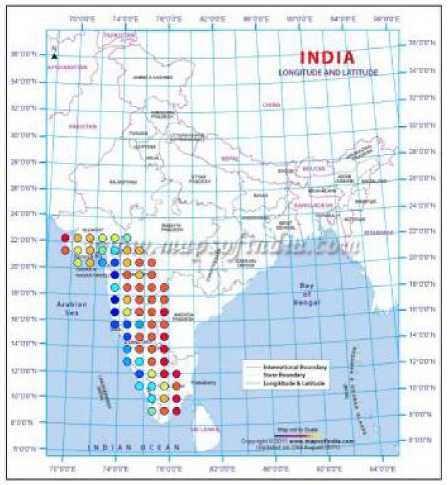
Fig. 10. Clusters based on the actual data for the year 2004
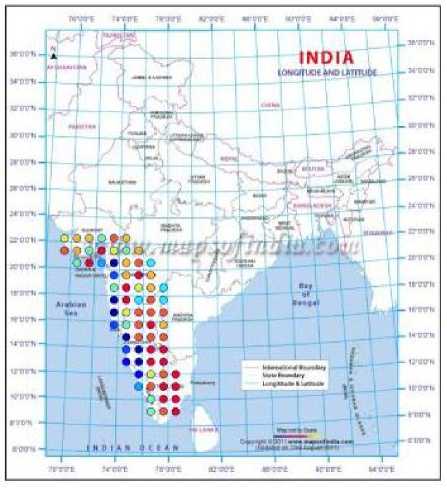
Fig.11. Predicted clusters for the year 2004
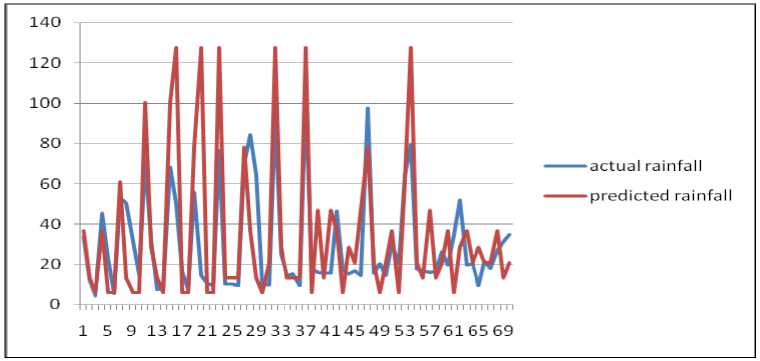
Fig. 12. Actual rainfall and predicted rainfall for the year 2004
Probability Plot of residuals
Normal - 95% CI
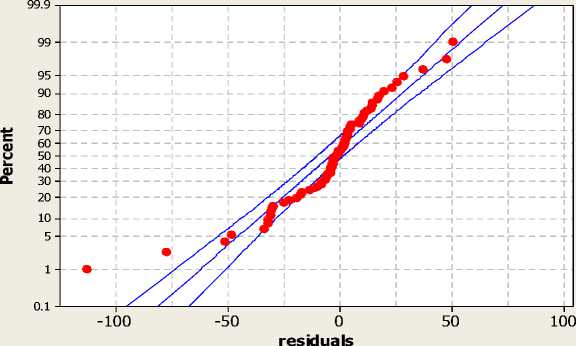
Mean -4.338
StDev 24.86
N 70
AD 2.225
P-Value <0.005
Fig. 13. Probability plot of the residuals for the year 2004

Fig. 14. Predicted clusters for the year 2005

Fig. 15. Predicted clusters for the year 2007
Table 1. Prediction of rainfall in mm
|
Year |
Longitude |
Latitude |
Actual Rainfall (mm) |
Actual Clusters |
Predicted Clusters |
Predicted Rainfall(mm) |
|
2004 |
76.5 |
8.5 |
33.71 |
6 |
6 |
36.60 |
|
2004 |
77.5 |
8.5 |
12.26 |
9 |
9 |
13.47 |
|
2004 |
78.5 |
8.5 |
4.42 |
10 |
10 |
5.94 |
|
2004 |
76.5 |
9.5 |
45.24 |
5 |
6 |
36.60 |
|
2004 |
77.5 |
9.5 |
22.77 |
8 |
10 |
5.94 |
|
2004 |
78.5 |
9.5 |
5.52 |
10 |
10 |
5.94 |
|
2004 |
75.5 |
10.5 |
53.12 |
5 |
4 |
61.02 |
|
2004 |
76.5 |
10.5 |
50.61 |
5 |
9 |
13.47 |
|
2004 |
77.5 |
10.5 |
31.25 |
7 |
10 |
5.94 |
|
2004 |
78.5 |
10.5 |
14.88 |
9 |
10 |
5.94 |
|
2004 |
75.5 |
11.5 |
70.67 |
3 |
2 |
100.29 |
|
2004 |
76.5 |
11.5 |
32.2 |
7 |
7 |
28.46 |
|
2004 |
77.5 |
11.5 |
7.71 |
10 |
9 |
13.47 |
|
2004 |
78.5 |
11.5 |
8.36 |
10 |
10 |
5.94 |
|
2004 |
74.5 |
12.5 |
68.40 |
4 |
2 |
100.29 |
|
2004 |
75.5 |
12.5 |
50.12 |
5 |
1 |
127.50 |
|
2004 |
76.5 |
12.5 |
16.40 |
9 |
10 |
5.94 |
|
2004 |
77.5 |
12.5 |
7.54 |
10 |
10 |
5.94 |
|
2004 |
74.5 |
13.5 |
55.81 |
4 |
3 |
78.17 |
|
2004 |
75.5 |
13.5 |
14.67 |
9 |
1 |
127.50 |
|
2004 |
76.5 |
13.5 |
10.69 |
9 |
10 |
5.94 |
|
2004 |
77.5 |
13.5 |
9.59 |
10 |
10 |
5.94 |
|
2004 |
74.5 |
14.5 |
76.64 |
3 |
1 |
127.50 |
|
2004 |
75.5 |
14.5 |
10.42 |
9 |
9 |
13.47 |
|
2004 |
76.5 |
14.5 |
10.43 |
9 |
9 |
13.47 |
|
2004 |
77.5 |
14.5 |
9.59 |
10 |
9 |
13.47 |
|
2004 |
73.5 |
15.5 |
69.90 |
3 |
3 |
78.17 |
|
2004 |
74.5 |
15.5 |
84.44 |
3 |
6 |
36.60 |
|
2004 |
75.5 |
15.5 |
64.30 |
4 |
9 |
13.47 |
|
2004 |
76.5 |
15.5 |
10.43 |
9 |
10 |
5.94 |
|
2004 |
77.5 |
15.5 |
9.79 |
9 |
8 |
20.92 |
|
2004 |
73.5 |
16.5 |
93.96 |
2 |
1 |
127.50 |
|
2004 |
74.5 |
16.5 |
24.90 |
7 |
7 |
28.46 |
Table 2. Calculated Error Measures
NRMSE RMSE MAE Accuracy
0.088 8.8% 8.3 91.2%
Fig. 16. Predicted clusters for the year 2010
-
IV. Conclusion
Highly influencing oceanic parameters have been selected to predict the south west monsoon rainfall via a clustering based ANN technique. The model was trained for 36 years, followed by validation of 9 years and subsequent testing for a period of 6 years. The overall results are promising and indicate the fact that the method can be applied as a meaningful tool for work involving rainfall prediction. The analysis of the data for the years 1960 and 1982 indicate close match between the actual and predicted clusters. Further, from Fig.12, we observe that the scrutiny of data for the year 2004 also indicates a reasonably good match between the actual and predicted values which is exemplified in Fig.13 on the probability plot of residuals.
Acknowledgement
The authors thank the India Meteorological Department (IMD) for the data and CUSAT for the facilities. Maya thanks Amrita School of Arts and Sciences for permission to carry out the work. The authors would also wish to thank the reviewers for their valuable comments that helped to enhance the quality of the material presented in this paper.
References Long Range Forecast on South West Monsoon Rainfall using Artificial Neural Networks based on Clustering Approach
- D. Nagesh Kumar, M. Janga Reddy and R. Maity, “Regional rainfall forecasting using large scale climate Teleconnections and artificial intelligence techniques,” Journal of Intelligent Systems, vol. 16, no. 4, pp. 307-321, 2007.
- A. H. Agboola, O. Iyare and S. O Falaki, “Iyare 6 An artificial neural network model for rainfall forecasting in South- Western Nigeria,” Canadian Journal on computing in Mathematics, Natural Sciences, Engineering and Medicine, vol. 3, no. 6, pp. 188-196, 2012.
- K. Krishna Kumar, M. K. Soman and K. Rupa Kumar, “Seasonal forecasting of Indian summer monsoon rainfall: A review,” Indian Institute of Tropical Meteorology 2010.
- B. Parthasarathy, H. F. Diaz and J. K. Eischeid, “Prediction of all India summer monsoon rainfall with Regional and large scale parameters,” Journal of Geophysics Research, vol. 93, no. 5, pp. 5341-5350, 1988.
- J. Shukla and D. A. Mooley, “Empirical prediction of the summer monsoon rainfall over India,” Monsoon Weather Review, vol. 115, pp. 695-703, 1987.
- S. Hastenrath, “Climate dynamics of the tropics,” An updated edition of climate and circulation of the Tropics, Kluwer Academic Publishers, Norwell, MA, pp. 488, 1994.
- G. T. Walker, “Correlation in seasonal variations of weather II,” Mem. India Met. Dep., XXI.XXII, 1910.
- V. Thapliyal, “Stochastic dynamic model for long range prediction of monsoon rainfall in Peninsular India,” Mausam, vol. 33, pp. 399-404, 1982.
- V. Gowariker, V. Thapliyal, R. P. Sarkar, G. S. Mandal and D. R. Sikka, “Parametric and power regression models: New approach to long range forecasting of monsoon rainfall in India,” Mausam, vol.40, pp. 115-122, 1989.
- V. Gowariker, V. Thapliyal, S. M. Kulshrestha, G. S. Mandal, S. N. Roy and D. R. Sikka, “A power regression model for long range forecast of southwest monsoon rainfall over India,” Mausam, vol. 42, pp. 125-130, 1991.
- P. Guhathakurta, M. Rajeevan and V. Thapliyal, “Long range forecasting Indian summer monsoon rainfall by a hybrid principal component neural network model,” Meteorol, Atmospheric Physics, vol. 71, pp. 255-266, 1999.
- B. Parthasarathy and O. N. Dhar, “Climate fluctuations over Indian region-rainfall: a review,” Research report no: RR-025, Indian Institute of Tropical Meteorology, Pune 31, 1978.
- D. A. Mooley and B. Parthasarathy, “Variability of the Indian summer monsoon and Tropical circulation features,” Monthly Weather Review III, pp. 967-968, 1984.
- S. Gadgil, J. Srinivasan, R. S. Nanjundiah, K. K. Kumar, A. A. Munot and K. RupaKumar, “On forecasting the Indian summer monsoon: the intriguing season of 2002,” Current Science, vol. 83, pp. 394–403, 2002.
- K. K. Kumar, M. K. Soman and K. Rupa Kumar, “Seasonal forecasting of Indian summer monsoon rainfall: A review,” Weather, vol. 50, pp. 449–467, 1995.
- A. K. Sahai, M. K. Soman and V. Satyan, “All India summer monsoon rainfall prediction using an artificial neural network,” Climate Dynamics, vol. 16, pp. 291-302, 2000.
- K. Kumar, Gour Sundar Mitra Thakur, “Advanced Applications of Neural Networks and Artificial Intelligence: A Review” International Journal of Information Technology and Computer Science (IJITCS), vol. 4, pp. 57-68, 2012.
- S. B. Patil and G. R. Sinha, “Real Time Handwritten Marathi Numerals Recognition Using Neural Network,” International Journal of Information Technology and Computer Science (IJITCS), vol. 4, No. 12, pp. 76-81, 2012.
- J. B. Elsner and A. A. Tsonis, “Nonlinear prediction, chaos and noise,” Bulletin of the American Meteorological Society, vol. 73, pp. 49-60, 1992.
- P. Goswami and Srividya, “A novel neural network design for long range prediction of rainfall pattern,” Current Science, vol. 70, pp. 447-457, 1996.
- Venkateswan, S. D. Raskar, S. S. Tambe, B. D. Kulkarni and R. N. Kesavamurthy, “Prediction of all India summer monsoon rainfall using error-back-propagation neural networks,” Meteorological Atmospheric Physics, vol. 62, pp. 225-240, 1997.
- P. Guhathakurta, M. Rajeevan and V. Thapliyal, “Long range forecasting Indian summer monsoon rainfall by a hybrid principal component neural network model,” Meteorological Atmospheric Physics, vol. 71, pp. 225-266, 1999.
- R. N. Iyengar and S. T. G. Raghu Kanth, “Intrinsic mode functions and a strategy for forecasting Indian monsoon rainfall,” Meteorological Atmospheric Physics, vol. 90(1-2), pp. 17-36, 2005.
- T. Nocke, H. Schumann and U. Bohm, “Methods for the visualization of clustered climate data,” Computational Statistics, vol. 19, no.1, pp. 75-94, 2004.
- P. Dostal and P. Pokorny, “Cluster analysis and Neural Networks,” Department of Informatics Brno University of Technology and Institute of Mathematics, Brno University of Technology.
- Sarah. N. Kohail and Alaa M. El-Halees, “Implementation of Data mining techniques for Meteorological data analysis”, The Islamic University of Gaza, International journal of Information and communication Technology Research, vol. 1, no. 3, pp. 96-100, 2011.
- Han Jiawei, Kamber Miheline and Pei Jian, Data mining concepts and techniques 3rd edition, pp. 567-571.
- H. Witten Ian and Frank Eibe, Data mining - Practical machine tools and techniques, 2nd edition.
- V. Thapliyal, “Long range prediction of summer monsoon rainfall over India,” Evolution and development of new models, Mausam, vol. 91, pp. 339-346, 1990.
- http://www.esrl.noaa.gov/psd/data/gridded/data.coads.1deg.html.
- http://www.imdpune.gov.in.
