Management of Achilles tendon rupture: surgical versus conservative method

Author: Wijaya N., Putri N., Mahadhana S., Dharmayuda C., Aryana I., Dusak I., Subawa I.W.
Journal: Гений ортопедии @geniy-ortopedii
Section: Обзорная статья
Article in issue: 5 т.31, 2025.
Free access
Introduction Current therapy for managing achilles tendon rupture are classified into surgical and conservative method. Randomized controlled trials were performed in multiple healthcare facilities in multiple centers across the world yet functional outcomes, re-rupture rate and complications are still indecisive. The aim of this study is to compare surgical versus conservative methods for the treatment of acute Achilles tendon rupture; including functional outcome, re-rupture rate, and complications to provide better guidance in selecting therapeutic method. Materials and Methods We conducted a comprehensive electronic database. Original articles until November 2023 were screened, focusing on randomized controlled trials with at least 12 months follow up. Our protocol has been registered at PROSPERO ID (CRD42023486152). Results and Discussion The initial search yielded 354 studies. Twelve randomized controlled trials study with a total of 1525 participants were assessed. Surgical treatment has better outcomes for preventing: re rupture (p ≤ 0.001), abnormal ankle movement (p ≤ 0.001), and calf muscle atrophy (p = 0.005). Functional outcomes at 6 months follow-up were better for hopping (p ≤ 0.001), heel-rise height (p ≤ 0.001), and heel rise work (p = 0.007) in surgical treatment. Functional outcomes at 12 months of follow-up were better only for heel rise work test (p ≤ 0.001) in surgical treatment. However, incidence of sural nerve injury (p = 0.006) was found lower in the conservative group. Complications other than re-rupture (p = 0.08) had no significant difference between two groups. At 6-month follow-up, functional outcome tends to be better compared to conservative management of Achilles tendon rupture. At 12-month follow-up, functional outcomes was comparable between two groups. However, the risk of re- rupture rate is higher in the conservative management. Conclusion Reduced rates of re-rupture and quicker functional recovery are benefits of surgical repair. Conservative treatment can yield good results in terms of functional outcomes and re-rupture rates in long term follow up, particularly when combined with contemporary rehabilitation procedures. Conservative treatment eliminates the hazards associated with surgery, but it may have a slightly higher chance of re rupture and a shorter initial recovery of some functional outcomes. Both of these treatment methods are good for treating Achilles tendon rupture. Level of Evidence: I.
Achilles Tendon Rupture, Surgical Management, Conservative Management, Functional Outcome, Re-rupture
Short address: https://sciup.org/142246017
IDR: 142246017 | UDC: [616.74-018.38-001.48]-08-035-089.168 | DOI: 10.18019/1028-4427-2025-31-5-666-677
Лечение пациентов с разрывом ахиллова сухожилия: хирургический или консервативный метод
Аннотация Введение. Современные методы лечения пациентов с разрывом ахиллова сухожилия подразделяют на хирургические и консервативные. Рандомизированные контролируемые исследования проведены во многих медицинских учреждениях по всему миру, однако до сих пор не определена зависимость функциональных результатов, повторных разрывов и осложнений от методов лечения. Цель работы — сравнить функциональные результаты, частоту повторных разрывов и осложнений при хирургических и консервативных методах лечения пациентов с острым разрывом ахиллова сухожилия, сформулировать рекомендации по выбору метода лечения. Материалы и методы. Отобраны оригинальные статьи, опубликованные до ноября 2023 года, включены рандомизированные контролируемые исследования с периодом наблюдения не менее 12 месяцев. Первоначальный поиск выявил 354 исследования. Оценено 12 рандомизированных контролируемых исследований с общим числом пациентов 1525. Протокол исследования зарегистрирован в PROSPERO ID (CRD42023486152). Результаты и обсуждение. Хирургическое лечение имеет лучшие результаты для предотвращения повторного разрыва (p ≤ 0,001), аномальных движений в голеностопном суставе (p ≤ 0,001) и атрофии икроножных мышц (p = 0,005). Функциональные результаты через шесть месяцев были лучше после хирургического лечения: при прыжках (p ≤ 0,001), в высоте подъема пятки (p ≤ 0,001) и тесте подъема пятки (p = 0,007). Функциональные результаты через 12 месяцев после хирургического лечения были лучше только для теста подъема пятки (p ≤ 0,001). Частота повреждения малоберцового нерва (p = 0,006) была ниже в группе консервативного лечения. Частота других осложнений, кроме повторного разрыва (p = 0,08), существенно не различалась между группами. При наблюдении через шесть месяцев пациенты после хирургического лечения, как правило, демонстрировали лучший функциональный результат. Через 12 месяцев наблюдения функциональные результаты в группах были сопоставимы. Риск повторного разрыва был выше при консервативном лечении. Заключение. Снижение частоты повторного разрыва и более быстрое восстановление функциональных результатов являются преимуществами хирургического лечения. Консервативное лечение демонстрирует хорошие функциональные результаты при долгосрочном наблюдении, особенно в сочетании с современными реабилитационными процедурами. Консервативное лечение устраняет риски, связанные с хирургическим вмешательством, но может иметь несколько более высокий риск повторного разрыва и более короткий начальный период восстановления некоторых функциональных результатов. Оба метода лечения эффективны при лечении разрыва ахиллова сухожилия. Уровень доказательности: I.
Text of the scientific article Management of Achilles tendon rupture: surgical versus conservative method
Achilles tendon is the strongest and largest tendon in the human body. This tendon plays an important role of supporting heel movement. Its rupture often occurs during sport activities and excessive exercise [1]. The rupture of this tendon is associated with inability of lifting the heel and decreased range of movement of the knee. The rupture of this tendon also causes severe pain that decreases one’s quality of life [2]. Hence, proper, and adequate management of Achilles tendon rupture is needed.
Rupture of the Achilles tendon is commonly found in the adult population. The rising incidence of Achilles tendon rupture can be linked to increased number of sport activities throughout the years. Annually, up to 40 out of 100.000 population reported incidence of Achilles tendon rupture. Seventy three percent of Achilles tendon rupture was reported in recreational sport and 18 % was reported in athletes [3].
Randomized controlled trials were performed in numerous healthcare facilities across the world, yet functional outcomes and complications rate are still indecisive. Although the surgical method of its management results in better outcomes such as lower risk of re-rupture as compared to the conservative method, complications that follow were also higher in surgical management [4, 5, 6]. Hence, we conducted a systematic review and meta-analysis to compare surgical versus conservative methods for the treatment of acute Achilles tendon rupture; including re-rupture rate, complications and functional outcomes to provide better guidance in selecting the therapeutic method.
MATERIALS AND METHODS
Inclusion and Exclusion Criteria
We conducted this systematic review following the PRISMA and Cochrane handbook guidelines for conducting a systematic review of interventions. Our protocol has been registered at PROSPERO ID (CRD42023486152). This research includes a direct comparative study between surgical and conservative method for managing Achilles tendon rupture in adult population. We included original clinical studies which were written in English and available in full text. Systematic reviews, meta-analyses, case reports, expert opinions, abstract conferences, book chapters, letters to editor, summaries of meetings, study protocols, technical reports, narrative reviews, studies with incomplete data, experimental studies on animals, and cadavers, laboratory ( in vitro ), duplication of publications, and computational studies are not included in this research. The population used in this study was adults diagnosed with Achilles tendon rupture who underwent either surgical or conservative treatment. Randomized Controlled Trials (RCTs) with at least 1 year follow-up comparing surgical intervention with conservative method were assessed. The exclusion criteria include patients with re-rupture, rupture caused by pathological aspect, research with insufficient primary outcome data, and research using combined approaches. Re-rupture rate, complications, functional outcome were assessed.
Search Strategy
We conducted a comprehensive electronic database search until November 2023 in PubMed, MEDLINE, and ScienceDirect using the keywords “Surgical versus Nonsurgical” OR “Operative versus Nonoperative” OR “Surgical versus Conservative” OR “Operative versus Conservative” AND “Achilles Tendon Rupture” OR “Rupture Tendon Achilles”. Based on the PICO (Patient, Intervention, Comparison, Outcome) concept, our research strategy concept is as follows:
P = Adults aged above 16 years old diagnosed with Achilles tendon rupture who underwent surgical or conservative treatment;
I = Surgical and conservative methods;
C = Surgical versus conservative method;
O = Re-rupture rate, complications, functional outcome, pain score.
Study Selection
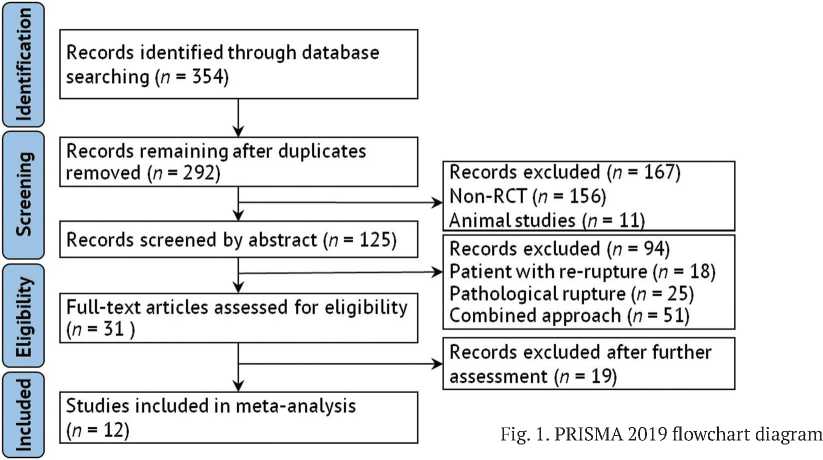
The literature selection was performed by 2 reviewers (NSNW and NLPSWP) independently using the standardized study selection forms. A third reviewer (IWS) would be consulted, and a decision would be made through discussion if there was any disagreement between the first two reviewers. Our literature search identified a total of 354 studies, and after excluding irrelevant and duplicate reports, the remaining 125 articles were assessed using eligibility criteria after reading the full text. Finally, 12 eligible RCTs were included in our meta-analysis [6–17]. A PRISMA flow chart of the article selection steps is shown in Figure 1.
Data Extraction
Two authors (NSNW and SM) independently extracted data from eligible studies by completing a pre-designed data form, with discrepancies being arbitrated by a third reviewer (CGOD, IGNWA, IWSD, IWS). The primary outcomes extracted from each study included the re-rupture rate, complications, and functional outcome.
Methodological Assesment
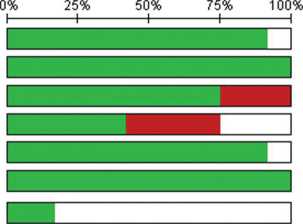
Bias analysis was carried out by 2 reviewers (NSNW and NLPSWP) using the risk of bias tools formulated by the Cochrane group. For Randomized Controlled Trial (RCT) studies, we used the second version of the Cochrane tool, Risk of Bias (ROB). Potential causes of bias were assessed with signaling questions to detect biases caused by the randomization process, deviation from initial intervention intent, missing data, measurement of outcomes, and reporting of selective bias. Disagreements were resolved by consulting the third reviewer (IWS). The Cochrane risk of bias consists of 6 items (randomization generation, allocation concealment, blinding of participant and personnel, blinding of outcome assessment, incomplete outcome data, selective reporting). Based on the analysis performed, it revealed that most studies showed a low risk of bias in the majority of domains (Fig. 2).
□ Low risk of bias | High risk of bias | Unclear risk of bias
|
• |
• |
• |
• |
• |
• |
• |
• |
• |
• |
• |
|
|
• |
• |
• |
• |
• |
• |
• |
• |
• |
• |
• |
• |
|
• |
• |
• |
• |
• |
• |
• |
• |
• |
• |
• |
|
|
• |
• |
• |
• |
• |
• |
• |
• |
• |
|||
|
• |
• |
• |
• |
• |
• |
• |
• |
• |
• |
• |
|
|
• |
• |
• |
• |
• |
• |
• |
• |
• |
• |
• |
• |
|
• |
• |
Random sequence generation (selection bias) Allocation concealment (selection bias)
Blinding of participants and personnel (performance b
Blinding of outcome assessment (detection bias) Incomplete outcome data (attrition bias)
Selective reporting (reporting bias)
Other bias
-
Fig. 2. Risk of bias summary and graph
Statistical Analysis
Odds ratios (ORs) were assessed with a 95 % confidence interval (CI) for the data. Heterogeneity (inconsistency) was analyzed using the Chi2 and I2 tests. A low p -value result ( p < 0.1) of the Chi2 test indicates significant heterogeneity. Because the Chi2 test has a low detection ability in a small sample of data, we also used the I2 test to assess heterogeneity. An I2 test score of more than 50 % has significant heterogeneity. Statistical analyses were performed using the Review Manager (RevMan)® version 5.4.1. If the heterogeneity test results showed no significant heterogeneity, we planned to use the fixed-effect models. Otherwise, the researchers used random-effect models to process the data.
RESULTS
Study Characteristics
Twelve studies were qualified and are included to inclusion criteria. A total of six studies were multicenter and the other six were single-center studies. The total number of patients in those studies was 1.525 patients. Of the twelve studies included in this study, it was found that 1.215 patients (79.7 %) were male, and 310 patients (20.3 %) were female. Further details are elaborated in Table 1 and Table 2. Table 3 presents a summary of the findings from this study.
Table 1
|
Name of study, Year |
Center(s); Country |
Follow-up Duration |
Type of Surgery |
Type of Conservative Method |
|
I. Lantto et al., 2016 [6] |
Single, Finland |
18 |
Open repair |
Plaster Cast and orthosis |
|
R. Cetti et al., 1993 [7] |
Multi, Denmark |
30 |
Open repair |
Plaster Cast |
|
S. Fischer et al. 2020 [8] |
Single, Germany |
24 |
Open repair and Minimally Invasive Surgery |
Plaster Cast and orthosis |
|
J.F. Keating et al., 2011 [9] |
Single, England |
12 |
Open repair |
Plaster Cast |
|
J.F. Maempel et al., 2020 [10] |
Single, United Kingdom |
188 |
Open repair |
Plaster Cast |
|
R. Metz et al., 2008 [11] |
Multi, Netherlands |
12 |
Minimally Invasive Surgery |
Plaster Cast and tape bandage |
|
M. Moller et al., 2001 [12] |
Multi, Sweden |
24 |
Open repair |
Plaster Cast and orthosis |
|
S.B. Myhrvold et al., 2022 [13] |
Multi, Norway |
12 |
Open repair and Minimally Invasive Surgery |
Plaster Cast and orthosis |
|
K. Nilsson-Helander et al., 2010 [14] |
Single, Sweden |
12 |
Open repair |
Plaster Cast and orthosis |
|
N. Olsson et al., 2013 [15] |
Single, Sweden |
12 |
Open repair |
Orthosis |
|
B.C. Twaddle et al., 2007 [16] |
Multi, New Zealand |
12 |
Open repair |
Plaster Cast and orthosis |
|
K. Willits et al., 2010 [17] |
Multi, Canada |
12 |
Open repair |
Plaster Cast and orthosis |
Table 2
Characteristics of patients
|
Name of Study, Year |
Total Patients |
Male |
Female |
Age |
|||
|
Surgical |
Conservative |
Surgical |
Conservative |
Surgical |
Conservative |
||
|
I. Lantto et al., 2016 [6] |
60 |
30 |
25 |
2 |
3 |
40 (27–57) |
39 (28–60) |
|
R. Cetti et al., 1993 [7] |
111 |
47 |
45 |
9 |
10 |
37.2 (21–62) |
37.8 (21–65) |
|
S. Fischer et al. 2020 [8] |
90 |
54 |
27 |
6 |
3 |
39.3 (7.9) |
45.2 (9.5) |
|
J.F. Keating et al., 2011 [9] |
80 |
28 |
32 |
11 |
9 |
41.2 (27–59) |
39.5 (21–58) |
|
J.F. Maempel et al., 2020 [10] |
80 |
28 |
32 |
11 |
9 |
41.2 (27–59) |
39.5 (21–58) |
|
R. Metz et al., 2008 [11] |
83 |
31 |
35 |
11 |
6 |
40 (23–63) |
41 (25–62) |
|
M. Moller et al., 2001 [12] |
112 |
51 |
48 |
8 |
5 |
39.6 (21–63) |
38.5 (26–59) |
|
S.B. Myhrvold et al., 2022 [13] |
526 |
255 |
136 |
93 |
42 |
39.9 (8.9) |
39.9 (8.1) |
|
K. Nilsson-Helander et al., 2010 [14] |
97 |
40 |
39 |
9 |
9 |
40.9 (24–59) |
41.2 (23–63) |
|
N. Olsson et al., 2013 [15] |
100 |
39 |
47 |
10 |
4 |
39.8 (8.9) |
39.5 (9.7) |
|
B.C. Twaddle et al., 2007 [16] |
42 |
14 |
14 |
6 |
8 |
41.8 (27–59) |
40.3 (18–50) |
|
K. Willits et al., 2010 [17] |
144 |
59 |
59 |
13 |
13 |
39.7 (11.0) |
41.1 (8.0) |
Table 3
Forest plots summary
|
Parameters |
Number of Studies |
Odds Ratio / Mean Difference [95 % CI] |
p |
|
Functional outcome at 6 months follow-up |
|||
|
Hopping test |
3 |
SMD 0.36 [0.17, 0.56] |
< 0.001* |
|
Heel-rise height |
3 |
SMD 0.65 [0.29, 1.01] |
< 0.001* |
|
Heel-rise work |
3 |
SMD 0.33 [0.09, 0.57] |
0.007* |
|
Drop counter movement jump |
3 |
SMD 0.13 [–0.14, 0.41] |
0.33 |
|
Concentric power |
3 |
SMD 0.29 [–0.05, 0.64] |
0.1 |
|
Eccentric power |
3 |
SMD –0.10 [–0.66, 0.46] |
0.73 |
|
Functional outcome at 12 months follow-up |
|||
|
Hopping test |
3 |
SMD –0.06 [–0.88, 0.76] |
0.88 |
|
Heel-rise height |
3 |
SMD 0.38 [–0.00, 0.76] |
0.05 |
|
Heel-rise work |
3 |
SMD 0.40 [0.20, 0.60] |
< 0.001* |
|
Drop counter movement jump |
3 |
SMD –0.02 [–0.96, 0.92] |
0.97 |
|
Concentric power |
3 |
SMD 0.03 [–0.35, 0.41] |
0.88 |
|
Eccentric power |
3 |
SMD –0.13 [–0.84, 0.58] |
0.72 |
Table 3 (continuation) Forest plots summary
|
Parameters |
Number of Studies |
Odds Ratio / Mean Difference [95 % CI] |
p |
|
Calf muscle atrophy |
3 |
OR 0.46 [0.27, 0.79] |
0.005* |
|
Abnormal ankle movement |
3 |
OR 0.34 [0.20, 0.60] |
< 0.001* |
|
Chronic pain |
3 |
OR 0.85 [0.42, 1.72] |
0.65 |
|
Re-rupture rate |
10 |
OR 0.34 [0.20, 0.58] |
< 0.001* |
|
Complications |
|||
|
Superficial infection |
7 |
OR 0.88 [0.42, 1.83] |
0.73 |
|
Deep infection |
7 |
OR 2.52 [0.88, 7.24] |
0.09 |
|
Deep vein thrombosis |
6 |
OR 0.64 [0.22, 1.85] |
0.41 |
|
Sural nerve injury |
4 |
OR 5.07 [1.60, 16.07] |
0.006* |
|
Total |
10 |
OR 1.35 [0.96, 1.90] |
0.08 |
Our initial electronic search results yielded 354 studies that matched the search keyword algorithm in the three major databases. The duplication removal process resulted in a total of 292 studies. The remaining studies were then screened by title and abstracts that had conformity to the inclusion and exclusion criteria. Twelve studies qualified and are included in the meta-analysis (Fig. 1).
The assessment risk of bias was done according to Cochrane risk of bias tool by conducting data of each included study to the RevMan 5.4.1 computer program. Out of the 12 studies, seven were found to have a high risk of bias due to various reasons. Three studies were found with a high risk of performance bias where these studies were not double-blinded. Furthermore, four studies were found with a high risk of detection bias where blinding of outcome was failed to be performed or was not mentioned in the study. Unclear risk was found mostly on other bias (Fig. 2).
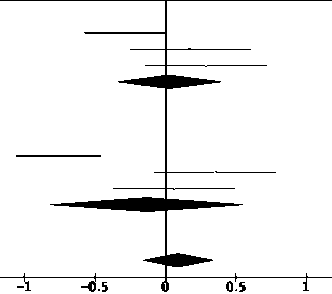
Figure 3 explains the publication bias depicted through the funnel plot.
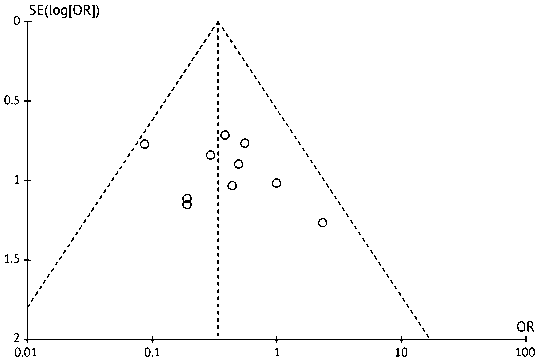
-
Fig. 3. Funnel plot re-rupture rate illustrating the publication bias
Functional outcome at 6 months follow-up
Hopping test at 6 months of follow-up (SMD 0.36; 95 % CI: 0.17 to 0.56; p ≤ 0.001), heel-rise height test (SMD 0.65; 95 % CI: 0.29 to 1.01; p ≤ 0.001), heel-rise work test (SMD 0.33; 95 % CI: 0.09 to 0.57; p = 0.007, were significantly higher in the surgical group compared to conservative group. Drop counter movement jump test (SMD 0.13; 95 % CI: –0.14 to 0.41; p = 0.33), concentric power test (SMD 0.29; 95 % CI: –0.55 to 0.64; p = 0.1) and eccentric power test (SMD –0.10; 95 % CI: –0.66 to 0.46; p = 0.73) at 6-month follow-up showed non-significant difference between the two groups (Fig. 4).
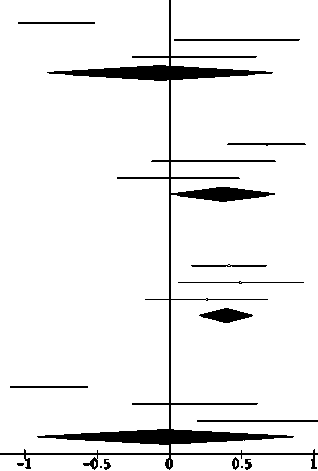
Functional outcome at 12 months follow-up
Heel-rise work test (SMD 0.40; 95 % CI: 0.20 to 0.40; p ≤ 0.001) was found significantly higher in the surgical group compared to the conservative group. Hopping (SMD 0.06; 95 % CI: –0.88 to 0.76; p = 0.88), heel-rise height (SMD 0.38; 95 % CI: –0.00 to 0.76; p = 0.05), drop counter movement jump (SMD –0.02; 95 % CI: –0.96 to 0.92; p = 0.97), concentric power (SMD 0.33; 95 % CI: –0.35 to 0.41; p = 0.88), and eccentric power (MD –0.13; 95 % CI: –0.84 to 0.58; p = 0.72) test on the other hand showed no significant difference between the two groups (Fig. 5).
Characteristics of selected studies
Surgical
Conservative
Study or Subgroup Mean SD Total Mean SD Total Weight
1.1.1 Hopping test at 6 months follow-up
Nilsson 2010
Olsson 2013
Myhrvold 2022
Subtotal (95% Cl)
Std. Mean Difference IV, Random, 95% Cl Year
Std. Mean Difference IV, Random, 95% Cl
|
90 |
24 |
45 |
75 |
35 |
38 |
5.1% |
0.50 [0.06, 0.94] |
2010 |
|
8Z |
36 |
42 |
76 |
33 |
42 |
5.1% |
0.17 [-0 26. 0.60] |
2013 |
|
88 |
5.1 |
121 |
86 |
5.3 |
123 |
6.5% |
0.38 [0.13. 0.64] |
2022 |
|
208 |
203 |
16.7% |
0.36 [0.17, 0.56] |
Heterogeneity: Tai/ - 0.00; Ch/ - 1.18. df - 2 (P - 0.55); / - 0%
Test for overall effect z - 3.65 (P - 0.0003)
1.1.2 Heel-rise height test at 6 months follow-up
|
Nilsson 2010 |
75 |
12 |
45 |
68 |
15 |
38 |
5.1% |
0.52 [0.08, 0.95] |
2010 |
|
Olsson 2013 |
72 |
15 |
47 |
66 |
15 |
46 |
5.3% |
0.40 [-0.01, 0.81] |
2013 |
|
Myhrvold 2022 |
72.95 |
3.85 |
126 |
69.2 |
4.1 |
124 |
6.5% |
0.94 [0.68. 1.20] |
2022 |
|
Subtotal (95% Cl) |
218 |
208 |
16.8% |
0.65 [0.29, 1.01] |
Heterogeneity: Tau* - 0.07; Ch/ - 5.93. df - 2 (P - 0.05); / - 66% Test for overall effect z - 3.50
1.1.3 Heel-rise work test at 6 months follow-up
|
Nilsson 2010 |
65 |
17 |
45 |
54 20 |
37 |
5.0% |
0.59 [0.15, 1.04] |
2010 |
|
Olsson 2013 |
65 |
23 |
47 |
56 22 |
46 |
5.3% |
0.40 [-0 01. 0.81] |
2013 |
|
Myhrvold 2022 |
52.2 |
6.8 |
124 |
50.95 7.35 |
122 |
6.5% |
0.18 [-0.07,0.43] |
2022 |
|
Subtotal (95% Cl) |
216 |
205 |
16.8% |
0.33 (0.09, 0.57] |
Heterogeneity Tai/ - 0.01; Ch/ - 2.81. df - 2(P - 0.25); / - 29% Test for overall effect z - 2.68 (P - 0.007)
1.1.4 Drop Counter Movement Jump test at 6 months follow-up
|
Nilsson 2010 |
79 |
16 |
45 |
76 |
18 |
37 |
5.1% |
0.18 [-0.26, 0.61] |
2010 |
|
Olsson 2013 |
81 |
21 |
45 |
74 |
12 |
45 |
5.2% |
0.41 [-0.01,0.82] |
2013 |
|
Myhrvold 2022 |
75.6 |
4.7 |
130 |
75.8 |
4.45 |
131 |
6.6% |
-0.04 [-0.29, 0.20] |
2022 |
|
Subtotal (95% Cl) |
220 |
213 |
16.9% |
0.13 (-0.14, 0.41] |
Heterogeneity: Tai/ - 0.03; Ch/ - 3.51. df - 2 (P - 0.17); / - 43% Test for overall effect z - 0.97
1.1.5 Concentric test at 6 months follow-up
|
Nilsson 2010 |
82 |
26 |
45 |
71 |
32 |
38 |
5.1% |
0.38 [-0.06,0.81] |
2010 |
|
Olsson 2013 |
75 |
34 |
47 |
78 |
58 |
46 |
5.3% |
-0.06 [-0.47, 0.34] |
2013 |
|
Myhrvold 2022 |
71 |
7.3 |
92 |
67.35 |
6.75 |
95 |
6.2% |
0.52 [0.23,0.81] |
2022 |
|
Subtotal (95% Cl) |
184 |
179 |
16.6% |
0.29 [-0.05, 0.64] |
Heterogeneity: Tai/ - 0.06; Ch/ - 5.22, df - 2
1.1.6 Eccentric test at 6 months follow-up
|
Nilsson 2010 70 |
21 |
45 |
60 |
29 |
38 |
5.1% |
0.40 [-0.04, 0.83] |
2010 |
|
Olsson 2013 59 |
21 |
47 |
61 |
33 |
46 |
5.3% |
-0.07 [-0.48, 0.33] |
2013 |
|
Myhrvold 202 2 5 8.2 |
6.85 |
61 |
62.2 |
6.85 |
68 |
5.7% |
-0.58 [-0.93,-0.23] |
2022 |
|
Subtotal (95% Cl) |
153 |
152 |
16.1% |
-0.10 [-0.66, 0.46] |
||||
|
Heterogeneity: Tai/ - 0.20; Ch/ - : |
11.88, df |
- 2(P |
- 0.003); / |
- 83% |
||||
Total (95% Cl)
0.29 [0.12, 0.46]
Test for overall effect z - 0.34 (P - 0.73)
Heterogeneity: Tau* - 0.10; Chi2 - 69.40, df Test for overall eflea: Z - 3.32 (P - 0.0009}
1160 100.0%
17 (P < 0.00001); / - 764
h£s 4125 <
#5 0^5
Test for subgroup differences: Chi2 - 7.28, df - 5 (P - 0.20}, I2 - 31.3%
Favours [Conservative] Favours [Surgical]
Fig. 4. Comparison of functional outcome after 6 months in surgical versus conservative group
|
Surgical Conservative |
Weight |
Std. Mean Difference IV, Random, 95% Cl |
|
Study or Subgroup Mean SD Total Mean SD Total |
||
|
2.1.1 Hopping test at 12 months follow-up |
||
|
Myhrvold 2022 93.5 7.1 109 99.3 7.65 116 |
5.9% |
-0.78 [-1.05, -0.51] |
|
Nilsson 2010 101 16 46 90 30 38 |
5.4% |
0.47 [0.03, 0.90] |
|
Olsson 2013 82 36 42 76 33 42 |
5.4% |
0.17 [-0.26, 0.601 |
|
Subtotal (95% Cl) 197 196 |
16.7% |
-0.06 [-0.88, 0.76] |
|
Heterogeneity: Tai/ - 0.48; Ch/ - 28.67, df - 2 (p < 0 00001); / Test for overall effect: Z - 0.15 (P - 0-88) 2.1.2 Heel-rise height test at 12 months follow-up |
-93% |
|
|
Myhrvold 2022 86.95 6.35 109 83 5.3 119 |
5.9% |
0.68 [0.41, 0.94] |
|
Nilsson 2010 81 13 45 77 13 41 |
5.4% |
0.30 1-0.12,0.731 |
|
Olsson 2013 80 15 41 79 16 45 |
5.4% |
0.06 [-0.36, 0.491 |
|
Subtotal (95% Cl) 195 205 |
16.7% |
0.38 [-0.00, 0.76] |
|
Heterogeneity: Tai/ - 0.08; Ch/ - 6.38, df - 2 (P - 0.04); / - 69% Test for overall effect: Z - 1.95 (P - 0.05) 2.1.3 Heel-rise work test at 12 months follow-up |
||
|
Myhrvold 2022 71.3 8.15 108 68 7.7 119 |
5.9% |
0.42 [0.15, 0.68] |
|
Nilsson 2010 78 20 45 68 20 40 |
5.4% |
0.50 [0.06, 0.931 |
|
Olsson 2013 76 19 41 71 19 45 |
5.4% |
0.26 [-0.16, 0.69] |
|
Subtotal (95% Cl) 194 204 Heterogeneity: Tai/ - 0.00; Ch/ - 0.61, df - 2 (P - 0.74); / - 0% Test for overall effect Z - 3.93 (P < 0.0001) |
16.7% |
0.40 [0.20, 0.60] |
|
2.1.4 Drop Counter Movement Jump test at 12 months follow-up |
||
|
Myhrvold 2022 82.4 5.8 113 88 7.45 118 |
5.9% |
-0.83 [-1.10, -0.561 |
|
Nilsson 2010 79 16 45 76 18 37 |
5.4% |
0.18 [-0.26, 0.61] |
|
Olsson 2013 91 15 40 82 13 43 |
5.3% |
0.64 [0.20, 1.081 |
|
Subtotal (95% Cl) 198 198 |
16.6% |
-0.02 [-0.96, 0.92] |
|
Heterogeneity: Tai/ - 0.65; Ch/ - 36.96, df - 2 (P < 0 00001); / Test for overall effect Z - 0.04 (P - 0-97) |
- 95% |
|
Std. Mean Difference IV, Random, 95% Cl
Favours [Conservative] Favours [Surgical]
Fig. 5. Comparison of functional outcome after 12 month in surgical versus conservative group
Surgical Conservative Std. Mean Difference
Study or Subgroup Mean SD Total Mean SD Total Weight IV, Random, 95% Cl
Std. Mean Difference IV, Random, 95% Cl
Favours [Conservative] Favours [Surgical]
Fig. 5 (continuation). Comparison of functional outcome after 12 month in surgical versus conservative group
2.1.S Concentric Power test at 12 months follow-up
|
Myhrvold 2022 |
82 |
13.75 |
88 |
86.1 |
14.35 |
107 |
5.9% |
-0.29 [-0.57, -0.01] |
|
Nilsson 2010 |
87 |
24 |
45 |
82 |
33 |
40 |
5.4% |
0.17 [-0.25,0.60] |
|
Olsson 2013 |
95 |
39 |
40 |
84 |
36 |
44 |
5.4% |
0.29 [-0.14,0.72] |
|
Subtotal (95% Cl) |
173 |
191 |
16.7% |
0.03 [-0.35, 0.41] |
||||
|
Heterogeneity: Tau2 - |
0.08; Chi2-6.21, df- |
2 |
0.04); I2 |
-68% |
||||
|
Test for overall effect |
2 - 0.15 (P-0.88) |
|||||||
|
2.1.6 Eccentric Power test at 12 months follow-up |
||||||||
|
Myhrvold 2022 |
73.5 |
10.65 |
84 |
81.7 |
10.8 |
99 |
58% |
-0.76 [-1.06, -0.46] |
|
Nilsson 2010 |
79 |
19 |
45 |
72 |
20 |
40 |
5.4% |
0.36 [-0.07,0.79] |
|
Olsson 2013 |
83 |
29 |
40 |
81 |
35 |
43 |
5.4% |
0.06 [-0.37, 0.49] |
|
Subtotal (95% Cl) |
169 |
182 |
16.6% |
-0.13 [-0.84, 0.58] |
||||
Heterogeneity: Tau* - 0.36; Chi2 - 20.64, df - 2 (P < 0.0001); I2 - 90* Test for overall effect z - 0.35 (P - 0.72)
Total (95% Cl) 1126 1176 100.0% 0.09 [-0.16,0.35]
Heterogeneity: Tau2 - 0.27; Chi2 - 158.71. df - 17 (P < 0.00001); I2 - 89%
Test for overall effect 2 - 0.71 (P - 0.48)
Test for subgroup differences: Chi2 - 5.58, df - 5 (P - 0.35), I2 - 10.4%
Calf muscle atrophy
Results showed calf muscle atrophy (OR 0.46; 95 % CI: 0.27 to 0.79; p = 0.005) was significantly higher in the conservative group compared to the surgical group (Fig. 6).
|
Surgical Non Surgical Odds Ratio Study or Subgroup Events Total Events Total Weight M-H, Fixed, 95% Cl |
Odds Ratio M H, Fixed, 95% Cl |
|
|
Cetti1993 22 56 35 55 54.4% 0.37(0.17,0.80] Lanto2016 23 29 25 28 13.4% 0.46(0.10,2.06] Moller 2001 22 52 18 33 32.2% 0.61(0.25,1.47] Total (95% Cl) 137 116 100.0% 0.46(0.27,0.79] Total events 67 78 Heterogeneity: Chi3 - 0.71, df- 2 (P - 0.70); I* - 0% Test for overall effect: Z= 2.83 (P= 0.005) |
||
|
0.01 0'1 Non Surgical |
10 Surgical |
|
Fig. 6. Comparison of calf muscle atrophy in surgical versus conservative group
Re-rupture rate
Results showed re-rupture rate (OR 0.34; 95 % CI: 0.20 to 0.58; p ≤ 0.001) was significantly higher in the conservative group compared to the surgical group (Fig. 7).
|
Study or Subgroup |
Surgical |
Non Surgical |
Odds Ratio M-H, Fixed, 95% Cl |
Odds Ratio M-H, Fixed, 95% Cl |
||||
|
Events |
Total |
Events |
Total |
Weight |
||||
|
Cettl 1993 |
3 |
56 |
7 |
55 |
13.5% |
0.39 [0.09, 1.59] |
--------•----- |
|
|
Fischer 2020 |
2 |
47 |
2 |
22 |
5.2% |
0.44 [0.06, 3.38] |
--— |
|
|
Keating 2011 |
2 |
37 |
4 |
39 |
7.4% |
0.50 [0.09, 2.91] |
--- |
|
|
Lanto 2016 |
1 |
32 |
4 |
28 |
8.3% |
0.19 [0.02,1.85] --- |
^—^—-^—^— |
|
|
Metz 2008 |
3 |
42 |
5 |
41 |
9.5% |
0.55 [0.12, 2.49] |
—■— |
|
|
Myhrvold 2022 |
2 |
348 |
11 |
178 |
29.1% |
0.09 [0.02, 0.40] --- |
--■------ |
|
|
Nilsson 2010 |
2 |
49 |
6 |
48 |
11.7% |
0.30 [0.06, 1.56] |
---------•------ |
|
|
Olsson 2013 |
1 |
49 |
5 |
51 |
9.7% |
0.19 [0 02, 1.70] — |
--- |
|
|
Twaddle 2007 |
2 |
20 |
1 |
22 |
1.7% |
2.33 [0.20, 27.91] |
--- |
|
|
Willits 2010 |
2 |
72 |
2 |
72 |
3.9% |
1.00 [0.14, 7.30] |
||
|
Total (95% Cl) |
752 |
556 |
100.0% |
0.34 (0.20, 0.58] |
||||
|
Total events |
20 |
47 |
||||||
|
Heterogeneity: Chi2 - |
7.73, df |
-9(P |
- 0.56); I2 |
-0% |
“ol----- |
|||
|
Test for overall effect |
Z - 3.96 (p < 0.0001) |
Non Surgical |
XV AW Surgical |
|||||
Fig. 7. Comparison of re-rupture rate in surgical versus conservative group
General complications
General complications (OR 1.35; 95 % CI: 0.96 to 1.90; p = 0.08) were not significantly different between the two groups (Fig. 8).
Complications other than general complications
Sural nerve injury rate (OR 5.07; 95 % CI: 1.60 to 16.07; p = 0.006) was found significantly higher in the surgical group compared to the conservative group. Neither superficial infection (OR 0.88; 95 % CI: 0.42 to 1.83; p = 0.73), deep infection (OR 2.52; 95 % CI: 0.88 to 7.24; p = 0.09), deep vein thrombosis rate (OR 0.64; 95 % CI: 0.22 to 1.85; p = 0.41) (Fig. 9).
|
Surgical Nou Surgical Odds Ratio Study or Subgroup Events Total Events Total Weight M-H, Fixed, 95% Cl |
Odds Ratio M-H, Fixed, 95% Cl |
|
|
Cetti1993 17 56 4 55 4.8% 5.56(1.73,17.84) Fischer 2020 9 47 4 23 7.4% 1.13(0.31,4.13) Keating 2011 3 37 2 39 3.1% 1.63(0.26,10.37] Lanto2016 1 32 4 28 7.0% 0.19(0.02,1.85) Metz 2008 9 42 15 41 20.3% 0.47(0.18,1.25] Moller 2001 1 52 0 33 1.0% 1.95(0.08,49.33) Myhivold2022 47 348 18 178 35.1% 1.39(0.78,2.47) Nilsson 2010 2 49 6 48 9.9% 0.30(0.06,1.56) Olsson 2013 8 49 5 51 7.0% 1.80(0.54,5.92] Willits 2010 11 72 3 72 4.3% 4.15(1.11.15.56] Total (95% Cl) 784 568 100.0% 1.35 [0.96, 1.90] Total events 108 61 Heterogeneity: Chi’ - 19.34, df= 9 (P= 0.02); I* - 53% Test for overall effect: Z= 1.74 (P= 0.08) |
||
|
0.01 0'1 Non Surgical |
10 100 Surgical |
|
Fig. 8. Comparison of general complications other than re-rupture in surgical versus conservative group
|
Study or Subgroup |
Surgical |
Conservative |
Weight |
Odds Ratio M-H, Fixed, 95% Cl |
Odds Ratio M-H, Fixed, 95% Cl |
|||||
|
Events |
Total |
Events |
Total |
|||||||
|
9.1.1 Superficial Infection Cetti 1993 0 |
58 37 42 59 348 49 |
0 0 13 0 0 0 |
55 39 41 |
1.5% 38.9% 1.6% 2.0% 1.5% |
Not estimable 3.25 [0.13, 82.24] 0.11 [0.02,0.52] 2.74 [0.11,68.81] 4.66 [0.25, 87.10] 3-00 [0.12, 75.48] 9.53 [0.50, 180.25] 0.88 [0.42, 1.83] |
|||||
|
Keating avxx Metz 2008 Moller 2001 Myhrvokl 2022 Nilsson 2010 Willits 2010 Subtotal (95% Cl) Total events Heterogeneity Chi2 -Test tor overall effect |
2 1 |
|||||||||
|
53 |
||||||||||
|
1 4 13 12.35, df Z-035 |
178 48 |
|||||||||
|
665 486 47.0% 13 - 5 (P - 0.03); I2 - 60% (P - 0.73) |
||||||||||
|
9.1.2 Deep Infection Cetti 1993 Keating 2011 Lanto 2016 Metz 2008 Myhrvokl 2022 Nilsson 2010 Willits 2010 Subtotal (95% Cl) Total events Heterogeneity Chi2 -Test tor overall effect |
2 2 1 0 |
58 37 32 42 348 49 72 |
0 0 0 0 2 0 0 |
1.5% 1.4% 1.6% 8.1% 1.5% 1.5% 15.7% |
4.91 [0.23, 104.63] 5.56 [0.26, 119.85] 2.71 [0.11, 69.34] Not estimable 1.28 [0.25,6.68] 3.00 [0.12, 75.48] 3.04 [0.12, 75.92] 2.50 [0.87, 7.21] |
|||||
|
55 39 28 41 |
||||||||||
|
5 1 1 |
178 48 72 461 -0% |
|||||||||
|
12 2 1.11, df - 5 (P-0.95); I2 Z - 1.70 (P - 0.09) |
||||||||||
|
9.1.3 Deep Vein Thrombosis |
47 37 42 59 348 72 605 5(P (P-C |
0 2 1 1 1 1 |
22 39 41 |
2.0% 7.5% 4.7% 4.9% 4.1% 3.1% 26.2% |
1.45 [0.06, 37.06] 0.20 [0.01, 4.31] 0.32 [0.01, 8.03] 0.29 [0.01, 7.38] 1.54 [0.16, 14.90] 1.00 [0.06, 16.30] 0.64 [0.22, 1.85] |
|||||
|
Keating 2011 Metz 2008 Moller 2001 Myhrvokl 2022 Willits 2010 Subtotal (95% Cl) Total events Heterogeneity Chi’ -Test for overall effect |
0 0 0 3 1 |
|||||||||
|
53 |
||||||||||
|
178 72 405 -0* |
||||||||||
|
5 1.87, df-Z-0.83 |
6 - 0.87); I2 •41) |
|||||||||
|
9.1.4 Sural Nerve Injury |
56 42 348 49 |
1 1 1 0 |
2.7% 2.9% 4.0% 1.5% 11.2% |
7.71 [0.92, 64.96] 3.08 [0.31, 30.87] 4.70 [0.59, 37.39] 5.11 [0.24, 109.17] 5.07 [1.60, 16.07] |
||||||
|
Metz 2008 Myhrvokl 2022 Nilsson 2010 Subtotal (95% Cl) Total events Heterogeneity Chi2 - Test for overall effect |
3 9 2 |
41 178 48 322 -0% |
||||||||
|
21 3
0.33, df - 3 |
||||||||||
|
Total (95% Cl) 2403 1674 100.0% Total events SI 24 Heterogeneity Chi2 - 23.31, df - 21 O’ - 0.33); I2 - 10% Test for overall effect z - 1.87 (P - 0.06) Test for subgroup differences: Chi2 - 9.60, df - 3 (P - 0.02), I2 |
1.54 [0.98, 2.41] |
|||||||||
|
-68.7% |
6.01 O'.l Favours [Conservative] |
ilo Favours [Surgical] |
100 |
|||||||
Fig. 9. Comparison of complications other than general complications in surgical versus conservative group
DISCUSSION
Assessing functional outcomes such as hopping tests, heel rise height and work, drop counter movement jump, and power measurements (concentric and eccentric) are important for evaluating recovery and performance following Achilles tendon rupture treatment.
Our study found that functional outcomes at 6-month follow-up were better in patients who underwent surgery compared with conservative treatment. However, there was no significant difference in functional outcomes after 12 months of follow-up between surgical and conservative groups. In line with previous study [18] which found strength, calf circumference, and functional result did not differ between surgical and conservative interventions.
Based on the results of our study, it can be seen that the functional outcome at 6-month follow-up was significantly better in the surgical group compared to the conservative group in several tests such as hopping test, heel rise height, heel rise work, and concentric power. However, the functional outcome at 12-month follow-up was only heel rise work with significantly better results for the surgical compared to the conservative method. This shows that conservative treatment is no less good than surgical treatment.
Compared to patients treated conservatively, surgical patients frequently restore hopping, heel rise height, heel rise work, drop counter movement jump, concentric and eccentric power more rapidly. Because surgery can more successfully repair tendon integrity, those who have it frequently perform better on early weight-bearing after recovering. Surgical treatment also allows for faster restoration of explosive power in the lower extremity. This benefit is frequently brought about by the tendon's direct mechanical healing, which might offer more rapid stability [19].
Research suggests that when early and adequate rehabilitation protocols are followed, both surgical and conservative treatments can produce comparable functional outcomes. In patients receiving conservative treatment, there was no statistically significant difference in re-rupture, return to employment, or return to sports between early and late weight-bearing [20].
When early functional rehabilitation was applied in both groups, a thorough meta-analysis revealed no discernible difference in hopping, heel rise height, heel rise work, drop counter movement jump, concentric and eccentric power test performance one year after injury between surgically and conservatively treated individuals [5, 19]. While surgical repair initially improved hopping, heel rise work, heel rise height, and concentric performance, a study by K. Nilsson-Helander et al. [14]. N. Olsson et al. [15] found that at longterm follow-up, there were no significant differences between the surgical and conservative groups; the heel rise work test was the only area where there was a significant difference, indicating that similar functional results can be obtained from both methods.
The re-rupture rate in this study was significantly higher in the conservative group compared to the surgical group. Comparatively speaking, conservative therapy for an Achilles tendon rupture is often linked to a higher risk of re-rupture. Through stronger healing and a lower chance of re-rupture, the surgical technique seeks to restore the tendon's anatomical continuity. Surgery considerably decreased the re-rupture rate when compared to conservative treatment [18, 21–24]. Less re-rupture rates were also noted in the surgical group, according to a study conducted by A. Soroceanu et al. [25].
Choosing early or later rehabilitation following either conservative or surgical treatment had no effect on the outcome [24, 26]. Not in line with previous studies [23] that reduced risk of rupture during conservative treatment as opposed to surgical treatment if both types of treatment included a functional rehabilitation plan that included early range of motion. Re-rupture rates from the surgical method may range from 1 % to 5 %, according to the overall trend of various researchers.
While conservative treatment avoids the dangers associated with surgery, it may result in a higher rate of re-ruptures. In conservative treatment, functional bracing is becoming more popular since it can enhance results and possibly lower the rate of re-ruptures. When deciding between conservative and surgical method treatment patient's age, degree of activity, and coexisting conditions should all be taken into account.
In this study, general complications other than re-rupture were higher in the surgical group compared to the conservative group, but not significantly. General complications such as skin necrosis, deep infection, tendon lengthening, adhesion, superficial infection, disturbances of sensibility, suture granuloma, and delayed wound healing were encountered. In line with previous research, the results of complications were higher in the surgical group compared to the conservative group [18, 22, 23]. However, general complications other than re-rupture in this study were not significant as the previous studies discovered [26].
Superficial infection in this study was higher in the conservative group compared to the surgical group, but not significantly. D. Seow et al. [24], A. Soroceanu et al. [25] found that the complication that was more frequently linked to surgical repair of Achilles tendon ruptures was superficial infection. After surgical repair, superficial infections are a common consequence that usually arises at the site of the surgical incision. Because conservative treatment involves no surgical incision, the risk of surface infection is typically avoided.
Deep infections in this study were higher in the surgical group compared to the conservative group, but not significantly. Deep infections, which can happen in the tissue around the Achilles tendon after surgery, are more dangerous. Deep infection can occur during surgical repair and have a significant influence on overall recovery and function [27].
Deep vein thrombosis in this study was higher in the conservative group compared to the surgical group but not significantly, in line with previous meta-analysis [21]. During the early stages of recuperation following surgery, immobility may result, which raises the risk of DVT. Often, preventative actions are done to lessen this risk. Prolonged immobility following conservative therapy, especially with casting, may also raise the risk of DVT.
Sural nerve injury in this study was significantly higher in the surgical group compared to the conservative group. Deficits in senses may result from complications related to injury to the sural nerve sustained after surgery or immobilization. When compared to certain less invasive methods, open repair approaches often carry a lower risk of sural nerve injury. This is mainly because the surgical area is more exposed and directly visible, which makes it easier for surgeons to avoid the nerve [13, 28]. In conservative treatment, sural nerve injury can occur because the sural nerve is proximal to the Achilles tendon. When using functional bracing or casting in a non-anatomical position it can put pressure on the sural nerve. Inadequate bracing or misalignment can further raise the risk of nerve damage [28, 29].
The limitations of this study are that the demographics of participants in various studies can also cause bias. In addition, the surgical and conservative techniques used are diverse. Finally, the duration of follow-up in various studies can also cause bias.
CONCLUSION
Reduced rates of re-rupture, possibly quicker recovery for functional outcomes like hopping, heel rise tests are some benefits of surgical repair. Conversely, conservative treatment can yield good results in terms of functional outcomes and re-rupture rates in long-term follow-up, particularly when combined with contemporary rehabilitation procedures that include functional bracing and early mobilization. Conservative treatment eliminates the hazards associated with surgery, such as nerve damage, but it may have a slightly higher chance of re-rupture and a shorter initial recovery of some functional outcomes. Both treatment methods are good for Achilles tendon rupture repair.
Conflicts of interest The authors declare that they have no known competing financial interests or personal relationships that could have appeared to influence the work reported in this paper.
Funding The authors did not receive any grant or funding for this research.
Ethics approval PROSPERO ID CRD42023486152.
