Measurement of Usability of Office Application Using a Fuzzy Multi-Criteria Technique

Author: Sanjay Kumar Dubey, Sumit Pandey
Journal: International Journal of Information Technology and Computer Science(IJITCS) @ijitcs
Article in issue: 4 Vol. 7, 2015.
Free access
Software Quality is very important aspect for any software development company. Software quality measurement is also a major concern for improving the software applications in software development processes in these companies. The quantification of various quality factors and integrate them into various software quality models is very important to analyze the quality of software system. Software usability is one of the important quality factors now days due to the increasing demand of interactive and user friendly software systems. In this paper, an attempt has been made to quantifying the usability of Ms-Excel 2007 and Ms-Excel 2010 application software using ISO/IEC 9126 model and compare the numeric value of usability for both version of Ms-Excel 2007 and Ms-Excel 2010. Due to the random nature of the usability attributes, the fuzzy multi criteria decision technique has been used to evolve the usability of the software office application. The present method will be helpful to analyze and enhance the quality of interactive software system.
Software System, Quality Model, Fuzzy, Usability, Ms-Excel
Short address: https://sciup.org/15012273
IDR: 15012273
Text of the scientific article Measurement of Usability of Office Application Using a Fuzzy Multi-Criteria Technique
Published Online March 2015 in MECS
Software quality characteristics like reliability, maintainability, efficiency, portability, usability and reusability are the group of properties that software possesses to maintain software quality level. Quality is the totality of features and characteristics of a product or service that bears its ability to satisfy stated or implied needs [1]. Software quality is a procedure of building the constant relationships by assessing, and fulfilling the user needs.
As the software industry growing, Usability is accepted as a key quality attribute and main parameter for any application software product. The ISO 9241-11 [2] defines usability as “the context to which a product can be used by specified users to achieve specified goals with effectiveness, efficiency and satisfaction in a specified context of use”. Subsequently, ISO/IEC 9126-1 [3] categorized usability a part stating internal and external software quality, defining it as “the capability of software product to be understood, learned, used and attractive to the user under specified conditions ”. According to Grudin [4], usability is the question of how satisfactorily users can make use of functionality of system.
The present work attempts to quantify the software usability using the ISO/IEC 9126 Model [3] as the base model. Fuzzy Logic is a powerful problem-solving methodology that can be used for applications in many areas [5]. Fuzzy Logic is mainly helpful in determining the values of the software quality parameters in terms of propositions rather than simple numeric values. This helps us to resolve the vagueness in the software quality to some extent. The weights and ratings of the software quality parameters have been quantified in terms of fuzzy sets, which are finally converted to numeric values. In order to deal with the fuzziness or uncertainty in quantifying the actual software parameters, the fuzzy multi criteria approach has been used.
Ms-Excel is the software product of Microsoft Corporation and this is one of the most popular used Application software in various fields. This software provides so many functions and facility for calculation mathematical data as well as also used as to keep record like database. This paper attempts to measure software usability of Ms-Excel 2007 and Ms-Excel 2010.
The remaining paper is organized as follows. Section II presents a literature study. Section III describes the software Quality and Quality Model ISO/IEC 9126. Section IV presents the procedure to measuring Usability. Section V presents assumption to measuring the usability. Section VI presents the various calculations while in section VII discussed the results. In the last section conclusions are drawn.
-
II. Literature Study
Most of the researchers mainly concentrate on quantification of parameters that affect the quality of software system in various aspects [6-7]. Sharma et al. [8] had considered the component Based Software Development Model to quantify the software quality criteria mentioned in the ISO/IEC 9126 model with minor modifications. S.A. Slaughter et al. [9] has made an attempt to evaluate the cost of software quality. M.
Agarwal et al. [10] had considered the software quality in terms of quality, effort, and cycle time. O. Maryoly et al. [11] developed a systemic quality model for developing and evaluating the software product. Various characteristics and sub characteristics affecting the software quality have been quantified by using metrics to evaluate the software quality. Lamouchi Olfa et al. [12] attempted to quantify the software quality factors by subdividing the factors into criteria and sub criteria and by quantifying the metrics that are affecting them. I. Heitlager et al. [13] emphasized estimating software quality based on maintainability and R. Fitzpatrick et al. [14] and M. Bertoa et al. [15] have tried to estimate the software quality by mainly emphasizing on usability. L. Lin et al. [16] presented a new assessment method to obtain the integrated software quality for evaluating user satisfaction by using the fuzzy set theory based on the ISO 9126 Sample Quality Model with a single evaluator. B.Yanghad [17] proposed a software quality prediction model based on a fuzzy neural network, which helps in identifying design errors in software products in the early stages of a software lifecycle. G. Buyukozkan [18] presented a Fuzzy AHP approach for the selection of software development strategy. Multi criteria decision making has been an age old process with there being much classical literature available on this field [19, 20]. S. Kanhe [21] proposed a ranking methodology to cope with the cases when criteria values and the relative importance of criteria were independent random variables with given distributions. In most of the literature the multi criteria approach has been used quantitatively where the values of the parameters are in numeric terms. Recent literature used the qualitative approach as well, mainly by using fuzzy sets [22]. Baas and Kwakernaak [23] introduced fuzzy concepts in ranking, assuming that criteria values and the relative importance of criteria were fuzzy numbers. They extended the classical weighted average rating method to handle fuzzy numbers. Carlsson C. and Fuller R. [24] gave a comprehensive survey of fuzzy multi-criteria decision-making methods with emphasis on fuzzy relations between inter dependent criteria. P. R. Srivastava et al. [25] tried to rank the software quality using the fuzzy multi criteria approach.
-
III. Software Quality
Software quality means ability of product to be able to assure and satisfy the users. Software quality is a procedure of building the constant relationships by assessing, and fulfilling the user needs. Quality is the totality of features and characteristics of a product or service that bears its ability to satisfy stated or implied needs.
Software Quality has been studied in detail and there are many definitions for software quality given different persons. Philip B. Crosby [26] Describe the quality as “The main mistaken hypothesis is that quality means goodness, or luxury or shininess. It varies for different things for each and every person”. Walter Edwards Deming’s in his book [27] says that “The main constraint in defining quality is to understand future needs of the user into measurable characteristics so that product can be planned and turned out to give satisfaction at a price that the user will pay”. Armand Vallin Feigenbaum [28]
define that “ quality is related to costumer or user. It is based on the customer’s genuine experience and review with the particular product or service”. Kaoru Ishikawa [29] says that “we related in quality control to manufacture products with the quality which can satisfy the requirements of consumers. The term ‘quality’ is important and broadly it should be interpreted as – quality means quality of product, services, information, processes, people, system etc”. Joseph M. Juran [30] describe that the word quality has many different meanings: one is quality means it consists all product feature that required by customers and thereby provide product satisfaction and other is quality consists of liberty from deficiencies.
A number of recognized quality models are used to build quality software in industry. One the most popular and extensively used quality model i.e ISO/IEC 9126 is described below-
-
A. The ISO/IEC 9126 Model
ISO (International Standard Organization) proposed a standard, known as the ISO/IEC 9126 Model [3], which provides a generic definition of software quality in terms of six main characteristics for software evaluation. These characteristics are functionality, efficiency,
maintainability, portability, reliability and usability. The model covers almost all of the aspects covered in previously proposed models such as Boehm’s model [31], McCall’s model [32], Dromey’s model [33], etc. It covers both the internal and external quality characteristics of a software product. Here it is discussed only about software usability and some of its characteristic:
-
A. Understand-ability deals with the attributes of software that describe the relative ease of recognizing the logical concept and its applicability.
-
B. Learn-ability deal with the software attributes that describe the relative ease for the users to learn the application.
-
C. Operability deals with the software attributes that are associated to the relative ease of learning the operations of the software
-
D. Attractiveness describes the degree to which the software has been made attractive
-
E. Usability Compliance determines whether the software adheres to the compliance standards of usability or not.
-
IV. Methodology
To measure the usability of Office Application Software, Ms-Excel 2007 and Ms-Excel 2010 is chosen. A group of users from different working area like accounts, library, IT, teaching and course coordinator was made to fill a questionnaire in which the fuzzification criteria for all the characteristics and attributes were specified. In the process of fuzzification, fuzzy sets were assigned to real time values. They are assigned as Very High (VH), High (H), Medium (M), Low (L) and Very Low (VL). All the characteristics and sub-attributes are associated with corresponding rating and weight. The rating and weight are the fuzzy values given by the user
for a particular characteristic or attribute according to its usage and importance of Ms-Excel 2007 and Ms-Excel 2010 respectively for calculating the usability.
Table 1. Triangular Fuzzy sets for fuzzy weights [5]
|
Fuzzy Value |
Fuzzy Weight |
|
VL |
(0.0, 0.0, 0.25) |
|
L |
(0.0, 0.25, 0.5) |
|
M |
(0.25, 0.5, 0.75) |
|
H |
(0.5, 0.75, 1.0) |
|
VH |
(0.75, 1.0, 1.0) |
Table 2. Triangular Fuzzy sets for fuzzy Rating [5]
|
Fuzzy Value |
Fuzzy Rating |
|
VL |
(0.0, 0.1, 0.3) |
|
L |
(0.1, 0.3, 0.5) |
|
M |
(0.3, 0.5, 0.7) |
|
H |
(0.5, 0.7, 0.9) |
|
VH |
(0.7, 0.9, 1.0) |
The fuzzy rating of a sub characteristic is obtained by the weighted average of the corresponding metrics affecting it. It can be written as:
Rating of sub-characteristic = r 1 × w 1 + r 2 × w 2 +... r n × w n = Σ r i × w i
Where i belongs to the set of metrics affecting that sub characteristic.
Similarly the fuzzy rating of the characteristic is calculated by a weighted average of sub characteristics affecting it:
Rating of characteristic = r 1 × w 1 + r 2 × w 2 + ..…r n × w n = Σ r i × w i
Where i belongs to the set of sub characteristic affecting that characteristic.
The procedure to quantify the software quality is as follows:
Step 1: Assign fuzzy ratings (r i ) to each and every metric that exists in the software model.
Step 2: Assign fuzzy weights (wi) to the sub characteristics, characteristics and perspectives.
Step 3: Take the weighted average of the metrics (using their weights and ratings).
Step 4: Take the weighted average of the subcharacteristics for Usability (using their weights and ratings) under the corresponding characteristics to evaluate the fuzzy rating.
-
V. Assumptions
A.The values of all the parameters or characteristics have been quantified in the range 0 to 1. The overall quality of the software after quantification also appears in the range of 0 to 1.
-
B. Various characteristics and sub characteristics have been prioritized appropriately to calculate the total quality of the software. The weights considered vary from case to case.
-
C. Both ratings and weights have been quantified in terms of fuzzy, which are then converted into crisp numeric values using the centroid formula [5].
D.The fuzzy weighted average of all the quantified criteria and sub criteria is taken in order to arrive at the final quality. This has been done to maintain consistency so that the range of final values lies between 0 and 1.
-
VI. Case Study
-
A. Usability Evaluation of MS-Excel 2007
-
The real time values of the metrics related to usability are shown in Table 3. The values of these metrics have been acquired from different Ms-Excel users on the basis of a questionnaire. Table 4 shows the ratings of the metrics corresponding to the usability characteristic. After classifying the metrics in the corresponding fuzzy sets, they have been assigned appropriate triangular fuzzy numbers as shown in the Table 4. Table 5 shows the values of the weights that have been taken from five users. These weights have also been acquired via a questionnaire. This table also shows the fuzzified value of the weights after taking their average.
In Table-6, the ratings (r i ) of the metrics (belonging to usability) have been multiplied by corresponding weights (w i ) and then added together to get the ratings of the corresponding sub characteristics. Table-7 shows the weights of different sub characteristics under the usability characteristic. These have also been acquired by the questionnaire based interactive interface.
Table 3. Values of Real time Metrics for the Usability Characteristic for Ms-Excel 2007
|
Characteristics |
Sub-Characteristics |
Users |
|
Understandability |
Documentation |
H |
|
Help system |
VH |
|
|
Subjectively pleasing |
VH |
|
|
Errors and Pop-Ups |
L |
|
|
Online help support |
H |
|
|
International language support |
VH |
|
|
Learn ability |
Percentage of observable properties |
VH |
|
Type of interface |
VH |
|
Operability |
Complexity of the functionalities |
VH |
|
Type of interface |
VH |
|
|
Ease of use and navigability |
H |
|
|
Attractiveness |
Usage of graphics to enhance attractiveness |
VH |
|
Usability compliance |
software adhere to standards, regarding to usability |
H |
Table 4. Fuzzy Ratings of the Metrics Belonging to Usability Characteristic for Ms-Excel 2007
|
Characteristics |
Sub-Characteristics |
U1 |
U2 |
U3 |
U4 |
U5 |
Avg. Rating |
|
Understandability |
Documentation |
H |
H |
VH |
H |
H |
0.54,0.74,0.92 |
|
Help system |
VH |
VH |
VH |
VH |
VH |
0.70,0.9, 1.0 |
|
|
Subjectively pleasing |
VH |
VH |
VH |
VH |
H |
0.66,0.86,0.98 |
|
|
Errors and Pop-Ups |
L |
M |
L |
L |
L |
0.14, 0.34,0.54 |
|
|
Online help support |
H |
H |
H |
H |
VH |
0.54,0.74,0.92 |
|
|
International language support |
VH |
VH |
VH |
VH |
VH |
0.7, 0.9, 1.0 |
|
|
Learn ability |
Percentage of observable properties |
VH |
H |
H |
H |
H |
0.54,0.74,0.92 |
|
Type of interface |
VH |
VH |
VH |
VH |
VH |
0.7, 0.9, 1.0 |
|
|
Operability |
Complexity of the functionalities |
VH |
H |
H |
H |
VH |
0.58,0.78,0.74 |
|
Type of interface |
VH |
VH |
VH |
VH |
VH |
0.7, 0.9, 1.0 |
|
|
Ease of use and navigability |
H |
VH |
VH |
H |
H |
0.58,0.78,0.74 |
|
|
Attractiveness |
Usage of graphics to enhance attractiveness |
VH |
VH |
VH |
VH |
VH |
0.7, 0.9, 1.0 |
|
Usability compliance |
software adhere to standards, conventions or regulations regarding to usability |
H |
H |
H |
M |
M |
0.42, 0.62,0.82 |
Table 5. Fuzzy Weights of the Metrics Belonging to the Usability Characteristic for Ms-Excel 2007
|
Characteristics |
Sub-Characteristics |
U1 |
U2 |
U3 |
U2 |
U5 |
Avg. Weight |
|
Understandability |
Documentation |
VH |
VH |
VH |
H |
H |
0.65,0.90, 1.0 |
|
Help system |
VH |
H |
VH |
H |
VH |
0.65,0.90, 1.0 |
|
|
Subjectively pleasing |
VH |
VH |
VH |
VH |
H |
0.70,0.95,1.0 |
|
|
Errors and Pop-Ups |
L |
L |
M |
L |
L |
0.05,0.3, 0.55 |
|
|
Online help support |
H |
H |
H |
H |
H |
0.50,0.75,1.0 |
|
|
International language support |
VH |
VH |
VH |
VH |
VH |
0.75,1.0,1.0 |
|
|
Learn ability |
Percentage of observable properties |
VH |
H |
H |
H |
VH |
0.60,0.85,1.0 |
|
Type of interface |
VH |
VH |
VH |
VH |
VH |
0.75,1.0,1.0 |
|
|
Operability |
Complexity of the functionalities |
VH |
H |
H |
H |
VH |
0.60,0.85,1.0 |
|
Type of interface |
VH |
VH |
VH |
VH |
VH |
0.75,1.0,1.0 |
|
|
Ease of use and navigability |
VH |
H |
VH |
VH |
H |
0.65,0.90, 1.0 |
Now these ratings and weights of the sub characteristics such as Understandability, Learn ability, Operability, Attractiveness and Usability compliance have to be combined by taking the weighted average to get the exact fuzzy rating of usability. This calculation is based on the formula as given in equation 1.
r 1× w 1 + r 2 × w2 + .. r n× w n = Σ r i × w i where i belongs to the different sets Here r1 is rating by user 1, r2 is rating by user2. Similarly w1, w2 are weights by different user.
X X rusability = runderstandability wunderstandability + rlearnability wlearnability + roperability woperability+ rattractiveness wattractiveness+ rusability_compliance wusability_compliance
The fuzzy rating of Usability. (r usability ) = (0.39, 0.81, 1.0)
Table 6. Fuzzy Ratings (calculated) of the Sub Characteristics belonging to the Usability Characteristic for Ms-Excel 2007
|
Characteristics |
Rating |
Sub-Characteristics |
Average Rating |
Average Weight |
|
Understandability |
0.53,0.90, 1.0 |
Documentation |
0.54,0.74,0.92 |
0.65 ,0.90, 1.0 |
|
Help system |
0.70,0.9, 1.0 |
0.65 ,0.90, 1.0 |
||
|
Subjectively pleasing |
0.66,0.86,0.98 |
0.70,0.95,1.0 |
||
|
Errors and Pop-Ups |
0.14, 0.34,0.54 |
0.05,0.3, 0.55 |
||
|
Online help support |
0.54,0.74,0.92 |
0.50,0.75,1.0 |
||
|
International language support |
0.70, 0.90, 1.0 |
0.75,1.0,1.0 |
||
|
Learn ability |
0.53, 0.90,1.0 |
Percentage of observable properties |
0.54,0.74,0.92 |
0.60,0.85,1.0 |
|
Type of interface |
0.70, 0.90, 1.0 |
0.75,1.0,1.0 |
||
|
Operability |
0.53, 0.90,1.0 |
Complexity of the functionalities |
0.58,0.78,0.74 |
0.60,0.85,1.0 |
|
Type of interface |
0.7, 0.9, 1.0 |
0.75,1.0,1.0 |
||
|
Ease of use and navigability |
0.58,0.78,0.74 |
0.65 ,0.90, 1.0 |
||
|
Attractiveness |
0.70, 0.90, 1.0 |
Usage of graphics to enhance attractiveness |
0.70, 0.90, 1.0 |
NA |
|
Usability compliance |
0.42, 0.62,0.82 |
software adhere to standards, conventions, style guides or regulations regarding to usability |
0.42, 0.62,0.82 |
NA |
Table 7. Fuzzy Weights of the Sub Characteristics Belonging to the Usability Characteristic for Ms-Excel 2007
|
Usability |
Sub Characteristics |
U1 |
U2 |
U3 |
U4 |
U5 |
Avg. Weight |
|
Importance to all these sub Characteristics (Weight) |
Understandability |
H |
VH |
M |
M |
H |
0.45, 0.7, 0.9 |
|
Learn ability |
VH |
VH |
H |
VH |
H |
0.65,0.90,1.0 |
|
|
Operability |
VH |
VH |
H |
H |
H |
0.60,0.85,1.0 |
|
|
Attractiveness |
VH |
H |
H |
H |
H |
0.55,0.80,1.0 |
|
|
Usability compliance |
H |
H |
VH |
VH |
H |
0.60,0.85,1.0 |
Table 8. Fuzzy Net Ratings for Usability for Ms-Excel 2007
|
Net Rating Usability (r usability ) |
Sub Characteristics |
Avg. Rating |
Avg. Weight |
|
0.39, 0.81, 1.0 |
Understandability |
0.53,0.90, 1.0 |
0.45, 0.7, 0.9 |
|
Learn ability |
0.53, 0.90,1.0 |
0.65,0.90,1.0 |
|
|
Operability |
0.53, 0.90,1.0 |
0.60,0.85,1.0 |
|
|
Attractiveness |
0.70, 0.90, 1.0 |
0.55,0.80,1.0 |
|
|
Usability compliance |
0.42, 0.62,0.82 |
0.60,0.85,1.0 |
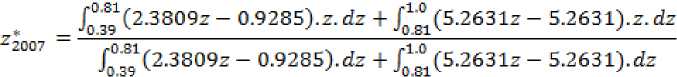
Now the fuzzy rating of Usability can be defuzzified using the Centroid formula to obtain the crisp(or numeric) value as given below. This value lies in the interval [0 to 1]. This is illustrated below:
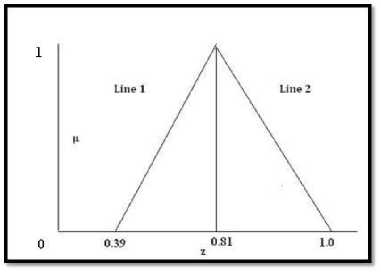
Fig. 1. The Fuzzy Membership Function (defuzzification) for Ms-Excel 2007
Centroid formula
„ _ J" ^z)-z. dz " J ^ydz
Here z* is the defuzzified crisp (or numeric) value. z is the value on x axis and μ (z) is the membership function.
Equation of Line 1:
z – 0.42µ = 0.39 (1)
µ = (2.3809z – 0.9285)
Equation of Line 2:
z – 0.19µ = 1.0. (2)
µ = (5.2631z – 5.26)
Putting the values of µ at centroid formula as given above
0.14-0.082 0.058
^2007 =----------7 =---- = 051
2007 0.209- 0.095 0.114
So the crisp (or numeric) value of the usability for Ms-Excel 2007 is calculated as 0.51.
-
B. Usability Evaluation of MS-Excel 2010
The real time values of the metrics related to usability are shown in Table 9. The values of these metrics have been acquired from five different Ms-Excel users on the basis of a questionnaire. Table 10 shows the ratings of the metrics corresponding to the usability characteristic. After classifying the metrics in the corresponding fuzzy sets, they have been assigned appropriate triangular fuzzy numbers as shown in the Table 10. Table 11 shows the values of the weights that have been taken from five users. These weights have also been acquired via a questionnaire. This Table also shows the fuzzified value of the weights after taking their average.
Table 9. Values of Real time Metrics for the Usability Characteristic for Ms-Excel 2010
|
Characteristics |
Sub-Characteristics(Metrics) |
U |
|
Understandability |
Documentation |
VH |
|
Help system |
VH |
|
|
Subjectively pleasing |
VH |
|
|
Errors and Pop-Ups |
H |
|
|
Online help support |
VH |
|
|
International language support |
VH |
|
|
Learn ability |
Percentage of observable properties |
VH |
|
Type of interface |
VH |
|
|
Operability |
Complexity of the functionalities |
VH |
|
Type of interface |
VH |
|
|
Ease of use and navigability |
VH |
|
|
Attractiveness |
Usage of graphics to enhance attractiveness |
VH |
|
Usability compliance |
software adhere to standards, regarding to usability |
VH |
Table 10. Fuzzy Ratings of the Metrics Belonging to Usability Characteristic for Ms-Excel 2010
|
Characteristics |
Sub-Characteristics (Metrics) |
U1 |
U2 |
U3 |
U4 |
U5 |
Avg. Rating |
|
Understandability |
Documentation |
VH |
VH |
VH |
VH |
H |
0.66,0.86,0.98 |
|
Help system |
VH |
VH |
VH |
VH |
VH |
0.70,0.9, 1.0 |
|
|
Subjectively pleasing |
VH |
VH |
VH |
H |
VH |
0.66,0.86,0.98 |
|
|
Errors and Pop-Ups |
H |
VH |
M |
H |
H |
0.50,0.70,0.88 |
|
|
Online help support |
VH |
VH |
VH |
VH |
VH |
0.70,0.9, 1.0 |
|
|
International language support |
VH |
VH |
VH |
VH |
VH |
0.70,0.9, 1.0 |
|
|
Learn ability |
Percentage of observable properties |
VH |
VH |
VH |
H |
H |
0.62,0.82,0.96 |
|
Type of interface |
VH |
VH |
VH |
VH |
VH |
0.70,0.9, 1.0 |
|
|
Operability |
Complexity of the functionalities |
VH |
H |
VH |
VH |
VH |
0.66,0.86,0.98 |
|
Type of interface |
VH |
VH |
VH |
VH |
VH |
0.70,0.9, 1.0 |
|
|
Ease of use and navigability |
VH |
VH |
VH |
VH |
H |
0.66,0.86,0.98 |
|
|
Attractiveness |
Usage of graphics to enhance attractiveness |
VH |
VH |
VH |
VH |
VH |
0.70,0.9, 1.0 |
|
Usability compliance |
software adhere to standards, conventions or regulations regarding to usability |
VH |
H |
VH |
H |
M |
0.54,0.74,0.90 |
Table 11. Fuzzy Weights of the Metrics Belonging to the Usability Characteristic for Ms-Excel 2010
|
Characteristics |
Sub-Characteristics (Matrices) |
U1 |
U2 |
U3 |
U4 |
U5 |
Avg. Weight |
|
Understandability |
Documentation |
VH |
VH |
VH |
VH |
VH |
0.75,1.0,1.0 |
|
Help system |
VH |
H |
VH |
VH |
VH |
0.70,0.95,1.0 |
|
|
Subjectively pleasing |
VH |
VH |
VH |
VH |
VH |
0.75,1.0,1.0 |
|
|
Errors and Pop-Ups |
VH |
H |
M |
VH |
H |
0.55,0.80,0.95 |
|
|
Online help support |
VH |
VH |
VH |
H |
H |
0.65 ,0.90, 1.0 |
|
|
International language support |
VH |
VH |
VH |
VH |
VH |
0.75,1.0,1.0 |
|
|
Learn ability |
Percentage of observable properties |
VH |
H |
H |
VH |
VH |
0.65 ,0.90, 1.0 |
|
Type of interface |
VH |
VH |
VH |
VH |
VH |
0.75,1.0,1.0 |
|
|
Operability |
Complexity of the functionalities |
VH |
H |
VH |
H |
VH |
0.65 ,0.90, 1.0 |
|
Type of interface |
VH |
VH |
VH |
VH |
VH |
0.75,1.0,1.0 |
|
|
Ease of use and navigability |
VH |
VH |
VH |
VH |
H |
0.70,0.95,1.0 |
In Table 12 the ratings (r i ) of the metrics (belonging to usability) have been multiplied by corresponding weights (w i ) and then added together to get the ratings of the corresponding sub characteristics. In Table 13 shows the weights of different sub characteristics under the usability characteristic. These have also been acquired by the questionnaire based interactive interface.
X X rusability runderstandability wunderstandability rlearnability wlearnability + roperability woperability+ rattractiveness wattractiveness+ rusability_compliance wusability_compliance
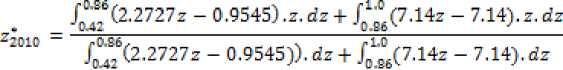
The fuzzy rating of Usability. (r usability )= (0.42, 0.86, 1.0)
Table 12. Fuzzy Ratings (calculated) of the Sub Characteristics belonging to the Usability Characteristic for Ms-Excel 2010
|
Characteristics |
Rating |
Matrices |
Average Rating |
Average Weight |
|
Understandability |
0.53,0.90,1.0 |
Documentation |
0.66,0.86,0.98 |
0.75,1.0,1.0 |
|
Help system |
0.70,0.9, 1.0 |
0.70,0.95,1.0 |
||
|
Subjectively pleasing |
0.66,0.86,0.98 |
0.75,1.0,1.0 |
||
|
Errors and Pop-Ups |
0.50,0.70,0.88 |
0.55,0.80,0.95 |
||
|
Online help support |
0.70,0.9, 1.0 |
0.65 ,0.90, 1.0 |
||
|
International language support |
0.70,0.9, 1.0 |
0.75,1.0,1.0 |
||
|
Learn ability |
0.53,0.90,1.0 |
Percentage of observable properties |
0.62,0.82,0.96 |
0.65 ,0.90, 1.0 |
|
Type of interface |
0.70,0.9, 1.0 |
0.75,1.0,1.0 |
||
|
Operability |
0.53,0.90,1.0 |
Complexity of the functionalities |
0.66,0.86,0.98 |
0.65 ,0.90, 1.0 |
|
Type of interface |
0.70,0.9, 1.0 |
0.75,1.0,1.0 |
||
|
Ease of use and navigability |
0.66,0.86,0.98 |
0.70,0.95,1.0 |
||
|
Attractiveness |
0.70,0.9, 1.0 |
Usage of graphics to enhance attractiveness |
0.70,0.9, 1.0 |
NA |
|
Usability compliance |
0.54,0.74,0.90 |
software adhere to standards, conventions, style guides or regulations regarding to usability |
0.54,0.74,0.90 |
NA |
Table 13. Fuzzy Weights of the Sub Characteristics Belonging to the Usability Characteristic for Ms-Excel 2010
|
Usability |
Sub Characteristics |
U1 |
U2 |
U3 |
U4 |
U5 |
Avg. Weight |
|
Importance to all these sub Characteristics (Weight) |
Understandability |
VH |
VH |
H |
H |
VH |
0.65 ,0.90, 1.0 |
|
Learn ability |
VH |
VH |
H |
VH |
H |
0.65 ,0.90, 1.0 |
|
|
Operability |
H |
VH |
VH |
VH |
VH |
0.70,0.95,1.0 |
|
|
Attractiveness |
VH |
VH |
M |
H |
VH |
0.60,0.85,0.95 |
|
|
Usability compliance |
VH |
H |
VH |
H |
H |
0.65, 0.9, 1.0 |
Table 14. Fuzzy Net Ratings for Usability for Ms-Excel 2010
|
Net Rating Usability (r usability ) |
Sub Characteristics |
Avg. Rating |
Avg. Weight |
|
0.42,0.86,1.0 |
Understandability |
0.53,0.90,1.0 |
0.65 ,0.90, 1.0 |
|
Learn ability |
0.53,0.90,1.0 |
0.65 ,0.90, 1.0 |
|
|
Operability |
0.53,0.90,1.0 |
0.70,0.95,1.0 |
|
|
Attractiveness |
0.70,0.9, 1.0 |
0.60,0.85,0.95 |
|
|
Usability compliance |
0.54,0.74,0.90 |
0.65, 0.9, 1.0 |
Now the fuzzy rating of Usability can be defuzzified using the Centroid formula to obtain the crisp value as given below. This value lies in the interval [0 to 1]. This is illustrated below
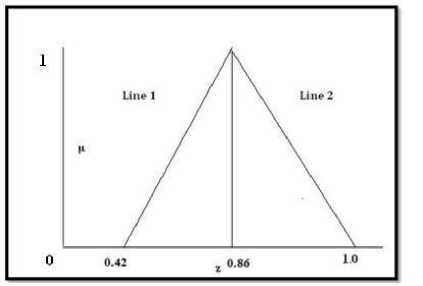
Fig 2. The Fuzzy Membership Function (defuzzification) for Ms-Excel
Centroid formula
Here z* is the defuzzified crisp value. z is the value on x axis and μ (z) is the membership function.
Equation of Line 1:
z – 0.44µ = 0.42 (3)
µ = (2.2727z – 0.9545)
Equation of Line 2:
z – 0.14µ = 1.0 (4)
µ = (7.14z – 7.14)
Putting the values at centroid formula gives:
0.156 - 0.063
0.22 - 0.07
0.093Z2‘010 = 0Л5" " 0 62
So the crisp (or numeric) value of the usability for Ms-Excel 2010 is calculated as 0.62.
-
VII. Usability Analysis
In section VI, the different crisp values of office applications Ms-Excel 2007 and Ms-Excel 2010 are evaluated. The usability value for Ms-Excel 2007 and Ms-Excel 2010 is:
Z 2007 = 0.51
Z 2010 = 0.62
So, by evaluation, it is found that Usability of Ms-Excel 2010 is better than Ms-Excel 2007.
-
VIII. Conclusion
This paper evaluated the software usability of Ms-Excel 2007 and Ms-Excel 2010 after carefully analysis of the various software usability parameters. It gives the software usability in terms of triangular fuzzy sets, which can be defuzzified to get the crisp (or numeric) value for Ms-Excel 2007 and Ms-Excel 2010. Paper also measured and compared the usability of Ms-Excel 2007 and Ms-Excel 2010 office application by using multi criteria
fuzzy technique. The comparison of the crisp values of usability for Ms-Excel 2007 and Ms- Excel 2010 identify that Ms-Excel 2010 is better product and more suitable for a given set of users in a certain environment. In future, this methodology may be used to compare the usability of well known applications for more enhancements in the present criteria.
References Measurement of Usability of Office Application Using a Fuzzy Multi-Criteria Technique
- R. W. Hoyer, and B. B. Y.Hoyer, "What is quality?", Quality Progress, no. 7, pp. 52-62, 2001.
- International Organization for Standardization. ISO 9241-11, Ergonomic requirements for office work with visual display terminals (VDTs), Part 11: Guidance on usability. Geneva Switzerland: Author,1998.
- International Organization for Standardization/ International Electro Technical Commission. ISO/IEC 9126-1, Software Engineering, product Quality, Part 1: Quality Model, Geneva Switzerland: Author, 2001.
- J. Grudin ,”Utility and usability research issues and development context”, Interacting with computer, vol. 4, no. 2, pp. 209-217, 1992.
- T.J. Ross, Fuzzy Logic with Engineering Applications,2nd Ed, Wiley India Pvt. Ltd, New Delhi, India, 2004.
- P. R. Srivastava and K. Kumar, “An Approach towards Software Quality Assessment,” Communications in Computer and Information Systems Series (CCIS Springer Verlag), Vol.31, No.6, 2009, pp.345-346.
- P. R. Srivastava, A. P. Singh, K.V. Vageesh, “Assessment of Software Quality: A Fuzzy Multi Criteria Approach,” Evolution of Computationand Optimization Algorithms in Software Engineering: Applications and Techniques, IGI Global USA, 2010, chapter - 11, pp.200-219.
- A. Sharma, R. Kumar and P.S. Grover, “Estimation of Quality for Software Components - an Empirical Approach,” ACM SIGSOFT Software Engineering Notes, Vol.33, No.5, November, 2008, pp.1-10.
- S.A. Slaughter, D. E. Harter, & M. S. Krishnan, “Evaluating the Cost of Software Quality” Communications of the ACM, Vol.41, No.8, August, 1998, pp.67-73.
- M. Agarwal, & K. Chari, “Software Effort, Quality, and Cycle Time: A Study of CMM Level 5 Projects,” IEEE Transactions on Software Engineering, Vol.33, No.3, March, 2007, pp.145-156.
- O. Maryoly, M.A. Perez and T. Rojas, “Construction of a Systemic Quality Model for Evaluating Software Product,” Software Quality Journal, Vol.11, No.3, July, 2003, pp.219-242.
- O. Lamouchi, A.R. Cherif, and N. Lévy, “A framework based measurements for evaluating an IS quality,” Proceedings of the fifth on Asia-Pacific conference on conceptual modelling, Wollongong, NSW, Australia, January, 2008, pp.39-47.
- I. Heitlager, T.Kuipers, J.Visser, “A Practical Model for Measuring Maintainability - a preliminary report,” 6th International Conference on Quality of Information and Communications Technology (QUATIC), September, 2007, pp.30-39.
- R. Fitzpatrick and C. Higgins, “Usable Software and its Attributes:A synthesis of Software Quality European Community Law and Human-Computer Interaction”, Proceedings of the HCI'98 Conference, Springer, London, United Kingdom. 1998, pp.1-19.
- M. Bertoa and A. Vallecillo, “Usability metrics for software components,” Proceedings of Quantitative Approaches in Object-Oriented Software Engineering (QAOOSE), Oslo, April, 2006, pp.136-143.
- L. Lin and H. M. Lee, “A Fuzzy Software Quality Assessment Model to Evaluate User Satisfaction,” Proceedings of the Second International Conference on Innovative Computing, Information and Control, Washington DC, USA, September, 2007, pp.438-442.
- B. Yang, L. Yao and H. Z. Huang, “Early Software Quality Prediction Based on a Fuzzy Neural Network Model,” Proceedings of the Second International Conference on Innovative Computing, Information and Control, Washington DC, USA, September, 2007, pp.760-764
- G. Buyukozkan, C. Kahramanand D. Ruan, “A fuzzy multi-criteria decision approach for software development strategy selection,” International Journal ofGeneral Systems, Vol.33, No.(2-3), 2004, pp.259-280.
- P. C. Fishburn, mUtility Theory for Decision Making, Wiley, New York, 1964.
- B. Roy, “Problems and Methods with Multiple Objective Functions, Math. Program,” Vol.1, 1971, pp.239-266.
- S. Kanhe, “A Contribution to Decision Making in Environmental Design,” Proceedings of the IEEE, Vol.63, Issue.3, 1975, pp.518-528.
- G. Klir and T. Folger, “Fuzzy Sets, Uncertainty and Information,” Prentice Hall, New Jersey, USA, 1988.
- S. M. Baas and H. Kwakernaak, “Rating and Ranking of Multiple - Aspect Alternatives Using Fuzzy Sets,”Automatica, Vol.13, No.1, 1977, pp.47-58.
- C. Carlssonand R. Fuller, “Fuzzy multiple criteria decision making: Recent developments,” Fuzzy Sets and Systems, Vol.78, 1996, pp.139-153.
- P. R. Srivastava, A. P. Singh, K.V. Vageesh, “Assessment of Software Quality: A Fuzzy Multi – Criteria Approach,” Evolution of Computation and Optimization Algorithms in Software Engineering: Applications and Techniques, IGI Global USA, 2010, chapter - 11, pp.200-219.
- P. B., Crosby, Quality is free : the art of making quality certain, New York : McGraw-Hill, 1979.
- W. E. Deming, , Out of the crisis : quality, productivity and competitive position, Cambridge Univ. Press, 1988.
- A. V. Feigenbaum, Total quality control, McGraw-Hill, 1983.
- Ishikawa, K., What is total quality control? : the Japanese way, Prentice-Hall, 1985.
- J. M. Juran, Juran's Quality Control Handbook, McGraw-Hill, 1988.
- B. W. Boehm, J. R. Brown and M. L. Lipow, - Quantitative Evaluation of Software Quality, Proceedings of the 2nd International Conference on Software Engineering, San Francisco, CA, USA, October,1976, pp.592-605.
- J. A. McCall, P. K. Richards, and G. F. Walters, Factors in Software Quality, 1977, Vol.I, II, and III, US Rome Air Development Center Reports - NTIS AD/A-049 014, NTIS AD/A-049 015 and NTIS AD/A-049 016, U. S. Department of Commerce.
- R. G. Dromey, - A model for software product quality, IEEE Transactions on Software Engineering, Vol.21, No.2, February, 1995, pp.146-162.
