Modelling of food security in the region

Author: Chekavinskii Aleksandr Nikolaevich, Selimenkov Roman Yurevich
Journal: Economic and Social Changes: Facts, Trends, Forecast @volnc-esc-en
Section: Branch-wise economy
Article in issue: 4 (34) т.7, 2014.
Free access
The article considers indicators that can be used for evaluating the condition of food security in the region. Taking into consideration the approaches existing in scientific literature, the authors have substantiated optimal and critical values of the ratios of sufficiency of consumption and affordability of food. Statistical data on the Vologda Oblast have been processed and on this basis the economic-mathematical models have been built, which reflect the influence of various factors on food security. The authors have determined that the main factors include the per capita volume of import and domestic production of food, the level of intensity of agriculture and economic activity of population, and the proportion of residents with incomes below the subsistence level. Trend models have been composed for each of the factor variables; these models, with the help of extrapolation method, have been used for calculating forecast values and determining the parameters of the coefficients of sufficiency of consumption and economic affordability of food. The revealed relationships have helped identify key areas of regional policy that contribute to improvement of food security in the Vologda Oblast.
Food security in the region, economic-mathematical model, sufficiency of consumption and economic accessibility of food
Short address: https://sciup.org/147223623
IDR: 147223623 | UDC: 338.43(470.12) | DOI: 10.15838/esc/2014.4.34.20
Text of the scientific article Modelling of food security in the region
The issues concerning identification of threats to economic security and substantiation of mechanisms to neutralize them are becoming very acute in the context of increasing openness of the Russian economy. Food security acquires critical importance. This is caused primarily by the fact that, since food consumption is a vital necessity of population, the creation of conditions to provide food of appropriate quality in the required amount and for affordable prices is one of the priorities for authorities at all levels.
The analysis of statistics data allows us to say that the tools currently used in public and municipal administration do not ensure a fully acceptable level of food security in Russia. For example, although every resident of Russia has the opportunity to purchase food, it is largely supported by import. In 2013 the share of import accounted for nearly 24% in the total amount of consumed milk, as for meat, this figure was 23% (fig. 1). The demand for some foodstuffs is covered partly by supplies from abroad. Therefore, measures to promote competition in the domestic market, the customs-tariff regulation, promotion of agricultural production do not reduce the risk of food shortages as a result of termination (reduction of volume) of import.
The issue of food security in Russia is aggravated by problems in the sectors such as storing, processing and distribution of food to the population. The Strategy for development of food and processing industry in Russia for the period up to 2020 [5] indicates that the production capacities of flour and grain mill, baking, sugar, dairy and meat industries are mostly physically and morally obsolete (depreciation of equipment is 70–80%), and they are used by less than half.
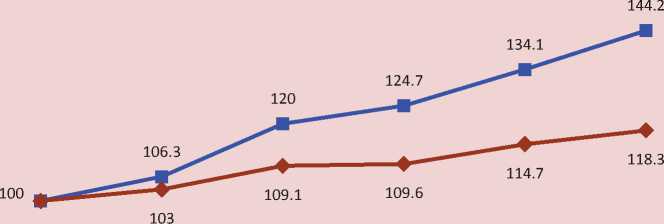
In general, economic affordability of food remains low. This is caused largely by the excess of food prices growth rate compared to the growth rate of real monetary incomes of population, which leads to a decrease in their purchasing power (fig. 2) .
Figure 1. Share of food import in Russia in total consumption, %
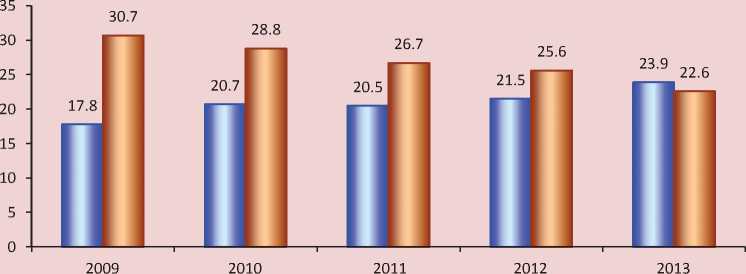
□ Milk □ Meat
Source: calculated according to the food balance sheets of Rosstat.
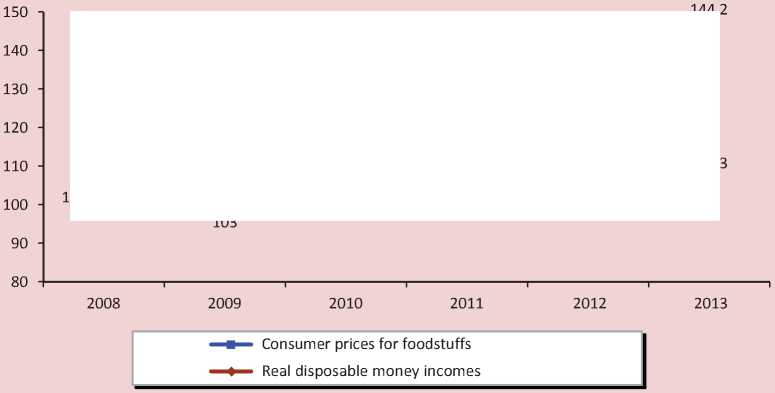
Source: calculated according to Rosstat.
Figure 2. Growth rate of consumer food prices and real disposable money incomes of Russia’s population, in % to 2008
Therefore, in the near future, state and municipal authorities should solve the problem of expanding citizens’ opportunities to purchase high-quality food.
There are other issues of food security in Russia that urge governments at all levels to take appropriate and timely measures. In particular, it is necessary to reduce the degree of monopolization of agricultural market by foreign companies 1 , to deprive them of an opportunity to control agricultural land 2 .
At the same time, another important issue for the management of food security at the regional level is connected with the absence of a mathematical model to assess and forecast its condition, taking into account the set of factors that influence supply and demand on the regional food market. This article is devoted to the solution of this problem.
The summary of a number of works of Russian scientists [1, 4] provided an opportunity to determine the set of conditions that ensures food security at the regional level. They consist in the ability of the system of production, storage, processing, wholesale and retail trade of food products to satisfy (consistently and evenly throughout a year) the needs of all social groups in the volume of consumption that meets evidence-based medical standards.
At the same time, and it is also important, economic entities involved in the production and sales of food, must function in the mode of extended reproduction.
Therefore, a crucial requirement to ensure food security in the region is the sufficiency of consumption of basic foodstuffs. In our opinion, its level can be estimated by using the coefficient (C sf ), which represents the ratio of the actual amount of consumption of the i-th food ( Ca ) to the amount corresponding to rational standards ( Cs ) 3 :
„ с
Csf = . (1)
C s
If the value of the coefficient is one unit, we can talk about the optimal level of sufficiency of food consumption. It will become critical when the value of the coefficient of sufficiency ( Csf ) will be less than the ratio of the amount of consumption of the i-th food product according to medical standards to the appropriate volume in the minimum consumer basket.
Our calculations show that the lower threshold of the coefficient of sufficiency in 2012 was as follows: for potato – 0.85, for milk – 0.87, for meat and meat products – 0.74, for vegetables – 0.80, for eggs – 0.79.
Another important requirement for ensuring food security in the region lies in economic affordability of food for the population. Its level can be measured using the index (Cab ), which represents the ratio of the value of consumer (food) basket (Vcb ) to average per capita income (I ):
C ab = X 100. (2)
We shall consider the lower threshold of the share of expenditures on food in household budgets to be 10% ( optimal level ). This level is typical for the average resident of the United States and developed countries such as the UK, Switzerland [7]. If the cost of the minimum set of food products in the total expenditure ranges from 10 to 20%, the affordability of food can be considered average . This level is observed in France, Spain, Italy, Portugal. If the share of food expenditure is more than 20% but less than 30%, this indicates the low standard of living, and, consequently, low economic access to food (Latvia, Estonia).
When the ratio exceeds 30%, there are significant difficulties in the purchase of foodstuffs, i.e. we can say that the level of their economic affordability is critical (Belarus, Ukraine, Moldova).
Thus, modeling the values of the above coefficients, it is possible to forecast the level of food security in the region, and to identify the reserves for its improvement.
We have determined the degree of influence of various factors on the dynamics of food consumption sufficiency in the course of conducting the correlation-regression analysis of the data from the official statistical reporting on the Vologda Oblast for 2000– 2011. The results of the calculations show that the greatest impact on achieving an optimal level of this coefficient is caused by factors such as the size of the cultivated area
(for potatoes), population of cows and birds (for milk and eggs). A general view of economic-mathematical models is presented in table 1 .
They all describe a significant proportion of the explained variation, and they are significant according to the Fisher’s F -test.
The obtained equations show that the level of per capita consumption of milk, meat and eggs can be optimized either by increa- sing their import or enhancing domestic production, or accelerating the intensification of agribusiness in the region.
The economic availability of food, as it is evidenced by the results of the regression analysis, is influenced significantly by factors that characterize the standard of living. Thus, if the proportion of residents with incomes below the subsistence level increases by 1%, the coefficient of affordability will
Table 1. Results of simulation of the ratio of efficiency of consumption of foodstuffs
C b = 27.853 + 1.482 x X, + 0.011 x X 2 -
- 0.528 x X 3 , (3)
where:
Cab – coefficient of economic affordability of food products, %;
-
X1 – the proportion of the population with incomes below the subsistence level, %;
-
X 2 – consumer price index, %;
-
X 3 – the level of economic activity of population, %.
The factors that are taken into account in the model of calculating the coefficient of affordability cause 98% of the explained variation with 95% probability. The regression equation is significant by all the statistical parameters.
The forecast of the values of the coefficient of sufficiency and coefficient of economic affordability on the basis of obtained economic-mathematical models is possible with extrapolation of the trends of factorial variables within them. Equations of trends are described with linear, polynomial, exponential and logarithmic functions.
The results of forecast calculations indicate that, if we proceed from the current retrospective trends, then the per capita production of potato in the Vologda Oblast in 2014 can be reduced in comparison with 2011 by 28%, meat and meat products – by 0.7% (tab. 2). At the same time it is possible to increase the production of milk and dairy products by 2.1%, eggs – by 2.7%. The level of economic activity of the population and the consumer price index over the forecast period will not change significantly. The share of the population with incomes below the subsistence level in 2014 can increase from 17.1% to 21.7%.
The forecast values of factor variables have been substituted into the obtained regression equations, after that the values of the coefficients of sufficiency of consumption and coefficient of economic affordability of food have been determined. The calculations allow us to conclude that in the future the average per capita consumption of potato will decrease and reach the critical level of 83% from the physiological norm (tab. 3) . An average resident of Vologda will consume more milk and meat and their derivatives. Consumption of eggs in the forecast period will not change significantly and remain at the same level, which is 24% higher than the physiological norm. Economic affordability of food in the future will decrease due to the significant increase in the share of the population with incomes below the subsistence level.
Summarizing the results of these measurements, we can come to the conclusion that to ensure food security in the Vologda Oblast its government and municipal authorities should pay attention first of all to the enhancement of economic affordability of food. Much is already being done in these areas. For instance, all municipalities since 2012 have been implementing the action “Yellow price tag”, which sets the minimum price markup for socially important food products.
Table 2. Forecast of the values of factor variables used in the models for calculating the coefficient of sufficiency of consumption and the coefficient of economic affordability of food
|
Indicator (factor variable) |
Trend equation |
Fact |
Forecast |
2014 to 2011, % |
||
|
2011 |
2012 |
2013 |
2014 |
|||
|
Import of potato, kg/person |
y = -0.314Ln(x) + 1.935 |
1.4 |
1.1 |
1.1 |
1.1 |
78.6 |
|
Production of potato, kg/person |
y = 384.5x-0.324 |
222.3 |
167.7 |
163.7 |
160.1 |
72.0 |
|
Industrial consumption of potato, kg/person |
y = 222.7x-0.476 |
64.4 |
65.6 |
63.3 |
61.3 |
95.2 |
|
Import of potato, kg/person |
y = 0.368x2 – 6.981x + 40.241 |
12.2 |
11.7 |
14.7 |
18.3 |
150.0 |
|
Area for potato cultivation, ha/person |
y = 0.024x-0.167 |
0.016 |
0.016 |
0.015 |
0.015 |
93.8 |
|
Potato yield, centners/hectare |
y = 1.103x2 – 17.92x + 184.47 |
140.3 |
137.8 |
149.7 |
163.7 |
116.7 |
|
Import of milk, including from abroad, kg/person |
y = -2.185x2+ 33.82x - 38.66 |
41.4 |
38.6 |
36.0 |
33.6 |
81.2 |
|
Production of milk, kg/person |
y = 0.413x2 – 8.963x + 421.43 |
372.2 |
374.7 |
376.9 |
379.9 |
102.1 |
|
Industrial consumption of milk, kg/person |
y = -1.695x + 62.46 |
40.8 |
40.4 |
38.7 |
37.0 |
90.7 |
|
Export of milk, kg/person |
y = -2.638x2 + 37.99x + 64.09 |
133.6 |
122.3 |
111.9 |
102.4 |
76.6 |
|
Number of cows, head/person |
y = -0.0038x + 0.115 |
0.072 |
0.066 |
0.062 |
0.058 |
80.6 |
|
Yield of milk per cow, kg |
y = 3005x0.209 |
5127.0 |
5144.3 |
5224.8 |
5300.9 |
103.4 |
|
Import of meat, kg/person |
y = 2.0385x + 8.79 |
35.8 |
35.3 |
37.3 |
39.4 |
110.1 |
|
Production of meat, kg/person |
y = -0.222x + 43.79 |
40.8 |
40.9 |
40.7 |
40.5 |
99.3 |
|
Industrial consumption of meat, kg/person |
y = 0.0005x + 0.078 |
0.08 |
0.08 |
0.08 |
0.08 |
100.0 |
|
Export of meat, kg/person |
y = -1.108Ln(x) + 7.131 |
5.3 |
4.3 |
4.2 |
4.1 |
77.4 |
|
Cattle population, head/person |
y = -0.0078x + 0.244 |
0.154 |
0.143 |
0.135 |
0.127 |
82.5 |
|
Average daily gain of cattle, grams |
y = 13.963x + 415.41 |
583.7 |
596.9 |
610.9 |
624.9 |
107.1 |
|
Import of eggs, units/person |
y = 49.98Ln(x) – 8.998 |
119.4 |
119.2 |
122.9 |
126.4 |
105.9 |
|
Production of eggs, units/person |
y = 6.648x + 415.25 |
501.3 |
501.7 |
508.3 |
515.0 |
102.7 |
|
Industrial consumption of eggs, units/person |
y = -0.117x2 + 2.137x + 19.37 |
25.3 |
27.3 |
26.3 |
25.0 |
98.8 |
|
Export of eggs, units/person |
y = 9.924x + 148.71 |
279.3 |
277.7 |
287.7 |
297.6 |
106.6 |
|
Poultry population, head/person |
y = 0.011x + 3.337 |
3.6 |
3.48 |
3.49 |
3.50 |
97.2 |
|
Average egg-laying capacity, units |
y = 1.273x + 292.56 |
322.0 |
309.1 |
310.4 |
311.7 |
96.8 |
|
Proportion of population with incomes below subsistence level, % |
y = 0.152x2 – 2.723x + 28.36 |
17.1 |
18.6 |
20.0 |
21.7 |
4.6 |
|
Consumer price index, % |
y = 118.8x-0.0407 |
106.4 |
107.0 |
106.7 |
106.4 |
0.0 |
|
Level of economic activity, % |
y = 66.30x0.017 |
69.5 |
69.3 |
69.4 |
69.5 |
0.0 |
Table 3. Forecast values of the coefficient of sufficiency of consumption and economic affordability of foodstuffs
Thus, it is possible to achieve an optimal level of sufficiency of consumption and affordability of foodstuffs only if all the authorities and business implement the set of activities.
Cited works
-
1. Gumerov R.R. About the Development of Methodological and Theoretical Problems in the Study of Food Security in Russia. Russian Economic Journal , 2003, no.7, pp. 9-26.
-
2. Foreign Companies Started to Purchase Land in Russia . Available at: http://agroobzor.ru/article/a-141.html
-
3. Kostyleva L.V. Inequality of Russia’s Population: Trends, Factors, and Regulation: Monograph. Under the supervision of V.A. Ilyin, Doctor of Economics, Professor. Vologda: Institut sotsial’no-ekonomicheskogo razvitiya territorii RAN, 2011. 223 p.
-
4. Kostyaev A.I., Timofeev M.U. National and Regional Food Security. Regional Economy: Stabilization and Development: Collected Scientific Articles. Vol. 1. Moscow: VNIETUSKh, 2000. Pp. 500-517.
-
5. On Approval of the Strategy for Development of Food and Processing Industries of Russia for the Period up to 2020: Resolution of the Russian Federation Government of April 17, 2012 No. 559-r. Legal-Reference System “ConsultantPlus” .
-
6. Leonidova G.V., Ustinova K.A., Popov A.V., Panov A.M., Golovchin M.A., Solov’eva T.S., Chekmareva E.A. Public Administration Efficiency. Human Capital of Territories: Problems of Formation and Use: Monograph. Under general editorship of A.A. Shabunova. Vologda: Institut sotsial’no-ekonomicheskogo razvitiya territorii RAN, 2013. 184 p.
-
7. Rating of European Countries by the Share of Household Expenditure on Food . Available at: http://riarating.ru/ infografika/20131224/610604016.html
-
8. Participation of Foreign Capital in Russia’s Food Industry: Analysis of the Situation, Possible Consequences and Solutions . Available at: http://mcx-consult.ru/d/77622/d/uchastie-innostrannogo-kapitala-v-pischevoy-promylennosti-rossii_analiz.pdf
-
9. Chekavinskii A.N. Food Security of the Vologda Oblast: Condition and Problems. Territorial Development Issues , 2013, no.3, pp. 1-7. Available at:
References Modelling of food security in the region
- Uskova T.V., Selimenkov R.Yu., Chekavinskii A.N. Agropromyshlennyi kompleks regiona: sostoyanie, tendentsii, perspektivy: monografiya . Vologda: ISERT RAN, 2013. 136 p
- Gumerov R.R. K razrabotke metodologo-teoreticheskikh problem issledovaniya prodovol'stvennoi bezopasnosti Rossii . Rossiiskii ekonomicheskii zhurnal , 2003, no.7, pp. 9-26.
- Inostrannye kompanii nachali skupku zemli v Rossii . Available at: http://agroobzor.ru/article/a-141.html
- Kostyleva L.V. Neravenstvo naseleniya Rossii: tendentsii, faktory, regulirovanie: monografiya . Under the supervision of V.A. Ilyin, Doctor of Economics, Professor. Vologda: Institut sotsial'no-ekonomicheskogo razvitiya territorii RAN, 2011. 223 p.
- Костяев А.И., Тимофеев М.У. НАЦИОНАЛЬНАЯ И РЕГИОНАЛЬНАЯ ПРОДОВОЛЬСТВЕННАЯ БЕЗОПАСНОСТЬ // Региональная экономика: стабилизация и развитие Сборник научных трудов международной юбилейной конференции, посвященной 35-летию Всероссийского научно-исследовательского института экономики,труда и управления в сельском хозяйстве. Ответственные за выпуск И.Н. Буробкин, К.И. Панкова, В.Е. Толманов. 2000. С. 500-517.
- Ob utverzhdenii Strategii razvitiya pishchevoi i pererabatyvayushchei promyshlennosti Rossii na period do 2020 goda: rasporyazhenie Pravitel'stva Rossiiskoi Federatsii ot 17 aprelya 2012 g. № 559-r . Spravochno-pravovaya sistema “Konsul'tantPlyus” .
- Leonidova G.V., Ustinova K.A., Popov A.V., Panov A.M., Golovchin M.A., Solov'eva T.S., Chekmareva E.A. Problemy effektivnosti gosudarstvennogo upravleniya. Chelovecheskii kapital territorii: problemy formirovaniya i ispol'zovaniya: monografiya . Under general editorship of A.A. Shabunova. Vologda: Institut sotsial'no-ekonomicheskogo razvitiya territorii RAN, 2013. 184 p.
- Reiting stran Evropy po dole raskhodov semei na produkty pitaniya . Available at: http://riarating.ru/infografika/20131224/610604016.html
- Uchastie inostrannogo kapitala v pishchevoi promyshlennosti Rossii: analiz situatsii, vozmozhnye posledstviya i puti resheniya . Available at: http://mcx-consult.ru/d/77622/d/uchastie-innostrannogo-kapitala-v-pischevoy-promylennosti-rossii_analiz.pdf
- Chekavinskii A.N. Prodovol'stvennaya bezopasnost' Vologodskoi oblasti: sostoyanie i problem . Voprosy territorial'nogo razvitiya , 2013, no.3, pp. 1-7. Available at: http://vtr.vscc.ac.ru/?module=Articles&action=view&aid=2860
