Модификация индексов солнечной активности в международных справочных моделях ионосферы IRI и IRI-Plas в связи с пересмотром ряда чисел солнечных пятен

Автор: Гуляева Т.Л.
Журнал: Солнечно-земная физика @solnechno-zemnaya-fizika
Статья в выпуске: 3 т.2, 2016 года.
Бесплатный доступ
Международная справочная модель ионосферы IRI использует в качестве показателя уровня солнечной активности эффективный ионосферный индекс IG 12, выведенный по измерениям критической частоты f oF2 сетью ионозондов. В модели ионосферы и плазмосферы IRI-Plas в качестве эффективного показателя уровня солнечной активности используется глобальное электронное содержание ( GEC, global electron content), сглаженное скользящим 12-месячным фильтром, GEC 12. Расчеты GEC основаны на глобальных картах полного электронного содержания (ТЕС, total electron content) с 1998 г., а реконструкция его за предыдущие годы и прогноз на будущее выполнены по эмпирической модели линейной зависимости GEC от солнечной активности. В настоящее время возникла необходимость переоценки солнечных и ионосферных индексов в ионосферных моделях в связи с переходом с 1 июля 2015 г. на обновленный расчет ряда солнечных пятен - SSN 2 [Clette et al., 2014]. Использование SSN 2 вместо прежнего ряда SSN 1 приводит к увеличению погрешности прогнозов по ионосферной модели. Предлагается формула для преобразования сглаженного 12-месячным скользящим фильтром ряда SSN 212 в эквивалент ранее принятого базового индекса SSN 112= R 12, используемого для долгосрочного прогнозирования в моделях IRI и IRI-Plas. Выведены регрессионные соотношения между GEC 12, индексом солнечных пятен R 12 и индексом потока солнечного радиоизлучения на волне 10.7 см F 10.712. Сравнение расчетов по моделям IRI-Plas и IRI с данными наблюдений и прогноза по Москве в 23-м и 24-м циклах солнечной активности показало преимущество использования индекса GEC 12 с моделью IRI-Plas.
Глобальное электронное содержание, число солнечных пятен, поток солнечного радиоизлучения, ионосфера, плазмосфера, модель
Короткий адрес: https://sciup.org/142103613
IDR: 142103613 | УДК: 550.338.2 | DOI: 10.12737/20872
Текст научной статьи Модификация индексов солнечной активности в международных справочных моделях ионосферы IRI и IRI-Plas в связи с пересмотром ряда чисел солнечных пятен
Transionospheric radio wave propagation provides conditions for signal transmission in Earth-to-space and satellite-to-satellite communications. To ensure reliability of signal transmission and reception in long-term space experiments, ionospheric conditions are predicted using well-known models such as the International Reference Ionosphere (IRI), the ionospheric and plasmaspheric model IRI-Plas [Bilitza et al., 2011; Gulyaeva, Bilitza, 2012], the Russian standard model of the ionosphere SMI [Chasovitin et al., 1987], and the empirical model for calculating transionospheric radio wave propagation NeQuick [Nava et al., 2008]. Calculation results depend on what solar and ionospheric control parameters we set in the models. A need has arisen to re-evaluate solar and ionospheric control parameters of the ionospheric models due 87
to the recent revision of the long-term sunspot number time series over the period from 1818 to the present day [Clette et al., 2014]. The modified sunspot number time series SSN 2 significantly differs from the original long-term series SSN 1. Values of SSN 2 near the solar maximum are generally higher than those of the proxy solar index of 10.7 cm microwave radio flux, F 10.7, which, in turn, are on average by 60 units higher than values of SSN 1 [Ahluwalia, 2016]. The direct use of SSN 2 instead of SSN 1 for applied problems, specifically for predictions with the ionospheric models, can cause noticeable model calculation errors.
Some blocks of the ionospheric models IRI, IRI-Plas, SMI, and NeQuick are based on different solar activity indices or their ionospheric equivalents. In these models, 3D representation of electron density relies on fitting of vertical distribution of electron density to the maximum electron density and height of the F2 layer from planetary maps designed by the International Telecommunication Union ITU-R [CCIR Atlas, 1983]. The planetary maps of the critical frequency f oF2 and radio wave propagation factor M3000F2 related to the height of maximum ionization h mF2 are derived using the expansion coefficients of the spherical harmonic analysis of these parameters from ionosonde measurements. These coefficients are obtained as a function of latitude, longitude, universal time (UT) from 0 to 24 hr with a step of 1 hr, seasonal variations for twelve months and four solar activity levels R 12 =0, 50, 100, 150, with respective interpolation for intermediate values of these parameters [Jones, Gallett, 1965].
Procedure of IRI calculations of the F2-layer critical frequency f o F2 (or its related maximum electron density N m F2) with ITU-R maps uses the effective ionospheric index IG 12 , derived from f o F2 measurements by an ionosonde network, as a proxy of solar activity [Liu et al., 1983]. When calculating h m F2 in the IRI and IRI-Plas models from M3000F2 (ITU-R) maps, the f o F2 and f o E and the 12-month smoothed R 12 , based on the former sunspot number time series SSN 1, are used [Bilitza et al., 1979]. The ionospheric solar activity index IG [Liu et al., 1983] and the set smoothed by the sliding 12-months window, IG 12 , are based on noon values of f o F2 from measurements of 13 ionosondes, scaled to the sunspot numbers R 12 . The comparison of IG 12 with R 12 over the past six solar cycles [Bilitza et al., 2012] shows their differences most pronounced at solar maximum and minimum.
In literature, there are different proxies of solar activity indices used in the ionospheric models. The F 12 is shown to be more effective than R 12 for the long-term f oF2 predictions [Deminov, 2016]. According to [Ratovsky et al., 2015], the local model of F2-layer peak parameters depends linearly on F 10.7, normalized to F 10.7=100 i.u. (index unit 1 i.u. = 10–22 W·m–2·Hz–1). For modeling of total electron content (TEC) maps, the best accuracy is obtained with the proxy index of solar radio flux F 10.7 and sunspot number time series SSN 1 averaged over the sum of three components: 3-day smoothed daily, 7- and 27-day backward mean values [Maruyama, 2010]. The regression relationship between SSN 1 and F 10.7 used by the IRI and IRI-Plas models is valid until 2000, but it is changed after 2001 [Lukianova, Mursula, 2011]. At present, all former estimates of the efficiency of the sunspot number SSN 1 series need revising because this index is not measured any longer since July 1, 2015; instead, solar activity is monitored using the SSN 2 index [Clette et al., 2014].
The f o F2 and h m F2 are calculated from ITU-R maps by the IRI-Plas model, using the global electron content of Earth’s ionosphere and plasmasphere ( GEC ) produced from TEC maps as a proxy of solar activity [Afraimovich, Perevalova, 2006; Afraimovich et al., 2008; Gulyaeva, Veselovsky, 2014]. The advantage of IRI-Plas model over IRI is the plasmasphere model incorporated in vertical electron density and temperature profiles up to 20 200 km 88
above the Earth surface (the orbit of GPS satellites), whereas IRI allows calculations only to 2000 km in the ionosphere.
GEC is investigated in the present paper as a proxy of solar activity and compared with other solar and ionospheric indices, taking into account the recent revision of sunspot number time series. The purpose of this study is to update the set of control parameters in the IRI-Plas model, specifically for calculations of maximum electron density and F2-layer height from the source maps, and to warn users of the models against possible errors arising from the modified sunspot number time series implementation with the ionospheric models.
DYNAMICS OF SOLAR AND IONOSPHERIC INDICES
Figure 1 presents dynamics of the 12-month smoothed sunspot number time series SSN 1 12 and SSN 2 12 since 1931, including the prediction for solar cycle 24 until 2019, and of solar radio flux F 10.7 12 since 1957. Values of F 10.7 12 exceed by 40–60 units the corresponding values of SSN 1 12 (Figure 1), and F 10.7 12 has significantly exceeded SSN 2 12 since 2001 [Lukianova, Mursula, 2011]. The new sunspot number time series SSN 2 12 are much higher than SSN 1 12 ; near maxima of solar cycles 19 and 21 values of SSN 212 exceed even F 10.712 ones. This has never been observed for SSN 112.
The time series SSN 1 12 smoothed by the sliding 12-month window (denoted by R 12 ) are used to scale the control parameters IG 12 and GEC 12 for ITU-R calculations and their implementation in the above 3D ionospheric models. The upper limit R 12 =150 restricts the ITU-R set of coefficients due to saturation of the peak electron density in the ionosphere, i.e. the electron density reaches the saturation level and stops increasing with further increasing solar activity [Deminov, 2016]. The saturation effect is illustrated in Figure 2 with IG 12 calculated from f o F2 observations [Liu et al., 1983] and plotted against the solar activity index R 12 . This dependence can be expressed by the second-order polynomial (the solid curve in Figure 2):
IG 12 =–0.0031 R 12 2+1.5332 R 12 –11.5634. (1)
In view of the saturation effect, when the sunspot number R 12 exceeds 150 units, it is replaced by the limiting value R 12 =150 and the relevant upper limit of the ITU-R set of coefficients is used to calculate parameters of the F2-layer peak, i.e., the ITU-R extrapolation above the saturation limit is not provided. As is shown in Figure 1 and below,
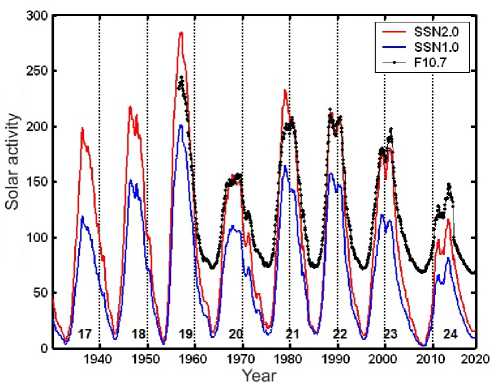
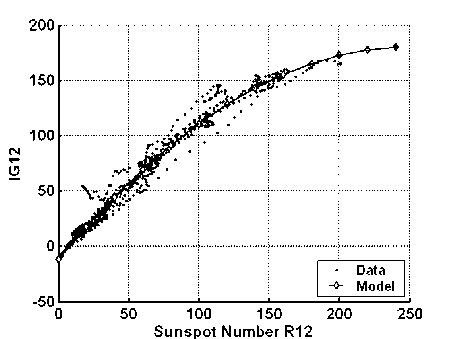
Figure 2 . Variation of the ionospheric index IG 12 calculated from the noon ionosonde network measurements of f o F2 in 1957–2015 as a function of R 12 . The solid curve is the model by formula (1)
such limits are applicable only for the maximum of solar cycle 19 (1957–1958) and partially for the maximum of solar cycle 21 (1980) with SSN 1 12 . At the same time, the direct implementation of SSN 2 12 in calculations with ITU-R maps leads to neglect of the actual values of SSN 2 12 above the upper saturation limit ( R 12 =150) in six solar cycles (17, 18, 19, 21, 22, 23) (Figure 1).
Regression relationships (2) of the primary and new sunspot number time series with the solar radio flux
F 10.7 12 are plotted in Figure 3.
Y = AX + B .
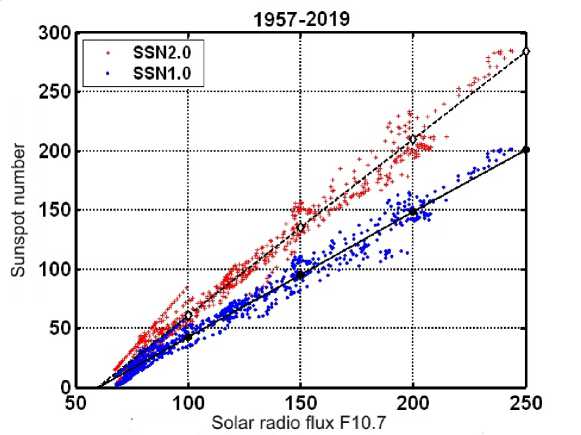
Figure 3 . Regression relationship of the old and new sunspot number time series, smoothed by the sliding 12-month window, with the 12-monthly smoothed 10.7 cm (2800 MHz) solar radio flux F 10.7 12
The parameters X and Y and the coefficients A and B of regression equation (2) are set out in Table 1. Further, regression equation (2) is denoted by the number given in the first column of Table 1, specifying coefficients in the respective lines numbered (2.1), (2.2), etc.
Table 1
Regression coefficients between solar indices smoothed by the sliding 12-months window
|
№ |
Y |
X |
A |
B |
|
2.1 |
SSN 1 12 |
F 10.7 12 |
1.0588 |
–63.2760 |
|
2.2 |
SSN 2 12 |
F 10.7 12 |
1.4929 |
–88.5781 |
|
2.3 |
GEC 12 |
GEC 12U |
57.5362 |
–46.0550 |
|
2.4 |
GEC 12 |
SSN 1 12 |
0.9703 |
1.4447 |
|
2.5 |
GEC 12 |
SSN 2 12 |
0.6511 |
1.1512 |
|
2.6 |
GEC 12 |
F 10.7 12 |
0.9516 |
–59.5356 |
In the absence of observations of SSN 1 12 and SSN 2 12 , relevant values could be calculated from their linear dependence on the parameter F 10.7 12 by formulae (2.1) and (2.2). These equations can also be used to resolve ambiguities when it is not clear to which time series – SSN 1 12 or SSN 2 12 – solar datasets belong. Values calculated by formulae (2.1) and (2.2) show to which index set the data pertain.
The most promising is the transformation of SSN 212 to the scale of SSN 112 in order to obtain model driving parameters for the ITU-R maps, which are based on SSN 112. Figure 4 illustrates the linear relationship between SSN 1 12 and SSN 2 12 . This relationship suggests that the sunspot number time series SSN 2 12 , smoothed by the 12-month window, is brought to the corresponding smoothed series R 12 ( SSN 1 12 ) with the scaling factor 0.7:
R 12 =0.7 SSN 2 12 . (3)
Note that this relationship is valid only for the above-mentioned series, smoothed by the sliding 12-month window. Thus, the current SSN 2 12 data unambiguously yield R 12 , used to guide calculations in the ionospheric models.
The ionospheric GEC parameter representing the integral sum of electrons in near-Earth space at heights from 65 to 20 200 km is measured in units of GECU=1032 electrons [Afraimovich, Perevalova, 2006] and varies from 0.1 to 5.0 GECU. Calculations with global TEC maps provide hourly GEC values for 0, 1, …, 23 UT from observations of GPS satellite signals from September 1998 to the present day. The hourly GEC data are used to derive daily, monthly, 12-month, and other smoothed series of this parameter, which vary within the same limits.
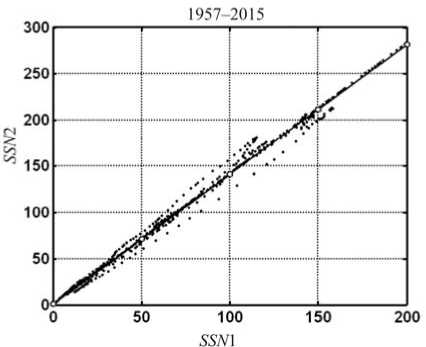
Figure 4 . Linear relationship between SSN 1 12 and SSN 2 12
After smoothing the resulting series of monthly GEC values (in GECU) by the sliding 12-month window (designated as the smoothed series by GEC 12U ) to be used as a proxy of solar activity in IRI-Plas, the GEC 12U series is brought to the scale of R 12 metrics by application of regression equation (2.3) with coefficients set out in line 2.3 of Table 1.
Equation (2.3) is applied to all GEC 12U values for the available source global GIM-ТЕС maps over the period from September 1998 to the present day. To use GEC index series as a proxy of solar activity in the IRI-Plas model, it should be supplemented with the model-reconstracted set of values for the preceding years [Gulyaeva, Veselovsky, 2014].
The GEC 12U set of values is permanently updated as new TEC maps become available, hence the model set of coefficients GEC 12 should be renewed every month. The same is done for the sets of solar activity indices and their prediction for the forthcoming months and years. To regularly update driving parameters of the IRI-Plas model, regression relationships (2.4), (2.5), (2.6) between GEC 12 and solar activity indices are used. Derivation of these relationships is illustrated in Figure 5, where the regression relationships of GEC 12 with sunspot number time series SSN 1 12 (2.4), SSN 2 12 (2.5), and solar radio flux F 10.7 12 (2.6) are plotted. The correlation coefficient between these 12-month smoothed series is 0.9938 (2.4), 0.9955 (2.5), and 0.9962 (2.6) respectively. These equations provide prediction for GEC 12 , based on the prediction for SSN 1 12 (2.4) or F 10.7 12 (2.6) for forthcoming months until December 2019.
Figure 6 illustrates a high accuracy in approximating R 12 for solar cycles 19–24 by GEC 12 parameter represented by results of scaling GEC with formula (2.3) from March 1999 to December 2015 and by prediction with formula (2.4) for the rest of years. The equivalent sunspot number R F 12 calculated from the equation of quadratic regression between F 12 and R 12 (see formula (2) [Deminov, 2016]), used by the IRI model [Bilitza, 2015], is also plotted in this figure. It was concluded in [Deminov, 2016] that R F 12 is more effective than R 12 for the long-term prediction of f o F2. However, the prediction of f o F2 was estimated from the IG 12 parameter, which differs considerably from R 12 [Bilitza et al., 2012]. Figure 6 indicates that RF 12 differs both from R 12 and GEC 12. This difference is greatest near the maxima of solar cycles 21–24. Since ITU-R maps are designed for fixed levels of R 12 , this particular index and its ionospheric proxy index GEC 12 are used as model driving parameters of solar activity in the IRI-Plas model.
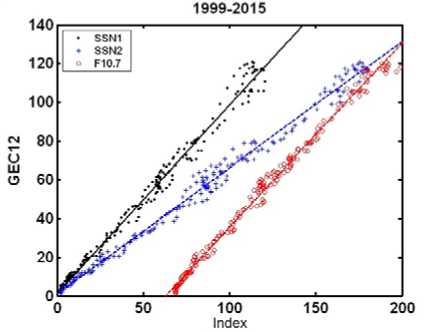
Figure 5 . Variation of GEC 12 with solar activity presented by SSN 112, SSN 212 , and F 10.712
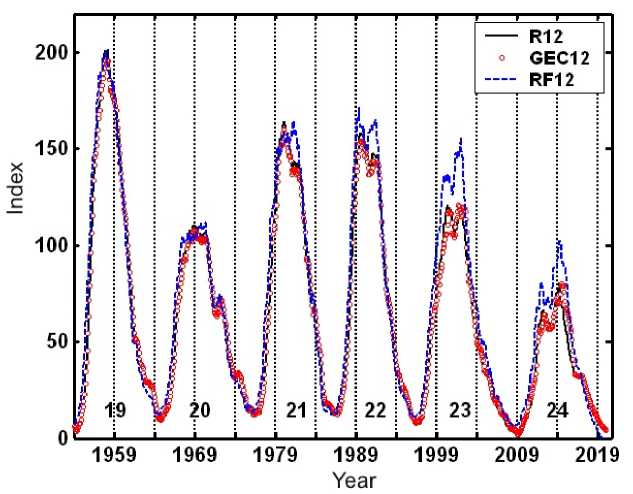
Figure 6 . The basic sunspot number index R 12 in cycles 19–24 and the equivalent solar activity proxy — the global electron content GEC 12 computed from GIM-TEC maps, scaled to the sunspot number by formula (2.3) from March 1999 to December 2015, and reconstructed by model (2.4) for the rest of years. Model RF12 index obtained by reversion of R12 to F10.712 index
COMPARING IONOSPHERIC DATA WITH MODEL PREDICTIONS
Variations in SSN 1 12 , SSN 2 12 , GEC 12 , and IG 12 during solar cycles 19–24 are plotted in Figure 7. The saturation level R 12 =150 for the peak electron density N m F2 (proportional to f o F22) is indicated by a horizontal line. In calculating f o F2 from ITU-R maps, all values of the above-mentioned indices exceeding 150 units are replaced by this upper limit. Figure 7 clearly shows the part of values that are excluded from calculations in the ionospheric models near solar activity maxima; the greatest losses occur if the SSN 2 12 is used.
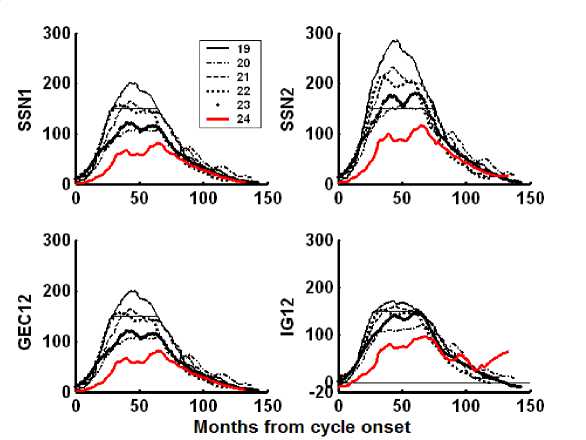
Figure 7 . Variations in SSN 1 12 , SSN 2 12 , GEC 12 , and IG 12 for six solar cycles (19–24)
In this figure, we can see the minimum amplitude of solar cycle 24 with smallest values of all the indices near the solar maximum. The long-term predictions of solar activity refer to the descending phase of solar cycle 24 for 2016–2019. During this period, the IG12 index shows appreciable differences with other indices – it increases in 2018–2019 according to data file of March 10, 2016 in the IRI system [].
The prediction for IG 12 in this period suggests that the minimum of solar cycle 24 is expected on October, 2017. It may happen that the prediction of SSN 1, SSN 2, and F 10.7 for the descending phase of solar activity with the minimum of solar cycle 24 in December 2019 will be corrected as new data become available [Ahluwalia, 2016]. However, differences in the forecast of the driving parameter IG 12 for the IRI model will result in increased differences of the long-term forecast for model parameters with this index, as is shown below with the said indices used to calculate ionospheric parameters with the IRI and IRI-Plas models for Moscow (55.5 ° N, 37.3 ° E).
Figure 8 presents observational data and calculation with the IRI-Plas model for Moscow from 1996 to 2015 in solar cycles 23 and 24. The data on f o F2 and h m F2 have been acquired from Parus-A ionosonde observations at IZMIRAN; the TEC data have been calculated from JPL GIM-ТЕС maps for the above coordinates in Moscow. Calculations by the IRI-Plas model were made with ITU-R maps based on the two solar activity indices SSN 1 12 and SSN 212. The comparison between results for solar cycles 23 and 24 shows that the ionospheric ionization was weaker in cycle 24 than in cycle 23, as is also demonstrated by ionosonde observations performed in Japan and by the global-average TEC obtained in [Hao et al., 2014].
The low level of solar extreme ultraviolet emission (EUV) observed during the prolonged solar activity minimum in 2007–2009 still exists in cycle 24, being responsible for the decreased ionospheric plasma ionization. As for calculations with the IRI-Plas model, the ionospheric parameters obtained using SSN 2 12 exceed observed data and values calculated with SSN 1 12 . The maximum excess of average monthly values calculated with SSN 2 12 over observed ones is 32 % for f oF2, 12 % for h mF2, and 38 % for ТЕС. These differences can vary depending on the time of day, season, geographic and geomagnetic coordinates of an observation point, and on solar activity level.
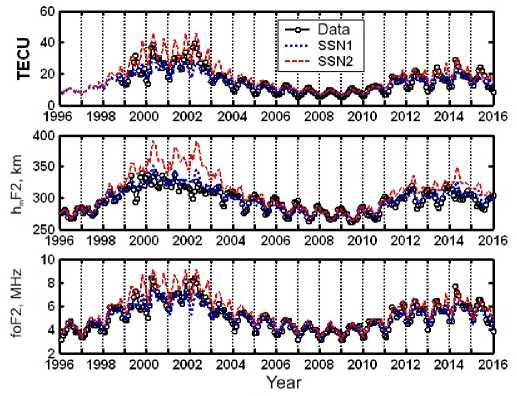
Figure 8 . Comparison between observed data and forecast made with the IRI-Plas model ( SSN 1, SSN 2) for Moscow from 1996 to 2015 in solar cycles 23 and 24. The parameters f o F2 and h m F2 as inferred from Parus-A ionosonde observations made at IZMIRAN and TEC data acquired using JPL GIM-ТЕС maps for Moscow
The current forecast of solar activity indices for 2016–2019 has been employed to predict the ionospheric parameters f o F2, h m F2, and TEC for Moscow. Although the period of time in this case is beyond the existing ionospheric database so that the model calculation cannot be compared with observations, let us take results of calculation with R 12= SSN 112 as the basic index, on which the ITU-R maps are based, to be the reference level. The results of the prediction produced by the IRI-Plas and IRI models are illustrated in Figure 9. Annual RMS deviations from calculations with the basic solar activity index are listed in Table 2. The results show the best agreement with the baseline forecast (the smallest RMS deviations) using GEC 12 to predict f o F2, h m F2, and ТЕС with the IRI-Plas model.
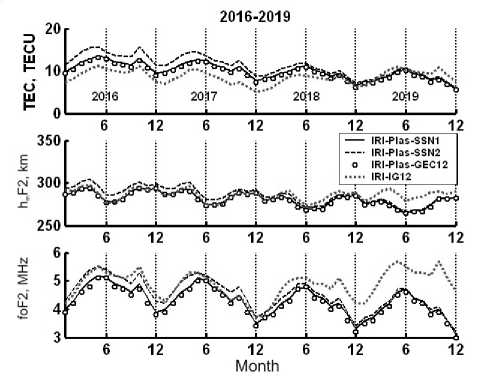
Figure 9 . Results of the forecast of f o F2, h m F2, and TEC for Moscow for 2016–2019 in solar cycle 24 with given solar and ionospheric indices driving the IRI and IRI-Plas models
Table 2
RMS deviation (in measuring units and %) of results of the forecast of ionospheric parameters for Moscow for 2016–2019 guided by the indices SSN 2 12 , GEC 12 , and IG 12
from the calculation with the basic index R 12 = SSN 1 12 (the average annual value is designated with the brackets)
|
Year |
< f o F2> |
RMS |
< h m F2> |
RMS |
|
RMS |
|||
|
MHz |
% |
km |
% |
TECU |
% |
||||
|
IRI-Plas, SSN 2 12 ~ SSN 1 12 |
|||||||||
|
2016 |
5.0 |
0.37 |
8.0 |
295.6 |
7.52 |
2.6 |
13.8 |
2.40 |
20.3 |
|
2017 |
4.7 |
0.29 |
6.4 |
290.4 |
6.07 |
2.1 |
12.3 |
1.76 |
16.3 |
|
2018 |
4.3 |
0.15 |
3.6 |
281.5 |
3.25 |
1.2 |
10.0 |
0.86 |
9.3 |
|
2019 |
4.1 |
0.07 |
1.8 |
276.1 |
1.56 |
0.6 |
8.7 |
0.40 |
4.9 |
|
IRI-Plas, GEC 12 ~ SSN 1 12 |
|||||||||
|
2016 |
4.5 |
0.12 |
2.5 |
287.5 |
1.34 |
0.5 |
11.4 |
0.56 |
4.7 |
|
2017 |
4.4 |
0.11 |
2.5 |
283.9 |
1.33 |
0.5 |
10.4 |
0.49 |
4.5 |
|
2018 |
4.1 |
0.12 |
2.8 |
277.5 |
1.54 |
0.6 |
8.9 |
0.46 |
5.0 |
|
2019 |
3.9 |
0.12 |
2.9 |
273.7 |
1.57 |
0.6 |
8.0 |
0.42 |
5.1 |
|
IRI, IG 12 ~ SSN 1 |
|||||||||
|
2016 |
5.0 |
0.44 |
9.5 |
289.9 |
3.79 |
1.3 |
9.6 |
2.34 |
19.8 |
|
2017 |
4.6 |
0.27 |
6.1 |
285.1 |
2.88 |
1.0 |
8.0 |
2.96 |
27.4 |
|
2018 |
4.7 |
0.64 |
15.2 |
283.9 |
6.96 |
2.5 |
7.8 |
1.77 |
19.1 |
|
2019 |
5.2 |
1.31 |
32.7 |
286.4 |
14.64 |
5.3 |
9.3 |
2.16 |
26.0 |
The implementation of the SSN 2 12 index in the IRI-Plas model yields overestimated values the most pronounced in 2016 and decreasing to the minimum of cycle 24. An opposite trend occurs with the IG 12 index used in the IRI model: predicted parameters overestimate the base calculation results by the end of the period under study.
The TEC results obtained with the IRI model for 2016–2018 underestimate the base calculation output due to integration of TEC in the IRI model only below 2000 km, whereas the base calculation with the IRI-Plas model includes heights up to 20 200 km. However, for 2019 the TEC values predicted by the IRI model exceed those calculated with the base model due to increasing index IG 12 . One can mitigate the IRI calculation difference with the base index output towards the end of solar cycle 24, using IG 12 coefficients computed with formula (1) from prediction of sunspots R 12 for 2016–2019.
CONCLUSIONS
In this paper, the solar activity indices used by the IRI-Plas and IRI models are examined. It is shown that the recent modification of the sunspot number time series SSN 2 [Clette et al., 2014] requires modification and selective implementation of solar and ionospheric model driving parameters. The scaling factor 0.7 is established to convert the new series SSN 2 12 index to basic sunspot number indices R 12 = SSN 1 12 , smoothed by the 12-month window. Regression relationships are introduced between GEC 12 , R 12 , and F 10.7 12 . The comparison of IRI-Plas calculations with observations at Moscow in solar cycles 23 and 24 demonstrates the advantage of SSN 1 12 over SSN 2 12 . The comparison between IRI-Plas and IRI predictions for Moscow for 2016–2019 in the descending phase of cycle 24 shows the least deviation from the forecast made with the original series R 12 , using GEC 12 with the IRI-Plas model.
The IRI and IRI-Plas users should be careful specifying parameters of solar activity in these models, namely, by examining the sunspot number time series put online for compliance with the set of basic indices R 12 = SSN 1 12 , which form the basis of ITU-R maps of parameters of the F2-layer maximum. In view of the difference between the forecast of IG 12 and other solar activity indices, it is advisable to use the index IG 12 from formula (1) with the IRI model based on the forecast of the sunspot number time series R 12 for the forthcoming years.
The author thanks SIDC, Belgium, for the SSN1 and SSN2 indices []; SWC, Canada, for data on F10.7 [ftp:// solar_flux/daily_flux_values/]; IZMIRAN, Moscow, for Parus ionosonde data []; JPL, U.S., for GIM-TEC maps [ftp://]; D. Bilitza, U.S., for coefficients and online IRI calculations []. The IRI-Plas model is provided by IZMIRAN [ izmiran/SPIM/]. Online IRI-Plas calculations are made on the IONOLAB website [http://www.ionolab. org/]. This work is partly supported by grant TUBITAK EEEAG 115E915. The contribution of two reviewers making valuable comments and suggestions is gratefully appreciated.
Список литературы Модификация индексов солнечной активности в международных справочных моделях ионосферы IRI и IRI-Plas в связи с пересмотром ряда чисел солнечных пятен
- Афраймович Э.Л., Перевалова Н.П. GPS-мониторинг верхней атмосферы Земли. Иркутск: ИСЗФ СО РАН, 2006. 480 с.
- Деминов М.Г. Индекс солнечной активности для долгосрочного прогноза ионосферы//Космические исследования. 2016. Т. 54, № 1. С. 3-9 DOI: 10.7868/S0023420616010064
- Ратовский К.Г., Ойнац А.В., Медведев А.В. Сходства и различия регулярных вариаций параметров F2-слоя полярной и среднеширотной ионосферы в восточно-сибирском секторе//Солнечно-земная физика. 2015. Т. 1, № 2. С. 70-79 DOI: 10.12737/7832
- Afraimovich E.L., Astafyeva E.I., Oinats A.V., et al. Global electron content: a new conception to track solar activity//Ann. Geophys. 2008. V. 26, N 2. P. 335-344.
- Ahluwalia H.S. The descent of the solar cycle 24 and future space weather//Adv. Space Res. 2016. V. 57, iss. 2. P. 710-714, DOI: 10.1016/j.asr.2015.11.015
- Bilitza D., Sheikh N.M., Eyfrig R. A global model for the height of the F2 peak using M3000 values from the CCIR//Telecomm. J. 1979. V. 46. P. 549-553.
- Bilitza D., McKinnell L.A., Reinisch B., Fuller-Rowell T. The international reference ionosphere today and in the future//J. Geodesy. 2011. V. 85. P. 909-920 DOI: 10.1007/s00190-010-0427-x
- Bilitza D., Brown S.A., Wang M.Y., et al. Measurements and IRI model predictions during the recent solar minimum//J. Atmos. Solar-Terr. Phys. 2012. V. 86. P. 99-106 DOI: 10.1016/j.jastp.2012.06.010
- Bilitza D. The International Reference Ionosphere -Status 2013//Adv. Space Res. 2015. V. 55, iss. 8. P. 1914-1927 DOI: 10.1016.j.asr.2014.07.032
- CCIR Atlas of Ionospheric Characteristics//Comite Consultatif International des Radio Communications Rep. 340. Geneve: International Telecommunication Union, 1983.
- Chasovitin Yu.K., Shirochkov A.V., Besprozvannaya A.S., et al. An empirical model for the global distribution of density, temperature and effective collision frequency of electrons in the ionosphere//Adv. Space Res. 1987. V. 7, iss. 6. P. 49-52.
- Clette F., Svalgaard L., Vaquero J.M., Cliver E.W. Revisiting the sunspot number: a 400-year perspective on the solar cycle//Space Sci. Rev. 2014. V. 186, iss. 1. P. 35-103.
- Gulyaeva T.L., Bilitza D. Towards ISO Standard Earth Ionosphere and Plasmasphere Model//New Developments in the Standard Model. Nova Science Publishers Inc., 2012. P. 1-39. Available at https://www.novapublishers.com/catalog/pro-duct_info.php?products_id=35812. (дата обращения 1 сентября 2016 г.).
- Gulyaeva T.L., Veselovsky I.S. Imaging Global Electron Content backwards in time more than 160 years ago//Adv. Space Res. 2014. V. 53, iss. 3. P. 403-411. 2013.11.036 DOI: 10.1016/j.asr
- Hao Y.Q., Shi H., Xiao Z., Zhang D.H. Weak ionization of the global ionosphere in solar cycle 24//Ann. Geophys. 2014. V. 32. P. 809-816 DOI: 10.5194/angeo-32-809-2014
- Jones W.B., Gallet R.M. Representation of diurnal and geographical variations of ionospheric data by numerical method//Telecomm. J. 1962. V. 29. P. 129; 1965. V. 32. P. 18.
- Liu R., Smith P., King J. A new solar index which leads to improved foF2 prediction using the CCIR atlas//Telecomm. J. 1983. V. 50. P. 408-414.
- Lukianova R., Mursula K. Changed relation between sunspot numbers, solar UV/EUV radiation and TSI during the declining phase of solar cycle 23//J. Atmos. Solar-Terr. Phys. 2011. V. 73, iss. 2-3, P. 235-240 DOI: 10.1016/j.jastp.2010.04.002
- Maruyama T. Solar proxies pertaining to empirical ionospheric total electron content models//J. Geophys. Res. 2010. V. 115. A04306 DOI: 10.1029/2009JA014890
- Nava B., Coisson P., Radicella S.M. A new version of the NeQuick ionosphere electron density model//J. Atmos. Solar-Terr. Phys. 2008. V. 70, iss. 15. P. 1856-1862. DOI: 10.1016/j. jastp.2008.01.015.
- URL: http://sidc.oma.be/silso/(дата обращения 1 сентября 2016 г.).
- URL: ftp://ftp.geolab.nrcan.gc.ca/data/solar_flux/daily_flux_ values/(дата обращения 1 сентября 2016 г.).
- URL: http://www.izmiran.ru/services/iweather/(дата обращения 1 сентября 2016 г.).
- URL: ftp://sideshow.jpl.nasa.gov/pub/iono_daily/(дата обращения 1 сентября 2016 г.).
- URL: http://irimodel.org/indices/(дата обращения 1 сентября 2016 г.).
- URL: http://ftp.izmiran.ru/pub/izmiran/SPIM/(дата обращения 1 сентября 2016 г.).
- URL: http://www.ionolab. org/(дата обращения 1 сентября 2016 г.).
