
Monitoring Student Learning Outcomes: Student Dropout Prediction Model Using Subgraph Matching Approach

Журнал: International Journal of Information Technology and Computer Science @ijitcs
Статья в выпуске: 5 Vol. 18, 2026 года.
Бесплатный доступ
Student dropout is still a crucial issue in many colleges and universities in countries including Indonesia despite various initiatives that have been implemented to reduce its rate. As a preventive effort, many educational institutions continuously monitor several factors that potentially affect student graduation and dropout rates. However, the increasing ratio of student numbers to administrative staff has made manual processes inefficient. This paper presents a novel method to monitor student learning outcomes using a subgraph matching approach to identify students who potentially drop out early or fail to graduate due to low learning achievement. This study emphasizes diagnostic accuracy in identifying students at risk of dropping out as the main focus of the proposed contribution. Performance assessment is directed at the model's ability to accurately distinguish between at-risk and not-at-risk students, particularly through evaluations that emphasize the minority class. This approach strengthens the model's role as the foundation of a more reliable early warning system relevant to supporting academic decision-making. In this research, the academic achievement of each student is represented as a graph that represents the relationship between each student and courses that have been enrolled in the previous semesters. By comparing the learning achievement pattern between each student and those students who have either "graduated" or "dropped out", the students with elevated dropout risk can be identified in a computationally efficient manner. The experiment findings showed that the proposed method can identify students with elevated dropout risk with 89.47% average accuracy. Graph-based approaches are capable of capturing structural relationships and complex interaction patterns among student activities that cannot be explicitly represented by other models. Although subgraph matching is known to have high computational complexity, the identification process can be accelerated through subgraph pattern constraints, preprocessing strategies, and search optimizations, thereby supporting claims of efficiency both theoretically and practically.
Короткий адрес: https://sciup.org/15020757
IDS: 15020757 | DOI: 10.5815/ijitcs.2026.05.06
Текст научной статьи Monitoring Student Learning Outcomes: Student Dropout Prediction Model Using Subgraph Matching Approach
The term "learning" in higher education refers to the information, abilities, and skills that students seeking postsecondary education usually acquire at colleges or universities. Engaging with academic information, taking part in lectures, discussions, and practical exercises, as well as participating in various learning activities like exams to gauge comprehension and mastery of the subject matter, are all part of this process. Learning in higher education can also be viewed as a planned and patterned activity to create an atmosphere and provide services so that students can learn effectively [1, 2]. In many colleges and universities in many countries including Indonesia, student dropout is still a crucial issue although many initiatives have been implemented by the Government to reduce its rate. The student dropout rate from higher education is one of several indicators of the higher education institution quality [3, 4]. In 2021, according to higher education statistics in Indonesia, 76.58 percent of students dropped out of private universities. This number is very worrying for the continuity of education in Indonesia.
High dropout rates have a significant negative impact on educational institutions and national policies. For educational institutions, high dropout rates reflect a failure to retain students until completion, which can lower reputation, accreditation, and public trust in the quality of educational services[1]. Operationally, this also implies a reduction in aid or subsidies, which often depend on the number of active students. At the national level, high dropout rates hinder the achievement of human resource development targets, widen socio-economic disparities, and reduce labor productivity. This situation necessitates that the government formulate more adaptive, data-driven education policies that focus on early prevention of dropout risks, so that the goals of equity and the improvement of education quality can be sustainably achieved. As a preventive effort, many educational institutions continuously monitor several factors that potentially affect student graduation and dropout rates. However, the increasing ratio of student numbers to administrative staff has made manual processes inefficient. To prevent this phenomenon and support institutions and students, it is critical to identify the factors that influence learning outcomes and impact student dropout [2]. The learning system is a learning approach commonly used so that the provision of learning material can be understood against the learning process to be achieved [3, 4].
Factors that affect learning outcomes that have an impact on student graduation include the fact that a lack of effectiveness in learning [5, 6] causes difficulty in understanding learning, which will also have an impact on learning assessment results [7, 8]. The advent of machine learning technology has proven to be instrumental in effectively analyzing and processing large amounts of educational data [9]. Although much research on predicting learning outcome tasks using machine learning approaches has been published and resulted in many methods available in the literature, little has been done on predicting student graduation using graph analytic methods that include computational complexity for attribute-based metrics [10]. Unlike conventional machine learning models for predicting, subgraph matching models can analyze entities and relationships between entities from data sets. Most previous research on predicting dropout has focused on tabular feature-based or time-series modeling that reduces student academic behavior into numerical aggregates, thereby overlooking the structural interconnections and the sequence of learning activities. By emphasizing these limitations from the outset, the introduction can demonstrate that a graph-based approach is proposed as a solution to capture relational and structural patterns that are not explicitly modeled by conventional methods, while also reinforcing the relevance and urgency of the developed method. Therefore, the purpose of this study is to implement subgraph matching to predict student graduation.
The limitations of conventional statistical and machine learning methods in capturing complex relationships among academic entities have become a major obstacle in fully understanding student dropout phenomena. Traditional approaches tend to focus on individual variables, such as academic grades or attendance, without considering the interaction patterns among students, lecturers, and the academic environment that form broader social and structural networks. As a result, potential nonlinear correlations and hidden relationships among entities are often overlooked. Moreover, to date, there has been little research applying subgraph matching approaches in the context of student dropout prediction. In contrast, this technique has strong potential to identify specific connectivity patterns within academic networks that are related to dropout risks, thereby providing more accurate and contextual insights compared to conventional prediction models.
The reference model is developed to provide a comprehensive understanding of the contextual factors influencing the initial criteria, by identifying the key factors, success criteria, and measurable indicators relevant to the study. This conceptual framework is visually represented in Figure 1, which illustrates the interrelationships among these components.
The main contribution lies in the integration of subgraph matching techniques with the modelling of academic activity as a graph, as well as in its use to identify relational and traceable dropout risk patterns, which have not been widely explored in dropout prediction research. This method enables the identification of structural and relational patterns within academic data that are strongly associated with dropout behavior. Importantly, this approach represents an area that has not been extensively investigated in prior studies, thereby contributing new insights and expanding the methodological landscape of educational data analysis. The strength of this research lies in the method's ability to capture complex relationship patterns among learning variables, such as academic interactions, performance in courses, and student engagement in learning activities, which are often not accurately modelled by conventional prediction methods. In addition, this research not only contributes to methodological aspects, but also provides practical implications for higher education institutions in conducting continuous monitoring of student learning achievements. With a more precise predictive model, universities can implement early interventions to prevent dropout occurrences. This model has the potential to serve as an effective early warning system for monitoring student learning performance and preventing dropout through timely and targeted interventions. Furthermore, this approach makes a significant contribution to the field of learning analytics and academic decision support systems by introducing a method that can identify students with elevated dropout risk more rapidly and accurately. It achieves this by analyzing the relational patterns between students and the courses they have completed in previous semesters, offering a data-driven foundation for proactive academic support and retention strategies. Unlike conventional prediction methods, which are usually based on statistics or pure machine learning, this model introduces a graph-based data representation that allows for a deeper analysis of academic relationship patterns among entities. Additionally, this study also expands the understanding of how graph representation techniques can be used to enhance the efficiency and objectivity in monitoring student learning outcomes in higher education environments.
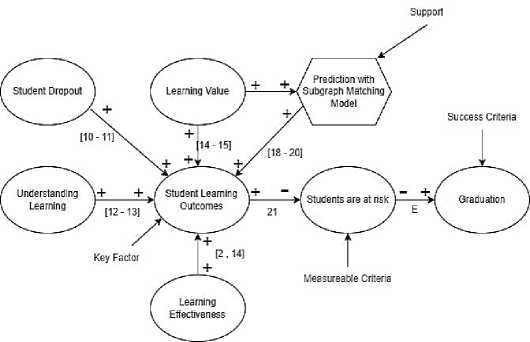
Fig. 1. Subgraph matching model reference for predicting graduation
2. Literature Review 2.1. Attributed Graph
An attributed graph G can be formally described as a four-tuple G = (У, E, g, (), where V denotes the set of vertices, and E represents the set of edges, satisfying E ^ V x V, g:V ^ Lv. The vertex labeling function (:E ^ LE assigns a specific vertex label lE to each vertex vt , while the edge labeling function (: E ^ LE maps an edge label lE to each edge e t . The sets Lv and LE correspond to the vertex and edge attribute spaces, respectively. These attributes may take various forms, such as a discrete set of integers L = {1, 2,3}, a vector space L = RM where M denotes the dimensionality of the feature vector, or a finite symbolic set L = {x,y,z} [11].
A simple graph is a graph where there are no two vertices connected to more than one edge and no edge loop (edges connecting to the same vertex). A graph in which two vertices are connected by more than one edge is called a multigraph. Based on the presence of direction at the edge, a graph consists of a direct graph and an indirect graph. Based on whether or not there are labels on vertices and edges, graphs are distinguished from labeled graphs and unlabeled graphs [12], [13]. A simple graph is isomorphic with another graph if all vertices and edges on the graph correspond one-to-one with the vertices and edges of another graph [11].
-
2.2. Graph Edit Distance
Graph Edit Distance (GED) is a measure of similarity between graphs that calculates the minimum cost to transform one graph into another through a series of editing operations, such as addition, deletion, and substitution of nodes or edges[14]. This concept is rooted in graph theory and optimization, enabling it to quantitatively represent structural and attribute differences. GED is widely used in pattern analysis because it is flexible in handling graphs that are not identical but have semantic similarities[15]. A smaller GED value indicates a higher degree of similarity between the compared graphs. However, GED calculation is NP-hard, requiring approximation or heuristic approaches to be applicable to large-scale data. Various models for weighting edit costs have also been developed to adapt GED to the characteristics of the problem being studied.
An attributed graph G can be defined as a four-tuple G = (V, E, g, (), where V represents the set of vertices, and E denotes the set of edges, satisfying the condition E ^ V x V, g:V ^ Lv. The vertex label function (:E ^ LE assigns a vertex label lv to each vertex vt , while the edge labelling function (:E ^ LE assigns an edge label LE to each edge LE .
The Graph Edit Distance (GED) is a graph matching technique used to determine the optimal sequence of edit operations required to transform one graph g1 into another graph g2. These edit operations typically involve the insertion, deletion, and/or substitution of vertices and their associated edges within g 1. As stated in[16], let g 1 = (V1,E1,g1, (1) and 9г = (^2,E2,g2, (2); the Graph Edit Distance between g1 and g2 is mathematically defined as:
GED(g1,g2)= min Z ^=1 c(e t )
e i ,e 2..... e^y^iM
Where c denotes the cost function measuring the strength c(e t ) of an edit operation e t and y(g 1, g2) denotes the set of edit paths transforming g 1 into g2. A standard set of edit operatiis given by substitution, deletion, and insertion of both vertices and edges.ges. The substitution of two vertices u and v by (u ^ v), the deletion of node u by (u ^ e) and the insertion of node v by (e ^ v). For edges, we use the same notations as vertices (see Figure 2).
Here, c represents the cost function that quantifies the cost c(et) associated with each edit operation et , while Y(9 i > g2) denotes the set of edit paths that transform graph g 1 into graph g2. The standard set of edit operations includes substitution, deletion, and insertion of both vertices and edges. Specifically, the substitution of two vertices u and v is represented as (u ^ v), the deletion of a vertex as (u ^ e), and the insertion of a vertex v as (e ^ v). The same notation is applied analogously to edge operations (as illustrated in Figure 2).
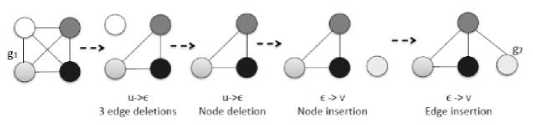
Fig. 2. Illustration of the transformation process from graph g 1 to graph g2 through a sequence of edit operations, including vertex and edge insertions, deletions, and substitutions
The process of transforming graph g 1 into graph g2 involves a sequence of graph edit operations, where vertices and edges are systematically inserted, deleted, or substituted to achieve structural and attribute correspondence between the two graphs. The process begins with three edge deletions, which reduce the number of connections between nodes in graph g 1 . The next step involves deleting a node, followed by the insertion of a new node to replace the lost structure. After that, edges are added to restore connectivity between nodes according to the target graph structure g2. This sequence of transformations demonstrates the fundamental principle of the Graph Edit Distance (GED), which quantifies the similarity between two graphs by evaluating the number and nature of edit operations necessary to convert one graph into the other.
2.3. Subgraph Matching
3. Methodology
Subgraph matching is an analytical approach used to identify specific patterns or structures in a large graph by matching them against a predefined reference subgraph[17]. This method is based on graph theory and is widely used in complex data analysis because it can explicitly and structurally represent relationships between entities. In practice, subgraph matching allows researchers to find similarities in topology, node attributes, or relationships between nodes that have specific semantic meanings. The main advantage of subgraph matching lies in its ability to capture relational patterns that are often not detected by conventional statistical methods[18]. However, the high computational complexity poses a significant challenge, especially when applied to large-scale graphs with many structural variations[19].
Following [20], the objective of the graph matching task is to identify all subgraphs within G that are isomorphic to Q, meaning they share an identical structural configuration and corresponding attribute relationships. For example, in Figure 3, G4 is the graph pattern to be searched, while G1 and G3 are graphs that are used as search targets for graph pattern matching so that two graphs are found from graph pattern matching, namely one on graph G1 and one on graph G3. Here is the illustration in Figure 3.
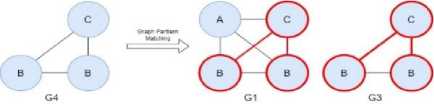
Fig. 3. Graph Pattern Matching G4 to G1, and G3
The graph pattern matching process between graph G4 and two other graphs, namely G1 and G3. On the left side, graph G4 consists of three nodes labelled B, B, and C, which are interconnected to form a simple structure. The graph pattern matching process aims to find the same structural pattern of G4 within the larger graphs, G1 and G3. The results are shown on the right side, where parts of G1 and G3 that have similar relationship patterns to G4 are marked with thick red lines. This indicates that the subgraphs within G1 and G3 have a structural pattern compatible with G4, signifying the success of the graph pattern matching process.
The research design employed in this study adopts the Design Research Methodology (DRM) framework, as proposed by Blessing and Chakrabarti, which provides a systematic approach for conducting and evaluating design-oriented research[21]. This methodology comprises four main stages: Research Clarification, Descriptive Study I, Prescriptive Study, and Descriptive Study II. The DRM framework applied in this research is depicted in Figure 4, which illustrates the sequential process and interrelation among these stages.
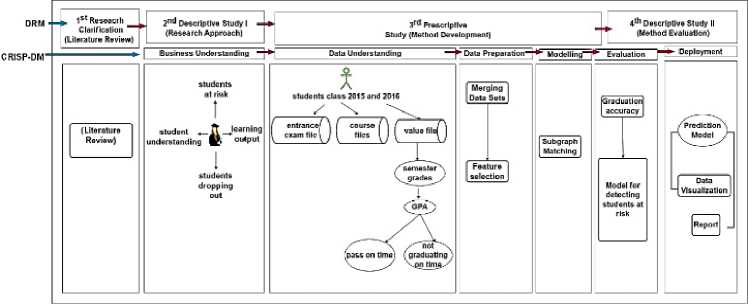
Fig. 4. Design research methodology
The first stage, Research Clarification (RC), focuses on performing a comprehensive literature review to identify and analyze scholarly works from reputable journal databases. This process aims to gather relevant insights regarding the significance of predicting learning outcomes in higher education and the application of artificial intelligence in educational contexts. The second stage, Descriptive Study I, seeks to identify and analyze key features that influence the prediction of student learning outcomes within higher education environments. The third stage, Descriptive Study (Method Development), involves the implementation of business understanding, data understanding, data preparation, and modeling using machine learning graph models. This phase follows the CRISP-DM (Cross-Industry Standard Process for Data Mining) framework to ensure a structured and systematic model development process[22],[11]. Finally, Descriptive Study II aims to evaluate and use modeling results in a system.
Based on the graph matching formulation, the subgraph matching problem in this study can be defined as follows: given a data graph G and a query graph q, the objective of the subgraph matching task is to identify all subgraphs within G that exhibit a high degree of similarity to q. The similarity between q and G is quantified using the Graph Edit Distance (GED) metric. According to [23], the Graph Edit Distance is defined for a pair of graphs (G 1 , G2), where G 1 represents the query graph. GED is the minimum cost or number of elementary edit operations required to transform G 1 into G2 . These primitive edit operations include the insertion, deletion, and/or substitution of vertices and their corresponding edges within the query graph G 1 . The overall subgraph matching process employed in this study is illustrated in Figure 5, which visually represents the sequence of operations used to align the query graph with its corresponding subgraphs in the data graph.
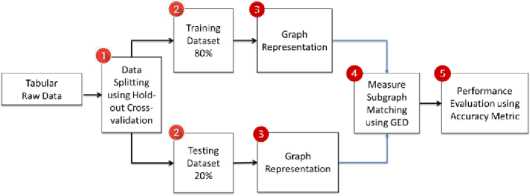
Fig. 5. Subgraph pattern matching using graph edit distance
The input data in this study is a set of binary-label tabular data. The label of data is either graduate or dropout. The input data is then split into training and testing (query) datasets with a proportion of 80% and 20%. The testing dataset is considered as query data. Both training and testing data are represented as attributed bipartite graphs. The similarity between each pair of testing and training graph data is measured using graph edit distance. For each query graph q, the closest distance graph G is selected. Finally, the label of Q is used as the predicted label of q. Finally, the performance of subgraph matching is measured using an accuracy metric.
The graph is explicitly modelled as a bipartite graph consisting of two types of nodes, namely students and courses, with edges representing student involvement in specific academic activities, such as course enrolment or learning assessment achievements. The choice of a bipartite graph is based on the characteristics of academic data, which naturally form relationships between two main entities, allowing this structure to represent relationships clearly and measurably without mixing different types of nodes. With this topology, graph matching algorithms and Graph Edit Distance measurements can be consistently applied to compare patterns of academic engagement among students, while maintaining the interpretability of the analysis results in the context of predicting the risk of study dropout.
The use of graph structures in this study is intended to reveal latent academic patterns that cannot be explicitly represented by vector feature-based statistical regression approaches. By modeling the relationships and sequences of course enrolment as a relational structure, the graph approach can identify specific patterns, such as particular combinations or sequences of courses that are consistently associated with the risk of failure and dropping out. Such structural patterns tend to be overlooked by traditional tabular models, making the graph-based approach provide relevant analytical added value, even though it requires greater computational resources.
A graph-based approach allows for modelling academic data as a relational structure that explicitly represents the connections and sequences among courses taken by students throughout their study period. Through this representation, graphs can capture hidden patterns, such as the order in which certain courses are taken, repeated failures in prerequisite courses, or combinations of study paths that are consistently associated with an increased risk of failure and dropout. These patterns are difficult to identify using traditional feature vectors, which generally reduce information to aggregated values, such as GPA averages or the number of completed courses, thus losing structural and temporal context. Therefore, graphs not only serve as a predictive tool but also as a means of analysis to uncover academic dynamics that are latent and pedagogically meaningful.
The main advantage of graph topology lies in its ability to capture relational patterns that are difficult to represent in the form of tables or linear time series, such as prerequisite violations for courses, taking courses outside the recommended curriculum path, and the formation of elective course groups that are structurally correlated with the risk of dropping out. These patterns emerge as recurring graph substructures and are not always explicitly reflected in aggregate features (such as GPA or total credit hours).
4. Result and Discussion 4.1. Result
In this study, subgraph matching is applied to predict student dropout risk in the Indonesian higher education context by conducting analysis of the patterns of academic scores recorded in the student database. The input data used in this research consist of 282 students drawn from an Indonesian academic environment, reflecting the characteristics of local curricula and evaluation systems. To ensure methodological clarity and guarantee reproducibility, this section explicitly explains how academic performance data is modelled in the form of a graph. The graph representation is designed to capture structural relationships between students, courses, and academic performance across early semesters, which cannot be adequately represented using aggregated tabular features. Therefore, we define the graph schema deterministically, including node types, relation types and directions, academic attributes, and encoding of temporal aspects. The graph construction schema used in this study is illustrated in Figure X, which serves as the basis for the subgraph extraction process and dropout risk pattern matching.
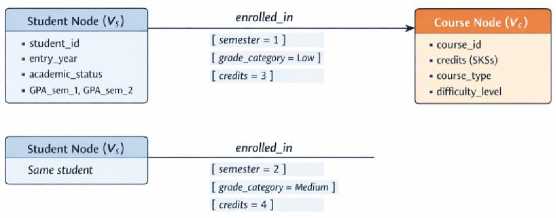
Fig. 6. Undirected bipartite graph of student dataset
Figure 6 shows the graph construction scheme used to represent students' academic records as an attributed bipartite graph. Student nodes and course nodes are connected by a directed enrolment relation representing course enrolment in a specific semester. Academic performance information is not modelled as separate nodes but is encoded as attributes on the edges, including discretized grade categories, semester of enrolment, and number of credits. The temporal attributes attached to the edges allow the formation of cross-semester subgraphs without building a separate graph for each time period. With this construction, students' academic patterns are represented both structurally and temporally, supporting the extraction and matching of subgraphs for early identification of dropout risk.
The student data are modelled using an undirected attributed bipartite graph G = (V, E, µ, ζ) where V = X ∪ Y, X is the student set, and Y is the course set. The student vertex is represented by several attributes including StudentID, Name, and EducationStatus namely “dropout”, and “graduated”; whilst, the course vertex is represented by several attributes including CourseID, CourseName, and CreditUnit. The relationship between X and Y is represented by an edge having attribute FinalGrade. The bipartite graphs can be illustrated using Figure 7 below.
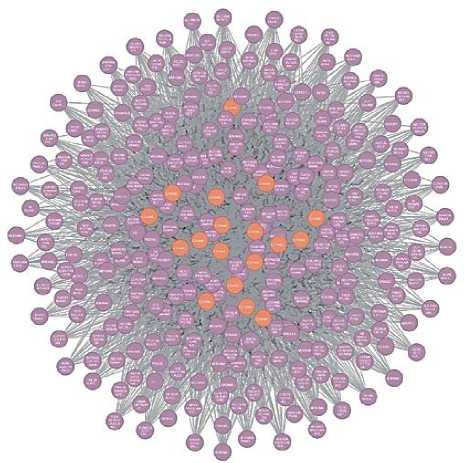
Fig. 7. Undirected bipartite graph of student dataset
Data of each student's learning outcome are represented as an undirected attributed bipartite graph G = (У,
E, /л,
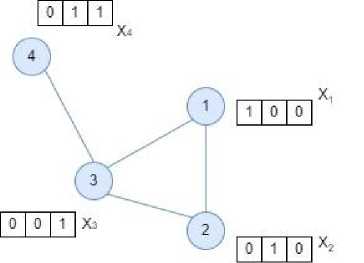
Fig. 8. Illustration of the adjacency matrix
As an illustration, a graph is represented in Figure 7. The graph above shows some of the relationships between each node such as:
-
• Vertex 1 is connected to vertex 2 and vertex3.
-
• Vertex 2 is connected to vertex 1 and vertex3.
-
• Vertex 3 is connected to vertex 1, vertex 2, and vertex 4.
-
• Vertex 4 has a relationship only with vertex3.
From the graph edges, an adjacency matrix A of the graph can be formulated as follows. Each column and row of the matrix represents a vertex of the graph.
A =
|
1 |
2 |
3 |
4 |
|
|
1 |
0 |
1 |
1 |
0 |
|
2 |
1 |
0 |
1 |
0 |
|
3 |
1 |
1 |
0 |
1 |
|
4 |
0 |
0 |
1 |
0 |
Before calculating the GED between each pair of graphs (G_1, G_2), first, each graph is represented using an adjacency graph. An adjacency matrix represents the relationship between a student node and some courses he/she has taken. To calculate GED between a pair of graphs, additional cells to the adjacency matrix with lower dimensions are needed to make both adjacency matrices have similar dimensions. The algorithm to compute GED between each pair of graphs (G_1, G_2) is as follows:
Algorithm: GED
Input: pair of graph (G 1 , G2),
Output: GED Score threshold=0.50
ged_value = 0
if G2.has_edge(u, v)
weight_diff = abs(data['bobot'] - G2[u][v]['bobot’]) ged_value += min(weight_diff, threshold)
else ged_value += data['bobot’]
if not G1.has_edge(u, v)
ged_value += data['bobot’]
return ged_value
The input dataset can be visualized using an attributed bipartite graph (see Figure 8). The total data are 282 students, which are split into 225 students as data reference and 57 students query data. In this study, the number of courses is limited to 20 courses. Of the 282 students, there are 247 students graduated and 35 students are dropout.
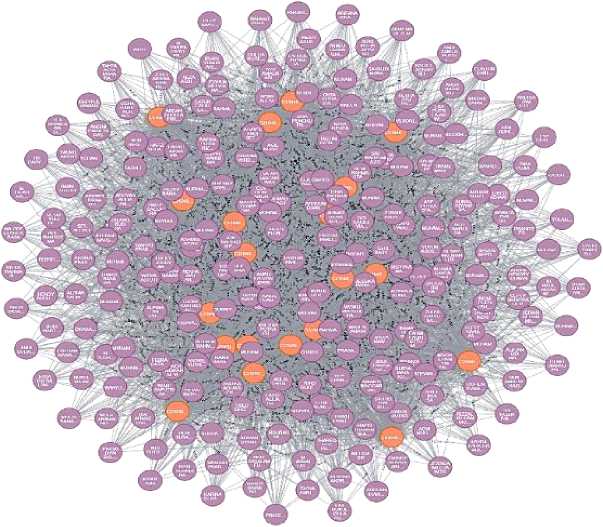
Fig. 9. Illustration of graduating student graph
The GED between some pairs of graphs (G1, G2) is represented in Table 1. For each query graph q, it is predicted from the label of the closest graph in the reference.
Table 1. GED score results
|
Graph Test |
Graph Train |
GED |
|
201531226 |
201531059 |
16.75 |
|
201531227 |
201531069 |
22.75 |
|
201531226 |
201531059 |
16.75 |
|
201531232 |
201531142 |
2.25 |
|
201531233 |
201531111 |
25.5 |
|
201531234 |
201531224 |
21.75 |
|
201531235 |
201531035 |
6 |
|
…...... |
…..... |
…...... |
|
201531273 |
201531015 |
0 |
|
201531282 |
201531282 |
19 |
The table shows the results of measuring the Graph Edit Distance (GED) between the test graphs and the training graphs, representing the structural similarity among student activity patterns. Smaller GED values, such as 0 or 2.25, indicate a very high level of graph structure similarity, while larger values, such as 22.75 or 25.5, reflect increasingly significant structural differences between the test and training graphs. The variation in GED values confirms that each student has different relational patterns, and the graph matching process enables the identification of similarities in academic behavior patterns quantitatively, which can further be utilized to support dropout risk analysis based on the similarity of learning activity structures.
This article emphasizes the position of graph-based methods relative to commonly used Educational Data Mining approaches, such as logistic regression and feature-based XGBoost. The main emphasis of the graph approach is not on merely outperforming simple tabular models in terms of predictive accuracy or computational efficiency, but rather on the different modeling paradigm it offers. Tabular approaches tend to model relationships between variables implicitly through feature correlations, whereas graph-based methods are designed to explicitly represent the connections between academic entities in the form of relational structures, thus capable of capturing the interconnected complexity of educational data.
Furthermore, the primary goal of implementing a graph-based approach is aimed at the ability to identify structural dropout risk patterns that can be interpreted and traced. By modeling academic data as a network, this approach enables the analysis of relationships between learning activities, courses, and student engagement dynamics that cannot be directly represented by logistic regression or raw feature-based XGBoost. The results obtained are not only predictions of study dropout risk but also a deeper understanding of the relational patterns underlying those risks, thereby providing additional analytical and conceptual value in the context of monitoring students' study continuity.
-
4.2. Evaluation
The performance of the proposed subgraph matching method is assessed by evaluating the degree of correspondence between the predicted label of the query graph and its actual (ground-truth) label. This evaluation aims to determine how accurately the method can identify and classify subgraphs that are structurally and semantically similar to the query graph. Some examples of predicted and actual query graph labels are presented in Table 2.
Table 2. Some prediction results
|
Query Graph |
Reference Graph |
GED |
Actual Status_ |
Predicted Status |
|
201531226 |
201531059 |
16.75 |
GRADUATED |
GRADUATED |
|
201531227 |
201531069 |
22.75 |
GRADUATED |
GRADUATED |
|
201531228 |
201531216 |
18.75 |
GRADUATED |
GRADUATED |
|
201531229 |
201531029 |
18.75 |
GRADUATED |
GRADUATED |
|
201531230 |
201531064 |
26 |
GRADUATED |
GRADUATED |
|
201531232 |
201531142 |
2.25 |
DROP-OUT |
DROP-OUT |
|
201531234 |
201531224 |
21.75 |
GRADUATED |
DROP-OUT |
|
201531244 |
201531148 |
27 |
GRADUATED |
DROP-OUT |
|
201531282 |
201531225 |
19 |
GRADUATED |
GRADUATED |
The results in Table 2 present the performance of the dropout prediction model based on the GED approach, comparing the query graph with the reference graph to determine students' academic status. Of the nine-test data displayed, seven predictions match the actual status, while the other two do not, specifically for students with IDs 201531234 and 201531244, who actually graduated but were predicted to drop out. GED values range from 2.25 to 27, where lower GED values (such as 2.25) tend to correlate with more accurate predictions, particularly in cases of dropout. This indicates that the smaller the structural difference between the query graph and the reference graph, the higher the likelihood that the model's prediction aligns with the students' actual condition. Overall, these results indicate that the subgraph matching method based on GED is capable of providing fairly consistent prediction results. However, further refinement is still needed to reduce classification errors in some instances with high GED values.
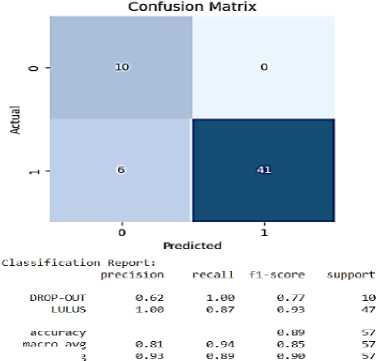
The evaluation outcomes are further summarized and visualized using a confusion matrix, as presented in Table 3, which provides a detailed comparison between the predicted and actual classifications of the subgraph matching results.
Table 3. Confusion matrix
|
Predicted Label |
|||
|
Drop Out |
Graduated |
||
|
Actual Label |
Drop Out |
10 |
0 |
|
Graduated |
6 |
41 |
|
Table 3 presents a confusion matrix that illustrates the model's performance in predicting student status based on two labels, namely Dropout and Graduated. From the results, the model successfully classified all students who actually dropped out correctly in 10 cases, without any misclassification in this class, indicating a True Positive Rate (TPR) of 100%. However, in the graduated category, six students were misclassified as dropouts, while 41 others were correctly predicted. Therefore, the model demonstrates a relatively high overall accuracy; however, it still faces challenges in distinguishing between students who have characteristics similar to those of the dropout group. This indicates that the smaller the structural difference between the query graph and the reference graph, the higher the likelihood that the model's prediction matches the actual condition of the student.
Figure 10 presents the accuracy results obtained from the evaluation of the proposed model, illustrating its effectiveness in correctly identifying and matching subgraphs relative to the actual target labels.
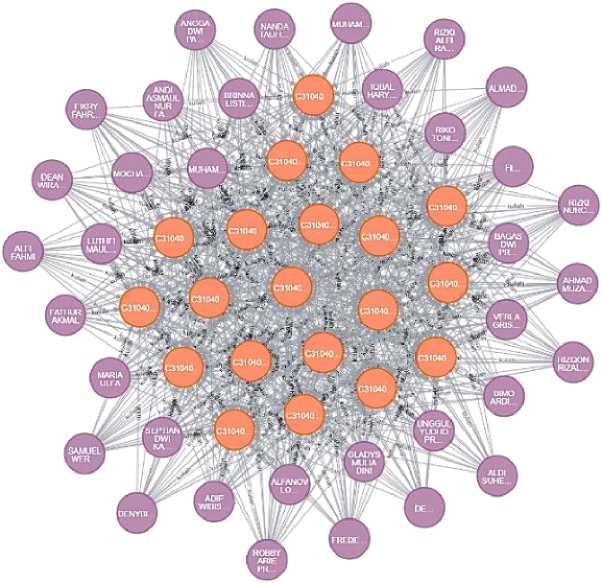
Fig. 10. Illustration of dropout student graph
macro avg weighted avg
Fig. 11. Experiment confusion matrix
The confusion matrix and classification report provide a detailed depiction of the model’s predictive performance in classifying student status into two distinct categories: Dropout and Graduated. These evaluation metrics highlight the model’s capability in distinguishing between the two outcomes by measuring key indicators such as accuracy, precision, recall, and F1-score. According to the results, the model achieves an overall accuracy of 89%, indicating fairly good predictive performance. For the Dropout class, the precision value of 0.62 indicates that 62% of all students predicted as dropouts are correctly classified, while the recall reaches 1.00, meaning all dropout students are correctly detected without any being missed. Conversely, for the Graduated class, the model shows perfect precision (1.00) and a recall of 0.87, indicating some misclassifications where graduated students are incorrectly predicted as dropouts. The high F1-score values for both classes (0.77 for dropout and 0.93 for graduation) indicate a good balance between precision and recall. With a macro-average F1-score of 0.85 and a weighted-average F1-score of 0.90, the results indicate that the model demonstrates stable and effective predictive performance across both categories. Nevertheless, further refinement is required to minimize misclassification errors, particularly within the Graduated category, to enhance the overall accuracy and reliability of the model.
The evaluation of model performance is not only based on overall accuracy, but is extended with reporting of Precision, Recall, and F1-Score metrics specifically focused on the minority class, namely students who experience or are at risk of dropping out. This evaluation approach is applied to avoid assessment bias due to the dominance of the majority class and to provide a more representative view of the model's ability to identify dropout cases in practice. By emphasizing metrics relevant to the minority class, the analysis of model performance becomes more aligned with the main goal of the research, which is to build an effective prediction system as an early warning tool in monitoring students' continuity in their studies.
4.3. Discussion
5. Conclusion
This discussion section emphasizes that a subgraph matching approach based on Graph Edit Distance (GED) is capable of representing students' learning achievement patterns both structurally and semantically. Modelling student data in the form of an undirected bipartite graph connecting students and courses allows academic relationships, particularly final grades, to be analyzed more contextually compared to conventional tabular approaches. By representing each student as an adjacency matrix, the similarity of academic patterns can be quantitatively calculated through GED. The results show that students with similar graph structures, both in terms of the courses taken and the distribution of their grades, tend to have the same final academic status. This strengthens the argument that academic patterns are not merely a collection of individual grades but form relational structures that can be used to predict dropout risk more accurately.
The results of the GED calculation on the test data show a fairly wide range of values, ranging from 0 to more than 27. Low GED values indicate a high similarity in graph structure between the query student and the reference student, and this condition is generally associated with correct predictions, particularly in dropout cases. For example, a student with a GED of 2.25 was successfully predicted according to their actual status as a dropout. Conversely, high GED values tend to appear in cases with greater differences in academic patterns, and in some conditions actually lead to misclassification. These findings indicate that GED is effective as a measure of structural distance, but its sensitivity to value variation and the number of courses taken still affects prediction results, especially for students who graduate but have grade patterns close to the dropout group.
Evaluation using a confusion matrix provides a more comprehensive picture of the model's performance. The model successfully classified all students who actually dropped out without error, as reflected in a recall value of 1.00 for the Dropout class. From an academic monitoring perspective, this result is very important because the system does not miss students who are at high risk of dropping out. However, there are six students who actually graduated but were predicted as dropouts, indicating the presence of false positives in the Dropout class. This error suggests that some graduating students have graph structures that academically resemble dropout students, for example, low grades in certain courses or an unstable course-taking pattern. Thus, although the model is highly sensitive in detecting dropouts, specificity for the Graduated category still needs to be improved.
Overall, an accuracy of 89% and high F1-score values in both classes indicate that the GED-based subgraph matching approach has strong potential as a tool for monitoring learning outcomes and predicting dropout risks. The main advantage of this method lies in its ability to capture structural similarities among students, not just the resemblance in average grades. Nevertheless, the discussion results also highlight the need for further development, such as adjusting the GED threshold, assigning more adaptive weights to certain courses, or integrating non-academic attributes to enrich the graph representation. With these improvements, the model is expected not only to maintain high dropout detection capabilities but also to reduce mispredictions for students who are actually capable of completing their studies, making it a more reliable decision support system in higher education settings.
The graph topology proposed in this study is essentially closely related to the context of the academic data used, so its level of specificity needs to be understood carefully. The graph structure is formed based on curriculum patterns, course relationships, and student academic activities within a particular educational environment, which means that differences in curricula between study programs or institutions have the potential to produce different graph topologies. To overcome these limitations and enhance generalization capabilities, strategies such as graph structure normalization can be applied to reduce dependence on specific curriculum details, for example by abstracting courses into categories or certain levels of difficulty. Additionally, cross-curriculum relational pattern learning allows the model to capture general characteristics of academic relationships, making graph-based approaches remain relevant and adaptive when applied in different educational contexts.
The research results indicate that the prediction model based on subgraph matching and GED approaches has a good ability to identify students' academic status, achieving an accuracy rate of 89%. The model’s optimal performance in the Dropout category, evidenced by a recall value of 1.00, underscores the effectiveness of the graph-based approach in capturing and analysing the relational patterns among academic entities that are strongly associated with students’ risk of dropping out. This finding highlights the model’s ability to accurately identify at-risk students based on the structural and contextual information embedded within the graph representation. Nevertheless, the relatively low precision value (0.62) in the same class indicates that there are still classification errors, particularly in distinguishing students with elevated dropout risk from those who successfully complete their studies. This highlights the need to enrich features and refine the subgraph matching mechanisms to reduce the false positive rate without compromising the detection of actual cases.
Overall, these findings reinforce the argument that graph-based representations are capable of capturing complex dynamics in academic environments that cannot be adequately explained by conventional statistical or machine learning methods. This approach not only improves prediction accuracy but also offers deeper insights into the structural interactions that shape and influence student study persistence, enabling a more comprehensive understanding of the underlying factors contributing to academic retention and dropout behaviors. With further development, such as the integration of graph representation learning (graph embedding) and dynamic weighting between nodes, this model has the potential to be widely applied in academic early warning systems to support more adaptive and data-driven educational policies.
All the Declarations and StatementsAuthor Contributions Statement
Meilia Nur Indah Susanti: Conceptualization, Methodology, Data Curation, and Writing – Original Draft: Conceived the research idea, designed the student dropout prediction framework based on the subgraph matching approach, curated and prepared the educational dataset, and drafted the original manuscript.
Yaya Heryadi: Methodology, Validation; contributed to the methodological design and analytical interpretation of the results.
Yusep Rosmansyah: Visualization, Formal Analysis, and Review & Editing; reviewed and revised the manuscript for technical accuracy and clarity.
All authors have read and agreed to the published version of the manuscript.
Conflict of Interest Statement
The authors declare no conflicts of interest.
Funding Declaration
This research was financially supported by the Institute Technology Perusahaan Listrik Negara, Indonesia. The funding supported the research activities and the preparation of this manuscript.
Data Availability Statement
The datasets and simulation files generated during the current study are available from the corresponding author on reasonable request.
Ethical Declarations
This research did not involve human subjects or animals. Therefore, no statements of ethical approval are required.
Acknowledgments
We are grateful to the editorial board and the reviewers for their constructive evaluation of our work. Their valuable recommendations played a crucial role in refining our methodology and improving the reliability of the presented results.
Declaration of Generative AI in Scholarly Writing
During the preparation of this work, the authors used Generative AI (Large Language Models) for the sole purpose of improving the English language, grammar, and stylistic consistency of the manuscript. After using this tool, the authors reviewed and edited the content as needed and take full responsibility for the accuracy and integrity of the final version of the article. No original scientific content, data, or technical results were generated by artificial intelligence.
Abbreviations
The following abbreviations are used in this manuscript:
AI - Artificial Intelligence
CRISP-DM - Cross-Industry Standard Process for Data Mining
DRM - Design Research Methodology
GED - Graph Edit Distance
GPA - Grade Point Average
Appendix
None.