Multiple factor analysis applied to calculation of blood pressure based on pulsometry data

Author: Yavelov I.S., Danielyan G.L., Rochagov A.V., Zholobov A.V.
Journal: Cardiometry @cardiometry
Section: Report
Article in issue: 22, 2022.
Free access
Development of algorithms capable of determining arterial pressure (AP) according to the contour of a pulse wave (PW) remains a topical issue to be solved with long-time efforts by researchers who work for many years in the field of hemodynamics. There is no doubt that the PW contour contains the data on AP, however due to a great number of factors influencing AP to reveal the relationship between them is extremely complicated. Our paper offers an attempt to develop an algorithm to calculate AP with the use of a PW sensor with the desired medical accuracy which does not require preliminary calibration utilizing a reference sphygmomanometer.
Multiple factor analysis, pulsometry, fiber optic pulse wave sensors, arterial pressure, age-related spline database of radial artery pulse waves
Short address: https://sciup.org/148324410
IDR: 148324410 | DOI: 10.18137/cardiometry.2022.22.100105
Text of the scientific article Multiple factor analysis applied to calculation of blood pressure based on pulsometry data
Imprint
Igor S. Yavelov, Georgy L. Danielyan, Andrey V. Rochagov, Anatoly V. Zholobov. Multiple factor analysis applied to calculation of blood pressure based on pulsometry data. Cardiom-etry; Issue 22; May 2022; p. 100-105; DOI: 10.18137/cardiome-try.2022.22.100105; Available from: issues/no22-may-2022/multiple-factor-analysis-applied
Attempts to identify a relationship between AP and the PW contour have resulted in development of algorithms described earlier [1, 2]. However at pres- 100 | Cardiometry | Issue 22. May 2022
ent, considering the relevance of the AP research topicality as well as taking into account developments of arterial pressure measuring techniques translated into mHealth devices, the authors hereof make their own attempt to produce a more perfect algorithm using a multiple factor analysis to account for basic significant arguments forming AP. In this connection, it should be noted that the international practice trying to implement AP measuring functions in some mobile devices (smart watches and trackers) involves a lot of deceptions or a most unworthy fraud, when measuring AP, since these devices have a built-in photoplesmo-graph to record heart rate (HR), which fundamentally is not capable of recording PW with a high resolution. The only suitable sensor having the desired capability is a sensor developed by IMASH RAS for the purposes of mHealth [1].
In order to support our suggestion in relation to the topicality of AP monitoring, let us consider data collected from other relevant sources for a long period of time. First we give some our data collected in testing in different test subjects as displayed in Figure 1 herein.
The test subjects (volunteers) have been selected randomly, according to maximum scattering in their blood pressure data; thereupon they have been grouped according to their hypertension status as follows: group 1 to cover hypotensive subjects; group 2 to include normotensive subjects, and group 3 to cover the hypertensive subjects. In practice, our randomized study has covered some test individuals from Moscow, Russia (2 groups) and some testees from Hilden, Germany (1 group). In 2010-2012 we have cooperated with German researchers in designing and developing a new mobile device Smart Watch with built-in Blood Pressure Monitor. Within the framework of the cooperation project, we have examined 23 volunteers in accordance with the procedure specified by German Standard DIN EN 1060-4. Upon the obtained results of the conducted examinations, we have offered a new definition “hypertension sleeve” to roughly reflect a tendency showing a linear relationship between the upper and lower arterial pressure as 3/2. The actual proportion differs significantly in the area of higher AP values.
It is of interest to note that both the data obtained by the authors hereof and the evidence data
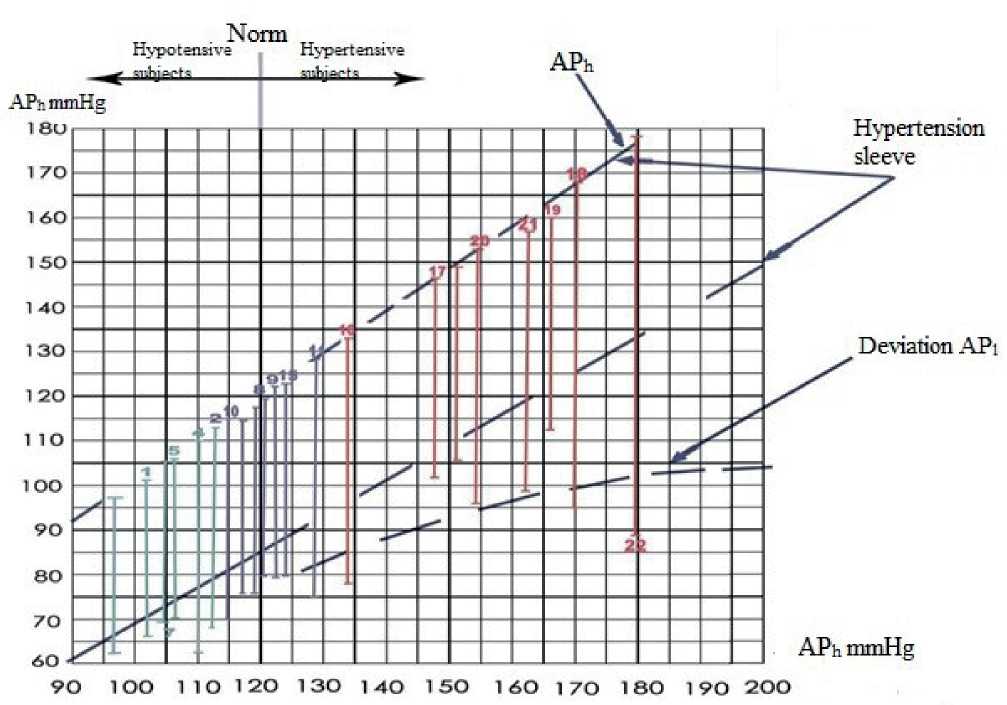
Figure 1. Test subjects groups according to their hypertension status. Nos.1-7 Hypotensive subjects (group 1); Nos.8-15 Normotensive subjects (group 2); Nos.16-23 Hypertensive subjects (group 3)
delivered from some other sources lend support to the fact that at present HT is more often found at a younger age in population in general. So, we have analyzed the relevant statistics data on HT incidence beginning in 1957 [3] and ending with 2019 [4] and visualized them as a plot considering both genders separately (see Figure 2 herein). According to the data, meanwhile the normal blood pressure values for individuals aged 70 have been shifted from 130/80 mmHg to 160/90 mmHG. In this case, at the same time, reported is an increase in CVD risks and CVD mortality rates [5]. Therefore the topicality of developing mobile devices for AP monitoring is beyond question.
The basis of our new algorithm is formed by algorithm GLOBAL, developed for cooperation with German MEDISANA circa 2010:
j n / у
АД вг -1201 y— I I - p — I S h I — I x ( 1,43 K p ) , (1) (54,5 ) ( l -100 J Ю p
АД нГ = 0,66АД вГ , (2)
where: Кр is rigidity index P 4 / P 5 (ratio of PW benchmarks to characterize the response by arterioles);
r = 0,1;
age factor

that has been taken from the reference data source dated back to 1957 [3]; j=0,15;
obesity index
n
I l - 100 )
; n = 0,6;
s - 1 (м)
gender-specific impact sh
s - 0,96 (ж) h - 1
i
( 14 I impact of PW velocity , i = 0,8; ζ is a time lz J span (ms) between the first and second pressure peaks on the PW back slope portion.
The GLOBAL algorithm has taken into account the maximum number of the factors in question, and it has been designed to calculate AP values without preliminary calibration with reference sphygmomanometer instrumentation. Based on the results of testing of the algorithm, we have produced a summary table given further herein (see Table 1).
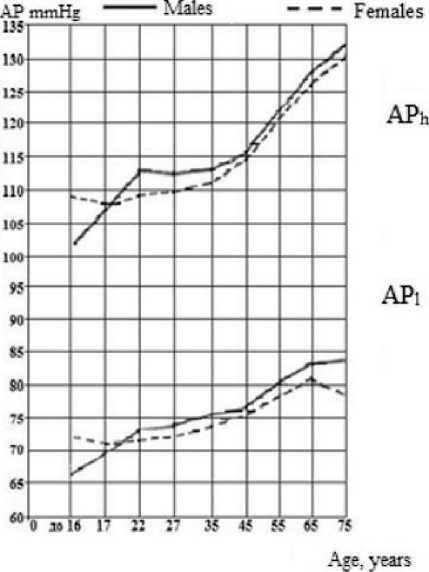
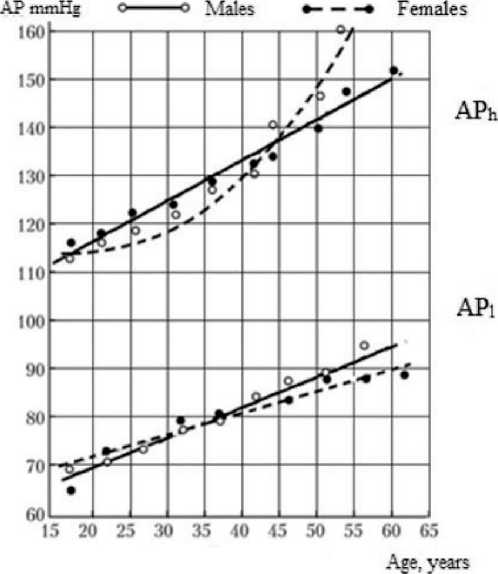
Figure 2. Comparison data on population examination illustrating a long-term period since 1957 (a) till present time (b)
Table 1
Comparison data on calculation of arterial pressure values (with the GLOBAL algorithm) versus the data delivered with Korotkoff sound sphygmomanometer
|
Groups |
Nos. |
Korotkoff sound sphygmomanometer |
Software GLOBAL |
Difference in AP |
Difference in AP |
|
No.1 Hypotensive test subjects |
1 |
104/70 |
95/63 |
-9 |
-7 |
|
2 |
114/68 |
||||
|
3 |
97/64 |
94/62 |
-3 |
-2 |
|
|
4 |
110/75 |
114/76 |
4 |
1 |
|
|
5 |
106/75 |
110/74 |
4 |
-1 |
|
|
6 |
110/64 |
||||
|
7 |
105/74 |
||||
|
No.2 Normotensive test subjects |
8 |
120/80 |
109/73 |
-11 |
-7 |
|
9 |
122/80 |
96/64 |
-26 |
-16 |
|
|
10 |
114/71 |
||||
|
11 |
128/75 |
125/83 |
-3 |
8 |
|
|
12 |
116/77 |
||||
|
13 |
119/76 |
122/82 |
3 |
6 |
|
|
14 |
119/71 |
||||
|
15 |
123/80 |
||||
|
No.3 Hypertensive test subjects |
16 |
134/78 |
121/81 |
-13 |
3 |
|
17 |
146/103 |
||||
|
18 |
169/95 |
||||
|
19 |
165/114 |
133/90 |
-32 |
-24 |
|
|
20 |
153/91 |
164/110 |
11 |
19 |
|
|
21 |
161/99 |
140/94 |
-21 |
-4 |
|
|
22 |
178/84 |
||||
|
23 |
150/100 |
140/94 |
-10 |
-6 |
|
|
Mean deviation |
-8,15 |
-2,31 |
|||
|
Tolerance |
±5 |
±5 |
|||
In accordance with Table 1, the comparable data have been collected in 13 patients. The calculation offers in case of systolic arterial pressure a deviation of -8,15 mm Hg and in case of diastolic pressure a deviation of -2,31 mm Hg. In both cases, the obtained results can be considered as acceptable, since adhering to a tolerance of ±5 mmHg the revealed deviation is small (3,15 mmHg only). This outcome can be recognized as promising, so that upon collecting more statistics data, the GLOBAL software may be successfully applied to noninvasive blood pressure measuring instruments equipped with pulse wave channel without a cuff as a measuring unit.
However the GLOBAL algorithm is not capable to provide 100% of the eligible accurate results, since it has a significant drawback, namely, the impact made by PWV has been taken into account as a delay time only, while the relevant formulas should be used to consider the actual anatomy of a test individual and the method of the calculation of the PWV according to the single point measurements utilizing multiple reflection of PW [1]. All above mentioned points considered, the GLOBAL algorithm has been essentially improved and refined by us. Besides, we have employed therein our own pulse wave spline database in order to account for age-related factors on the basis of our long-term evidence data that makes possible to identify the actual age of the cardiovascular system to better than one year. The improved algorithm has been denoted the GLOBAL NEW. Based on the above mentioned improvements, hereby we have revised the formula for and , namely, as follows:
jni
АД вг . 120 f YO плайHl. 1 f —p— ) S h f СРПВ ) X
( 40 Д l-100 ) ( СРПВге1ах )
x ( 0,6 K p ) r ,
АДнГ = 0,66АДвГ,(4)
but however taking into account the plot (see Figure 1 herein): j = 0,15; n = 0,6; h = 1; i = 0,8; r = 0,3.
We have performed our calculations according to formula (3) using Mathcad. To provide measuring tests, three volunteers have been involved, whose parameters are indicated in Table 2 herein. The reference measurements have been taken using the Krotkoff sound sphygmomanometer, and the basis for accura-
Table 2
Parameters of tested volunteers and measurements taken on them
Our results of the calculation of accuracy errors confirm that the updated algorithm GLOBAL NEW is within the tolerance specified by the above German Norm.
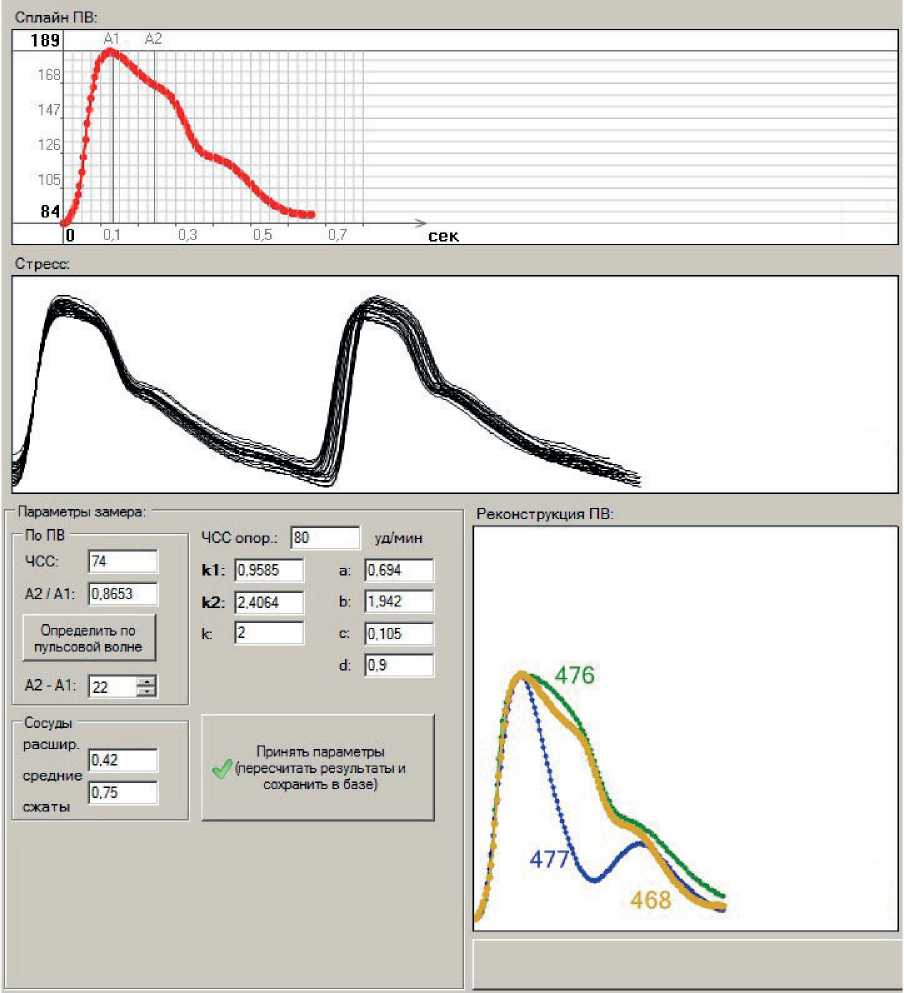
Finally, we would like to illustrate how our software PULSE works that makes possible to record and process the pulse wave data by the example of measurements taken on volunteer No.1.
Figure 3 exhibits a virtual prototype of a new instrument capable of AP metering, reading and monitoring, with a possibility to be calibrated with the reference manometer.

The results from processing of the recorded data are given in Figure 4 herein. They demonstrate
a)
b)
c)
Figure 4. Screenshot of the software demonstrating the completed measurements including an averaged PW (a), stress construction (b) and three PWs randomly selected, reconstructed in one dimension (c)
the capabilities of the software operating in device PULSE.
Conclusions
-
1. Through the application of the multiple factor analysis, multi-purpose algorithm GLOBAL NEW has been developed, which is capable of processing pulse waves recorded on the radial artery close to the wrist area.
-
2. The above mentioned algorithm offers the possibility to measure arterial pressure without preliminary calibration with a reference measuring instrument, since the algorithm takes into account antropometric parameters of the examined patient and the actual status of his/her cardiovascular system.
-
3. The proposed algorithm is capable to provide long-term monitoring of AP, including an option to perform it with significant time intervals between the separate measurements.
-
4. Further research work aimed at algorithm testing implies an increase in the number of test subjects and an assessment of reliability and significance of statistics data to be obtained.
Statement on ethical issues
Research involving people and/or animals is in full compliance with current national and international ethical standards.
Conflict of interest
None declared.
Author contributions
The authors read the ICMJE criteria for authorship and approved the final manuscript.
References Multiple factor analysis applied to calculation of blood pressure based on pulsometry data
- Yavelov IS. The secret of the pulse wave. Moscow-Izhevsk: Institute of Computer Research, 2012. 256 p. [in Russian].
- Yavelov IS, et al. Algorithm of the arterial tonometer. East European Scientific Journal. 9 (49), 2019, part 2. [in Russian].
- Lang GF. Diseases of the circulatory system. Moscow: MEDGIZ, 1957. 484 p. [in Russian].
- Lyubimova ZV. Age anatomy and physiology in 2 volumes. V. 2 musculoskeletal and visceral systems: a textbook for secondary vocational education / ZV Lyubimova, AA Nikitina. Moscow: Urayt Publishing House, 2019. 373 p. [in Russian].
- Lyusov VA, et al. The feasibility of modifying the classifications of arterial hypertension by blood pressure levels based on evidence-based data. Russian Journal of Cardiology. 2007; 6(68): 6-21. [in Russian].
