New points on ECG: a new valuable source of information

Author: Rudenko Mikhail Y.
Journal: Cardiometry @cardiometry
Section: Editorial
Article in issue: 5, 2014.
Free access
ID: 148308791 Short address: https://sciup.org/148308791
Text of the article New points on ECG: a new valuable source of information
Imprint Mikhail Y. Rudenko. New points on ECG: a new valuable source of information;
Cardiometry; No.5; November 2014; p.7-11; doi:10.12710/cardiometry.2014.5.711 Available from:
This is an overview aimed at a detailed interpretation of the concept of identification of boundaries in each cardiac cycle, and first it is directed to justification of an introduction of new points on an ECG curve, namely, point L as the end of the blood rapid ejection phase and point Z as the moment of reaching energy balance of myocardial muscle contraction determining the ECG isoline.
The issues associated with the L point have been already described in our journal [1]. Fig.1 exhibits an ECG where all points corresponding to each cardiac cycle phase in accordance with our cardiac cycle phase analysis concept are marked.
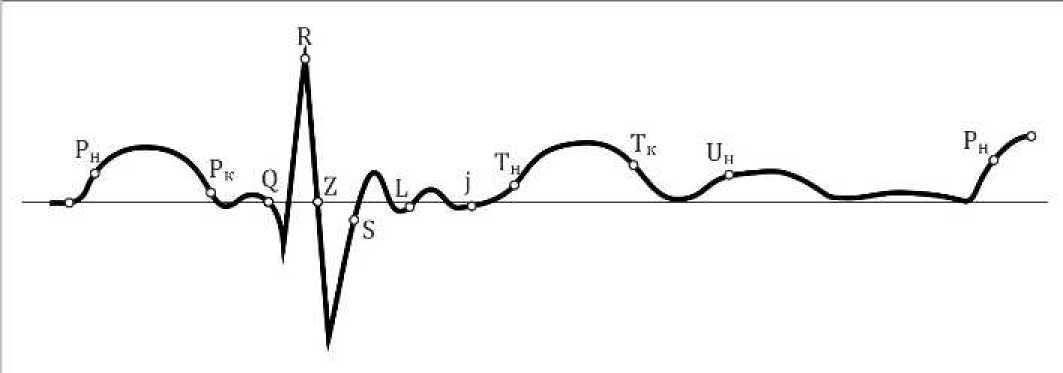
Figure 1. Letter designations for identification of boundaries in each cardiac cycle phase on ECG including new points L and Z introduced by the developers of the cardiometry theory
A detailed description of the process of the ECG shape formation has been already presented by us [2]. Here we just intend to demonstrate how the ECG segment sequence is generated (Fig.2). In our opinion, the QRS complex is shaped for the purpose of the initial generation of the proper blood flow structure. In this case, all heart valves are closed. The SL segment is a phase of pre-loading and can be considered to be a QRS complex, too, but showing lower amplitude since we deal in this interval with the total static tension of the myocardial and septal muscles. At the point L, the pressure level in the ventricle and that in the aorta become equal, and the aortic valve opens. A rheorgam shows this phenomenon as the initial point of a blood pressure rise.
The form of the Lj phase segment follows the shape of the QRS complex, but the j point reflects the start of the slow ejection phase [3-17]. In this case, we can say that the blood pressure applied to the heart muscle fibers starts to drop, and therefore the Lj phase amplitude is low [2].
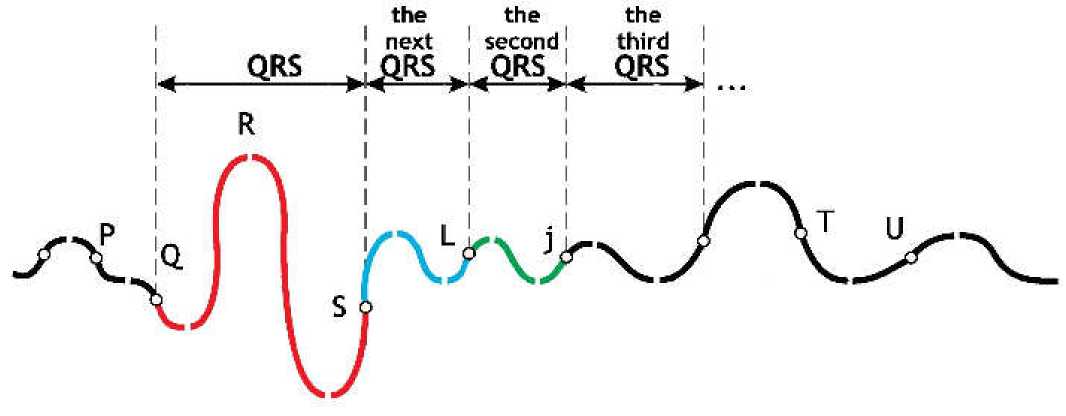
Figure 2. ECG segment sequence generated by blood pressures applied to SA and AV nodes which operate as baroreceptors
Of particular interest is an ECG curve of an athlete recorded during heavy lifting and holding for 12 sec. overhead (s. Fig.3 below) [18]. Under the said conditions, a QRS complex is found even after the j point. Our research has shown that the Lj phase and its further repeated manifestations in case of intensive physical load are determined by phosphocreatine processes. To be more exact, it is attributable to those energy resources which are responsible for ATP recovery, and the energy resources are limited. Fig. 3 below shows a decrease in the oscillations after the j point from cycle to cycle. In the classical physics, it is explained according to the well-known concept of oscillatory circuit energy.
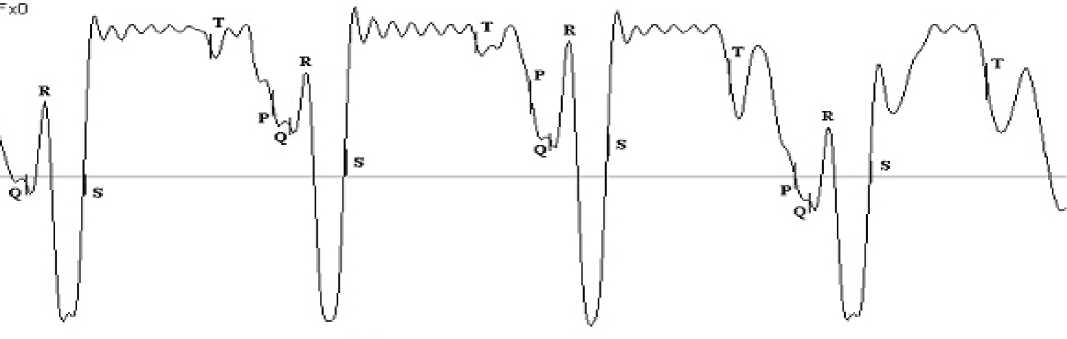
Figure 3. ECG of an athlete during lifting heavy weight and holding for 12 sec. overhead
Based on the above considerations, the authors hereof have introduced new definitions, namely, the next, the second and the third QRS complexes. These QRS’s can be found only in case of significant physical loading during sharp accelerations by athletes. Therefore, a complete ECG curve should contain points and segments as given below (Fig. 4):
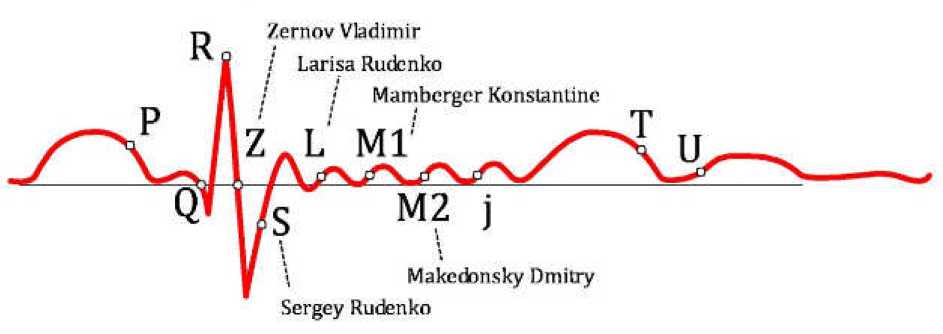
Figure 4. A complete form of an ECG reflecting all possible reactions of healthy cardiovascular system in a human under physical loading, with marked letter designations introduced by the authors hereof
The introduction of letter designations for new ECG points according to our original interpretation concept is both of scientific and historical importance. The developers of the original ECG interpretation concept have decided to use initial letters of their last and first names for that purpose. As a result, we obtain the following list of those who made a significant contribution thereto:
Point Z is named after Zernov Vladimir.
Point L is named after Larissa Rudenko.
Point S is referred to by the name of Sergey Rudenko who has first identified the location of this point.
Point М1 is named after Mamberger Konstantin.
Point М2 is named after Makedonsky Dmitry.
Of course, it was not our idea of making ECG points personalized, but the above researchers have made a considerable contribution to the scientific investigations and may be honored by introduction of letters of their names to the new points on ECG as these points is a new information source produced by ECG digital processing.
The foundation of the cardiometry theory is a pioneering mathematical model of hemodynamics. The model describes the conceptual principles of the heart performance which are consistent with the evidence delivered by practice. In actual practice, the mathematical equations [18-20] are used to calculate phase-related volumes of blood on the basis of the respective measured the cardiac cycle phase duration linear values. These equations were named hemodynamic equations by G. Poyedintsev - O. Voronova after their originators.
Cardiometry has already offered a lot of novelties in science, and the authors hereof are sure that every future discoverer has a chance to give his or her name to future detectable laws and phenomena, why not?
References New points on ECG: a new valuable source of information
- Rudenko SM. ECG periodic table: a new ECG classification based on heart cycle phase analysis. Cardiometry. May 2013;2:30-39 DOI: 10.12710/cardiometry.2013.2.3039
- Rudenko M.Y., Zernov V.A., Mamberger K.K., Rudenko S.M. Heart and aortic baroreceptors: operation in providing hemodynamic processes in cardiovascular system // Cardiometry. November 2013;3:31-44 DOI: 10.12710/cardiometry.2013.3.3144
- Zeng CS, Mou YH, Xin Y, Zhao ZQ, Xiang LX.A new method for measuring electrocardiogram and its implement. Journal of Clinical Rehabilitative Tissue Engineering Research. 23 April 2010;14(17):3120-2.
- Juhani JM, Sager SJ, Tikkanen JT, Anttonen O, Huikuri HV, Myerburg RJ. Clinical significance of variants of J-points and J-waves: Early repolarization patterns and risk. Eur Heart J. November 2012;33(21):2639-43a.
- Bastiaenen R, Behr ER. Early repolarisation: Controversies and clinical implications. Heart. June 2012;98(11):841-7.
- Toledano K, Rozin AP. Early repolarization: Innocent or dangerous? American Journal of the Medical Sciences. 2013;346(3):226-32.
- Macfarlane PW, Clark EN, Heng JS. J wave patterns -Morphology, prevalence and nomenclature. J Electrocardiol. November 2013;46(6):505-9.
- Macfarlane PW, Clark EN. ECG measurements in end QRS notching and slurring. J Electrocardiol. September 2013;46(5):385-9.
- Yong C, Froelicher V, Wagner G. Is the J wave or the ST slope malignant⋯or neither? JACC. 6 May 2014;63(17):1811-2.
- Yong C, Froelicher V, Wagner G. To the editor -Blind men and the j wave -Confusing aspects of the 2013 hrs statement on inherited arrhythmic diseases. Heart Rhythm. November 2013;10(11):81-e82.
- Yong C, Perez M, Froelicher V. Prognostic implications of the J wave ECG patterns. J Electrocardiol. September 2013;46(5):408-10.
- Muramoto D, Singh N, Aggarwal S, Wong M, Adhikarla C, Hadley D, Froelicher V. Spectrum of ST amplitude: Athletes and an ambulatory clinical population. J Electrocardiol. September 2013;46(5):427-33
- Sallam K, Froelicher V. Concomitant ECG findings and J wave patterns. J Electrocardiol. September 2013;46(5):399-403.
- Yong CM, Froelicher V, Wagner G. The electrocardiogram at a crossroads. Circulation. 2 July 2013;128(1):79-82.
- Ajijola OA, Sun AY. The genetics of the J wave patterns. J Electrocardiol. September 2013;46(5):395-8.
- Rezus C, Floria M, Moga VD, Sirbu O, Dima N, Ionescu SD, Ambarus V. Early repolarization syndrome: Electrocardiographic signs and clinical implications. Ann Noninvasive Electrocardiol. January 2014;19(1):15-22.
- Antzelevitch C. J wave syndromes: Molecular and cellular mechanisms. J Electrocardiol. November 2013;46(6):510-8.
- Rudenko MY, Voronova OK, Zernov VA. Theoretical Principles of Heart Cycle Phase Analysis. Frankfurt a/M, Munich, London, New York: Fouqué Literaturverlag; 2009. 336 p. ISBN 9783937909578.
- Rudenko MY, Voronova OK, Zernov VA, Mamberger KK, Makedonsky DF, Rudenko SM. Theoretical principles of cardiometry. Cardiometry. November 2012;1:7-23 DOI: 10.12710/cardiometry.2012.1.723
- Rudenko M.Y., Voronova O.K., Zernov V.A., Mamberger K.K., Makedonsky D.F., Rudenko S.M., Kolmakov S. The cardiovascular system ¬ physiology, diagnostics and clinical implications. Rijeka (Croatia): InTech; c2012. Chapter 1, Control of cardiovascular system; p. 1-22. ISBN: 9789535105343 DOI: 10.5772/36259
