Non-Functional Requirements Classification Using Machine Learning Algorithms

Author: Abdur Rahman, Abu Nayem, Saeed Siddik
Journal: International Journal of Intelligent Systems and Applications @ijisa
Article in issue: 3 vol.15, 2023.
Free access
Non-functional requirements define the quality attribute of a software application, which are necessary to identify in the early stage of software development life cycle. Researchers proposed automatic software Non-functional requirement classification using several Machine Learning (ML) algorithms with a combination of various vectorization techniques. However, using the best combination in Non-functional requirement classification still needs to be clarified. In this paper, we examined whether different combinations of feature extraction techniques and ML algorithms varied in the non-functional requirements classification performance. We also reported the best approach for classifying Non-functional requirements. We conducted the comparative analysis on a publicly available PROMISE_exp dataset containing labelled functional and Non-functional requirements. Initially, we normalized the textual requirements from the dataset; then extracted features through Bag of Words (BoW), Term Frequency and Inverse Document Frequency (TF-IDF), Hashing and Chi-Squared vectorization methods. Finally, we executed the 15 most popular ML algorithms to classify the requirements. The novelty of this work is the empirical analysis to find out the best combination of ML classifier with appropriate vectorization technique, which helps developers to detect Non-functional requirements early and take precise steps. We found that the linear support vector classifier and TF-IDF combination outperform any combinations with an F1-score of 81.5%.
Software Requirements, Non-Functional Requirements, Vectorization, Classification, Machine Learning
Short address: https://sciup.org/15018999
IDR: 15018999 | DOI: 10.5815/ijisa.2023.03.05
Text of the scientific article Non-Functional Requirements Classification Using Machine Learning Algorithms
Published Online on June 8, 2023 by MECS Press
Requirement analysis is the most important artifact-producing step in the software development life cycle [1, 2]. Software engineering requirements are generally classified into functional requirements and Non-Functional Requirements (NFRs) [3]. The functional requirements include the required functionality of an application and the constraints for the design or implementation of the application. On the contrary, the NFRs describe the quality attributes essential in architectural design and constraint policy [4]. Security, availability, performance, etc., are examples of NFRs, which are vital software application components to satisfy stockholders. So, identifying both functional requirements and NFRs is individually crucial for ensuring an effective software development process. But, both types of requirements are mixed together within the same documents, which is challenging to separate manually. However, neglecting NFRs extraction can lead to project failure or increase production costs. The early identification of NFRs leads to incorporating the system-level constraints at the early stage of architectural designs. Therefore, NFRs detection at an early stage of software development is significant for developing quality software at the same time, reducing development and maintenance cost.
Analyzing text documents manually to detect requirements is infeasible in terms of time, cost and accuracy [5, 6]. Therefore, automatic requirement classification is essential to solve the requirement classification problem for large volumes of textual documents. As an automatic requirements classification effort, the text requirements were classified as functional and NFRs using an information retrieval technique by [7, 8]. The automatic supervised ML algorithm was applied to classify requirements as functional and non-functional using syntactic and keyword features in [1]. Natural language processing-based identification of NFRs was introduced by [9] using k-Nearest Neighbor (kNN), Support Vector Machine (SVM) and Naïve Bayes (NB) algorithms. A semi-supervised ML strategy to detect and classify NFRs in textual software requirements specification was introduced by Casamayor [10]. Where the multinomial NB with expectation maximization model was applied to construct classification models. An unsupervised ML technique was proposed to detect NFRs realizing the textual semantics of software requirements in [11]. The requirements were categorized into functional requirements and NFRs, also subcategories of NFRs were detected using SVM by [3]. The user reviews were classified into four types of NFRs using four vectorizers combined with NB, J48 and bagging ML algorithms by [12]. According to the presented results, the Augmented User Reviews (AUR)-BoW with bagging performed best, with an accuracy of 71.4%, recall of 72.3% and F-measure of 71.8%.
The research [13] examined the NFRs classification performance for five vectorization methods to identify the effective one. In [14], compared the accuracy of random forest and gradient boosting algorithms for functional requirements and NFRs classification. The authors claimed that the gradient boosting algorithm performed better prediction than the random forest. The performance of three vectorization techniques and four ML algorithms was presented for functional and NFRs classification problems in [15]. The authors considered BoW, TF-IDF, and Chi-Squared as vectorizers and Logistic Regression (LR), SVM, Multinomial NB, and kNN as ML algorithms for classifying requirements into functional requirements and NFRs. They also identified the sub-categories of NFRs from the requirements. The authors report that TF-IDF and LR had better performance for requirements classification.
Divergent existing systems used ML algorithms to classify software requirements automatically. But, the automatic requirements classification from natural language is still challenging. Because the same type of software requirement is represented differently by software stakeholders and requirement analysts [16]. This leads to inconsistency in requirements elicitation which makes ML based automated classification more error-prone. So, it is a challenging task to explore the ideal ways to obtain good automated classification particularly for software requirements classification. In addition, a suitable combination of vectorization technique and ML algorithm is needed to achieve good classification performance. This leads to the following Research Questions (RQ).
-
• RQ1. Which vectorization strategy performs best (BoW vs. TF-IDF vs. Hashing vs Chi Squared) for classifying Non-Functional Requirements?
To answer this question, the classification performance of non-functional requirements was examined when distinct vectorization techniques were applied. We prepared four vectorization methods including (i) BoW, (ii) TF-IDF, (iii) Hashing and (iv) Chi Squared to extract textual features from the used PROMISE_exp dataset [17]. The results were compared with each other to select the best vectorization strategy for NFRs.
• RQ2. Which combination of ML Classifier and Vectorizer provides the best performance for the nonfunctional requirements classification task?
2. Related Works
To answer this RQ, we used the same results as the classifications obtained to answer RQ1, but instead of comparing the vectorization techniques, we compared the results obtained for fifteen classifiers through performance measures as presented in the Results section. The results were compared with each other in terms of accuracy, precision, recall and F1-score metrics for the experimented dataset.
In this work, we used a publicly available software requirements dataset PROMISE_exp containing labelled functional and non-functional requirements. The dataset is preprocessed to normalize the textual requirements. Then, individual requirement text is converted to feature matrix using four vectorization schemes named as (i) BoW, (ii) TF-IDF, (iii) Hashing and (iv) Chi Squared. The n-grams i.e., n-gram word, n-gram character and character word bound options are applied when extracted features. Next, the 15 most prominent ML classifiers are trained and tested for each type of feature. Finally, the classification performance of each classifier is measured separately in terms of accuracy, precision, recall and F1-score metrics. The experimental results are demonstrated and statistically analyzed to derive the correlation between ML algorithm and vectorization techniques.
The main contribution of this work is finding the best combination of ML classifier and vectorization technique in NFR classification. To do that, we empirically analyzed the PROMISE_exp dataset and reported a comparison between four vectorization techniques and the comparison of the use of each one of these techniques combined with fifteen supervised ML classifiers. Through this evaluation, we demonstrated which combination of the vectorization method and ML algorithm is effective in classifying NFRs into predefined categories. This comparative analysis is an early-stage analysis to refer to future works in the software requirements community.
The rest of this paper is organized as follows: in Section 2 presents the related works. Section 3 presents the research method used in this study. Section 4 explains the experimentation. Section 5 describes the results that we found.
The RQs are discussed in Section 6. The threats to validity of the study are discussed in Section 7. Finally, the conclusions and future work are presented in Section 8.
The detailed description of what a software will do and how it is expected to perform is called software requirements. As the analysis and identification of software requirements is unavoidable for effective software development practice, divergent research work has been approached in this domain. The research works related to functional and non-functional requirements classification are summarized and discussed in this section.
A supervised automatic functional and NFRs classification method proposed [1], using syntactic and keyword features. Both the binary and multi-class NFRs classification was evaluated leveraging the hybrid training set.
The requirements were classified into functional and non-functional automatically using SVM in [3]. Also, NFRs were subcategories into predefined labels using multi-class classifiers. The authors practiced PROMISE dataset and handled data unbalance problem utilizing user comments made on Amazon products. The research claims precision and recall up to 90% for classification of functional and NFRs as well as sub-categories of NFRs.
A NFRs classifier was designed using information retrieval technique to reduce manual effort for classifying functional and non-functional requirements by [7]. The authors also conduct another study, where a classification algorithm is described and then evaluates its effectiveness by experimenting against a large dataset [8]. The research is able to support an analyst searching NFRs quickly from large and complex documents.
An automatic natural language processing-based technique was introduced to identify non-functional requirements from natural language documents by [9]. The work locates and classified fourteen NFRs using kNN, SVM and NB ML algorithms. The research reports that certain features are associated with specific NFR attributes. However, the framework suffers from misclassification and generalizability issues.
A semi-supervised ML strategy was introduced by Casamayor to detect and classify NFRs in textual SRS [10]. Where, data was collected iteratively using an Expectation Maximization (EM) method. Then the user feedback and collected data were utilized to practice the method. The multinomial NB with EM model was used for training the requirements. The work claimed that their semi-supervised approach performed better than supervised methods.
An unsupervised ML technique was experimented utilizing the textual semantics of functional requirements to detect NFRs by [11]. In this work, semantically cohesive clusters are generated from requirements using word similarity and clustering practices. Then, the clusters were classified according to the semantic similarity of NFRs label.
The user reviews were classified automatically into four types of NFRs including reliability, usability, portability, and performance by [12]. For this purpose, the four vectorizers named as BoW, TF-IDF, CHI and AUR-BoW were combined with NB, J48 and bagging ML algorithms. According to the presented results, the AUR-BoW (proposed by authors) with bagging achieved the best score, with an accuracy of 71.4%, recall of 72.3% and F-measure of 71.8%.
In [13], the NFRs classification performance was examined for 5 vectorization methods including (i) document embedding, (ii) term frequency, (iii) TF-IDF, (iv) Word2Vec and (v) Doc2Vec. The results were compared with each other, and they found that sparse composite document vectors and Doc2Vec achieved higher performance compared to traditional systems. The authors practiced the PROMISE dataset to evaluate the performance of vectorizers.
The classification accuracy of random forest and gradient boosting algorithms were compared for functional requirements and NFRs by [14]. The authors demanded that the gradient boosting algorithm showed better prediction performance than random forest. However, the classification accuracy is dominated by random forest when classifying functional requirements.
The effectiveness of different vectorization techniques and ML algorithms for functional and NFRs classification problems is compared by [16]. The vectorizers include (i) BoW, (ii) TF-IDF, and (iii) Chi Squared and the ML algorithms include (i) LR, (ii) SVM, (iii) multinomial NB and (iv) kNN for classifying requirements as functional and non-functional, and the sub-classes of NFRs. The research found that TF-IDF and LR had a better performance with F-measure 0.91 (in binary), 0.74 in NFRs classification and 0.78 in general classification.
An empirical analysis was conducted using eight ML algorithms and two vectorization strategies in [18]. The ML algorithms include MNB, Gaussian NB, KNN, SVM, SGD SVM and DT where BoW and variations of TF-IDF were considered as vectorizers. The research claimed that combination of SGD SVM and TF-IDF (character level) secured best classification results. However, other ML algorithms and vectorization techniques could be incorporated to explore the best pair.
Syntactic and semantic patterns-based approach was proposed to identify NFRs from textual requirements [19]. The authors utilized a domain specific language to extract patterns and rules detecting NFRs. The work was experimented on a publicly available dataset and claimed high precision without compromising on the recall score.
In this section, different approaches for functional and non-functional requirements classification problems are analyzed. Existing work has been focused on BoW, TF-IDF and Chi Squared feature extraction schemes. To the best of our knowledge, hashing vectorization technique is not being explored from the NFRs classification point of view. In addition, the Ridge and PA algorithms are hardly found for NFRs classification problems. Therefore, this research objective is to experiment mentioned four vectorizers and fifteen classifiers to explore the best combination in NFRs analysis domain. Unlike previous work, we will investigate which vectorization method and ML algorithm has the best results to perform requirements classification using the PROMISE_exp dataset.
3. Method
This research analyzed different ML algorithms and vectorization techniques to explore the best combination for non-functional requirements classification. The framework selected fifteen ML classifiers and four vectorization methods. The performance of each classifier is collected for BoW, TF-IDF, Hashing and Chi Squared vectorizers, which can be found in detail in the Results section. The techniques to achieve the proposed framework is based on the following steps and depicted in “Fig. 1.”.
-
• Dataset Pre-processing
-
• Vectorization and
-
• Classification
-
3.1. Dataset Pre-processing
-
3.2. Vectorization
The technical details of the above-mentioned phases are discussed in the following sub-sections.
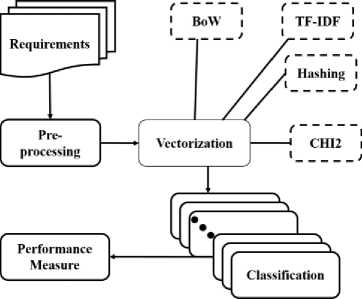
Fig.1. Overview of the NFRs classification framework
As depicted in “Fig. 1.”, the requirements are processed to extract ML features using BoW, TF-IDF, Hashing and Chi-Squared (CHI2). Then multiple classifiers were built to measure the NFRs classification performance.
The first step of this framework is concerned with pre-processing of experimented dataset i.e., PROMISE_exp [17]. Several pre-processing steps are applied to clean and normalize the textual requirements. This process includes tokenization, lower casing, removal of contraction, punctuation and stopwords, finally words are stemmed. In the tokenization phase, requirement sentences are converted into a list of words. Next, lower casing is applied to convert capital letters to small ones. Then, the contraction and punctuation are removed from the sentences. All the conjunction words and auxiliary verbs are eliminated in the stopwords removal phase. Finally, the stemmer is applied to eradicate morphological affixes from the words and reduces the variation in similar words.
The raw text data is not being processed by ML algorithms; numerical representation of text data is required to feed as input in the ML model. Therefore, text documents are required to transform into vector representation to apply machine learning algorithms on it. This process of converting textual data into numbers is called vectorization. Here, requirements are represented as vectors in multidimensional space regardless of the vectorization method. Each dimension of the vector has a weight reflecting characteristics of the requirements. The vectorization methods applied in this research are discussed briefly in below.
Bag of Words (BoW): This is a natural language processing method to extract ML compatible features from text dataset [20]. The occurrence of words within a document is represented by a known word vocabulary and a measure of how many known words are present. Using this scheme, the features are extracted from textual requirements, where a requirement ‘r’ is represented by a vector X r = ( x 1,r … x i, r … x n,r ) in which x i,r indicates the weight of feature ‘i’ measured by the frequency of term ‘i’ in requirements ‘r’ and ‘n’ denotes the number of terms in the dictionary. Thus, the requirements are represented as vectors which are then fed as input to the supervised ML algorithms.
Term Frequency and Inverse Document Frequency (TF-IDF): The TF refers to the frequency of a particular term in a document and IDF looks at how common or uncommon a term is in the document. This is a very useful technique to extract features in information retrieval systems [21]. The TF is the frequency value of a term in a particular requirement as described in “(1)”.
- . i _appear_in_a_requirement n y total „term _in_requirements
On the other hand, the IDF is calculated in two phases, first the number of requirements in the corpus is divided by the number of requirements containing a specific term, then apply logarithm on it as formalized in “(2)”.
. , r , , total_no_of„requirements
id ft = Loa p (----------------------------- terrnj.„containing requirements
The TF-IDF is measured as the product of TF and IDF for a particular term in a dataset as shown in “(3)”.
tfi — id fi = tf, X idft
The TF-IDF will produce 0 for the common term which appears in many requirements, on the contrary, if the term is uncommon in the requirements, it will produce 1. Thus, this technique reflects the importance of a term to a requirement in the NFRs dataset.
Hashing: This vectorization method utilized the hashing process to find the token string name to feature integer index mapping. The software requirements are converted into a sparse matrix which holds the token occurrence counts. Where, each token directly maps to a column position in a matrix, and the matrix size is predefined. For a dataset, if categorical vector size is m , the encoded vector size is n and f1 and f2 are two functions for hashing. The hashing feature is extracted for each categorical variable v as following steps.
-
• find the index into encoding vector i as f1(v) % and
-
• add 1 or -1 to the encoding vector element at index i from the first step using f2(v) % 2.
-
3.3. Classification
The n represents encoding vector length which is selected according to expected output dimensionality.
Chi Squared: This is a statistical measurement applied to test independence of two events; in this case software requirement and label [22]. It selects ML features to test whether the occurrence of a specific term and label is independent. Thus, it revealed the relationship between a requirement and class. If the requirement has relationship with the class, it is considered as important feature, else, the requirement is not important as training feature.
After performing the text vectorization, the generated vectors are used to train and predict the classification models. The classifiers are supervised ML algorithms and the predefined labeled dataset is used to train the algorithm. The ML supervised algorithms selected in this research are:
-
• Logistic Regression (LR): This is a regression class where an independent variable is used to predict the dependent variable [23]. The prediction outcome is given as probabilistic values between 0 and 1. The binary version of logistic regression is applied when a dependent variable has two values (class). On the other hand, if a dependent variable has more than two values, multinomial logistic regression is utilized for classification purposes. As this research is multi-class classification problem, multinomial logistic regression is used.
-
• Ridge: The method of analyzing regression data that suffers for multicollinearity is known as ridge regression model [24]. In this system, the independent features in the regression model are strongly correlated. This model converts the text labels into [-1, 1] to solve the classification problem using regression technique.
-
• Passive Aggressive (PA): This is a large-scale ML learning algorithm derived from the standard perceptron algorithm. It was proposed by Crammer in 2006 to improve the perceptron algorithm on linearly separable data [25]. PA does not require learning rate instead regularization attribute is included. It can be leverage to classify large volume of textual requirements.
-
• Stochastic Gradient Descent (SGD): This is an optimization ML algorithm that minimizes a cost function using function parameters value [26]. It is a mini batch learning system and thus used for large scale and sparse ML problems as well as in text classification. Therefore, this algorithm is applied for software requirements classification task.
-
• Naïve Bayes (NB): This is a probabilistic ML algorithm which finds the probability of occurring an event based on the probability of another event that has already occurred. The algorithm is worked based on the conditional probability principle given by the Bayes Theorem [27]. It is used in various classification task, so this is widely utilized for software requirements classification problem.
-
• Support Vector Machine (SVM): This is a linear ML algorithm that solves classification and regression problems by constructing the hyperplane that divides data in two sections [28]. This model is robust to noise handling and has the ability to handle large datasets. Therefore, SVM is widely used in many problems such as facial expression recognition, handwritten digit recognition and text classification. So, this model can be utilized to solve the requirements classification problem.
-
• k-Nearest Neighbors (kNN): This is a lazy learning and non-parametric model that assigns a data point to a
group estimating the likelihood based on what group the data points nearest to it belong to [29]. This algorithm is used to handle both classification and regression problems; however, it is typically used for classification tasks. Here, a class label is assigned on the basis of majority of vote to predict the classification of a new data. Therefore, this classifier is a good candidate for non-functional requirements classification problem.
• Decision Tree (DT): This is a tree-like structure containing (i) internal node, (ii) branch and (iii) leaf node to denote the feature, decision rule and outcome respectively [30]. It is used both for classification and regression tasks, but mostly it is preferred to solve classification related tasks. As requirements identification is classification problem, this algorithm is popular in this domain.
• Random Forest (RF): This is an ensemble learning algorithm where multiple classifiers are combined to solve a complex problem and to improve the model performance [31]. This classifier constructs multiple decision trees and merges them together to achieve an accurate and stable classifier. Thus, this algorithm can be used to classify software requirements by searching the textual feature among a random subset of features.
• Bagging: This is a bootstrap ensemble method that combines the outputs from many homogenous algorithms to improve prediction performance [32]. The homogenous learners are trained sequentially and combined afterward to determine the model’s average, then build the final model. It is commonly used of classification problems, especially when using decision trees or support vector classifier as a part of a boosting ensemble. This model combined with support vector classifier for software requirement analysis purpose.
• Gradient Boosting (GB): This is an iterative gradient model that minimizes a loss function by iteratively selecting a negative gradient pointing function [33]. The technique combined multiple weak learning algorithms together to build a strong classifier. This classifier is very effective in terms of prediction speed and accuracy, particularly when considering large and complex datasets. Thus, this algorithm is used detecting of non-functional requirements from textual dataset.
• Adaboost: This is an iterative ensemble technique that combines multiple poorly performing models to get a strong classifier [34]. The prediction accuracy is increased by giving more weightage to the target that is misclassified by the classifier. Therefore, this model is a good candidate to categorize non-functional requirements into predefined classes.
4. Experiment4.1. Environment Setup
4.2. Dataset
4.3. Vectorization
In this work, the four vectorization methods and eleven ML algorithms are selected to analyze and classify nonfunctional requirements into multiple labels. The variation of NB named as Multinomial NB (MNB), Binomial NB (BNB), and Complement NB (CNB) are used. The Support Vector Classifier (SVC) and Linear SVC (LSVC) of the SVM family are also applied here to explore the best performing combination for NFRs classification problem. Thus, a total of fifteen classifiers are investigated for four vectorization methods. The prediction performance will be compared separately for each combination to detect the best classifier for NFRs classification.
We used a public dataset on software requirements and then vectorized them to select the optimal machine learning classifier. We used four standard vectorization methods: BoW, TF-IDF, Hashing and Chi-Squared. Alongside, we considered the 15 most popular machine learning classifiers named (i) LR, (ii) Ridge, (iii) PA, (iv) SGD, (v) MNB, (vi) BNB, (vii) CNB, (viii) SVC, (ix) LSVC, (x) kNN, (xi) DT, (xii) RF, (xiii) Bagging, (xiv) GB and (xv) Adaboost. The classification models were built for each combination of vectorizers and classifiers. The dataset, vectorization techniques, classifiers and performance evaluation metrics are described in this section.
This research used the most popular data analytics programming language Python , for data processing and interpretation. The web-based computing platform Jupyter Notebook was utilized based on Anaconda's scientific computing framework . Several software libraries were also used, including pandas to handle data, nltk for data processing and scikit-learn for building the ML classifiers.
We evaluated the classification performance of the mentioned algorithms using the PROMISE_exp [17] database, which is an expansion of the PROMISE dataset [35]. The expanded version consists of 969 requirements, where functional and non-functional requirements were 444 and 525, respectively. Table 1 presents the composition of requirements data in the dataset. According to that table, the NFRs class distributions are imbalanced. The difference between the minimum and maximum number of requirements is 113 for security and portability classes. Where the portability class contains only 1.24% of the total requirements in the dataset.
Table 1. PROMISE_exp [17], dataset summary
|
Category |
# of reqs. |
ratio (%) |
min # of words |
max # of words |
avg. # of words |
|
Functional |
444 |
45.82 |
04 |
84 |
16.12 |
|
Availability (A) |
31 |
3.20 |
07 |
50 |
18.29 |
|
Legal & Licensing (L) |
15 |
1.55 |
06 |
37 |
16.73 |
|
Look & Feel (LF) |
49 |
5.06 |
07 |
54 |
19.20 |
|
Maintainability (MN) |
24 |
2.48 |
09 |
59 |
24.54 |
|
Operability (O) |
77 |
7.95 |
08 |
72 |
18.66 |
|
Performance (PE) |
67 |
6.91 |
09 |
75 |
22.24 |
|
Scalability (SC) |
22 |
2.27 |
09 |
42 |
19.14 |
|
Security (SE) |
125 |
12.90 |
05 |
86 |
17.90 |
|
Usability (US) |
85 |
8.77 |
06 |
65 |
21.06 |
|
Fault Tolerance (FT) |
18 |
1.86 |
09 |
40 |
18.22 |
|
Portability (PO) |
12 |
1.24 |
08 |
24 |
13.17 |
|
Total |
969 |
100 |
- |
- |
- |
The vectorization process is an unsupervised learning technique used to extract ML features. This research used the vectorization techniques of the whole dataset to train the classification models. For this purpose, text processing methods were applied to bring the text into a form that is predictable and analyzable:
-
• Each requirement was tokenized, and unwanted contents (e.g., HTML tags, URLs, single characters, etc.) were removed from the dataset. All these things are carried out using the ‘re’ module of nltk.
-
• Stopword removal, lemmatization, lower casing and other necessary operations were carried out using the nltk package.
-
• The requirements were represented as vectors in multidimensional space using vectorization strategies.
Regarding vectorization techniques, (i) BoW, (ii) TF-IDF, (iii) Hashing and (iv) Chi Squared were implemented using CountVectorizer, TfidfVectorizer, HashingVectorizer and SelectKBest of the scikit-learn library, respectively. In addition, the (i) word, (ii) char, and (iii) character ward bound (cw) analyzers were applied when vectorizing the requirements, and the best-performing analyzer was picked for this study. The parameters for vectorization were as below:
-
• BoW: CountVectorizer(analyzer = anlyze, stop_words = 'english')
-
• TF-IDF: TfidfVectorizer(analyzer = anlyze, stop_words = 'english', ngram_range = (1, 2))
-
• Hashing: HashingVectorizer(analyzer = anlyze, stop_words = 'english', alternate_sign = False)
-
• Chi Squared: SelectKBest(chi2, k = 2)
-
4.4. Classification Methods
-
4.5. Model Validation
-
4.6. Model Evaluation Metrics
Where, anlyze is a list of word , char and char_wb . For Chi Squared pipeline, BoW, TF-IDF and Hashing was applied and selected the best one.
The vectorization methods produce vectors with distinct characteristics, these vectors are fed as input into the classification model. The use of a single classification method might favor one of them. The study thus used fifteen classifiers combined with each vectorization technique. The classifiers include (i) LR, (ii) Ridge, (iii) PA, (iv) SGD, (v) MNB, (vi) BNB, (vii) CNB, (viii) SVC, (ix) LSVC, (x) kNN, (xi) DT, (xii) RF, (xiii) Bagging, (ix) GB and (xv) Adaboost. The classifiers were implemented using scikit-learn library and included were LogisticRegression, RidgeClassifier, PassiveAggressiveClassifier, SGDClassifier, MultinomialNB, BernoulliNB, ComplementNB, SVC, LinearSVC, KNeighborsClassifier, DecisionTreeClassifier, RandomForestClassifier, BaggingClassifier, GradientBoostingClassifier and AdaBoostClassifier.
The multi-class requirements classification was conducted using scikit-multiclass (OneVsRestClassifier) technique, e.g. OneVsRestClassifier (LogisticRegression (random_state=0, max_iter=1000)). Where, binary classifier with one-vs-rest technique is used. It creates an individual classifier for each class in the target. And each binary classifier chooses a single class and marks it as positive by encode it as 1. The rest of the classes are considered as negative labels and thus encodes with 0.
The model performance is validated using k-fold cross validation practice, where mean accuracy and standard deviation is calculated and compared. For k-fold cross validation, the dataset is divided into 5-fold (as the dataset is small; portability class has only 12 items) and it iterates five times to collect the results. Then, the mean accuracy is calculated by adding all the accuracy results divided by the number occurrences. This cross-validation process is implemented using cross_val_score of scikit-learn library as given below:
cross_val_score (model, features, labels, scoring='accuracy', cv=5), where the model is any one of fifteen classifiers. After getting the validation score, the mean accuracy and standard deviation is obtained by mean () and std () functions respectively.
The evaluation metrics are used to measure the performance of a classifier. In this research, the performance is evaluated using (i) Accuracy, (ii) Precision, (iii) Recall, (iv) F1-score, (v) Mean Accuracy, and (vi) Standard Deviation. The calculation process of these metrics is discussed below.
Accuracy: This is a proportional measure of correct prediction over all observations based on confusion matrix value. This is a good metric when importance is given equally for all considered classes. The accuracy is calculated according to the formalization shown in “(4)”.
Accuracy
TP+TN
TP+FP+TN+FN
Precision: This evaluates the exactness of a classifier i.e., how many of the predicated classes are correctly labeled. This is the ratio between the correctly identified positives and all identified positives (true positives and false positives) which is calculated as “(5)”. Here, higher precision indicates less false positive.
Pr e cision
TP+FP
Recall: This metric reveals the classifier’s ability to predict actual positive classes and called sensitivity of a classifier. This is the ratio between predicted true positives and what was actually tagged. The recall is measured as “(6)”, where the higher recall means the classifier generates less false negatives.
F1-score: The balanced measure of the precision and recall is F1-score. This is the weighted harmonic mean of precision and recall and calculated as “(7)”.
2*Pr eciion*Re call
Fl — Score =----------- Pr ecision+Re call
In “(4), (5), (6) and (7)”, TP (true positives) represents the number of requirements of a target category which are correctly predicted as that category, FP (false positive) means the number of requirements of any categories other than a target category which are predicted as the target category, and NF (false negative) is the number of requirements of a target category which are predicted as any categories other than the target category.
Mean Accuracy: This is the mean value of predicted classification accuracies, which is measured from the results of k-fold cross validation as “(8)”.
X = Xi
n
Where, x is the mean value, n is number of values and x is value at the ith position.
Standard Deviation: The standard deviation is the average distance of all measured values of a variable from the mean value of the distribution. In this case, the average distance of accuracies from the mean accuracies is measured as standard deviation according to “(9)”.
Where, s is the standard deviation, x is the mean value, n is number of values and x is value at the ith position.
In this research, the performance of fifteen machine learning classifiers for four vectorizers will be evaluated and compared separately, to classify NFRs of PROMISE_exp dataset.
5. Results
In this section, we present the results of the experiment and discuss its implications. We conducted fifteen evaluations to determine the best combination of ML algorithm and feature extraction technique to classify nonfunctional requirements into predefined classes. The findings are presented in this section to answer the research questions. This study addresses two research questions to present its findings and is described in the Discussion section.
The evaluated accuracy, precision and recall scores achieved for this classification tasks of NFRs is presented in Table 2. We evaluated the effectiveness of classifying NFRs in eleven different classes, according to labels defined in the PROMISE_exp dataset [17]. In this classification, there was a significant decrease in the number of instances, since the database has 444 functional requirements, making the classification of the 11 classes of NFRs have only 525 instances in its favor (969 of the corpus minus the 444 functional requirements).
-
5.1. Accuracy, Precision, Recall Scores
-
5.2. F1-Score
The LSVC algorithm performed best for NFRs classification based on the measured average accuracies. However, the achievement of the algorithms was worst for Chi Squared vectorization method compared to other granularities. The accuracy, precision and recall of the algorithms using four vectorizers are plotted in Table 2. Where, the lowest performers are KNN using Chi Squared and BNB using Hashing, with an accuracy of 0.12 and 0.126 respectively. Conversely, there was an improvement in the performance of algorithms when using TF-IDF, Hashing and BoW vectorizers except the combination of BNB with Hashing. In terms of accuracy metric, the Ridge, PA, SGD, LSVC and Adaboost algorithms show more than 70% classification performance when using BoW, TF-IDF and Hashing vectorizers. This is the indication of consistent results for requirements classification combining these techniques. However, the accuracy score of Chi Squared is low for all classifiers and reports 0.51 as maximum. Based on the analysis of results, the PA and LSVC algorithms scored 0.815 accuracy using TF-IDF which is the superior to other algorithms. However, the LSVC secured highest average accuracy, i.e., 0.713.
Table 2. Accuracy, precision and recall of ML algorithms and vectorization techniques
|
BoW |
TF-IDF |
Hashing |
CHI2 |
|||||||||
|
Accuracy |
Precision |
Recall |
Accuracy |
Precision |
Recall |
Accuracy |
Precision |
Recall |
Accuracy |
Precision |
Recall |
|
|
LR |
0.735 |
0.735 |
0.520 |
0.603 |
0.603 |
0.245 |
0.629 |
0.629 |
0.360 |
0.510 |
0.510 |
0.142 |
|
Ridge |
0.728 |
0.728 |
0.520 |
0.750 |
0.755 |
0.595 |
0.742 |
0.742 |
0.552 |
0.510 |
0.510 |
0.128 |
|
PA |
0.755 |
0.755 |
0.680 |
0.815 |
0.815 |
0.704 |
0.768 |
0.768 |
0.693 |
0.486 |
0.486 |
0.103 |
|
SGD |
0.748 |
0.748 |
0.596 |
0.801 |
0.801 |
0.700 |
0.768 |
0.768 |
0.579 |
0.510 |
0.506 |
0.128 |
|
MNB |
0.768 |
0.768 |
0.572 |
0.510 |
0.510 |
0.166 |
0.437 |
0.437 |
0.090 |
0.481 |
0.481 |
0.090 |
|
BNB |
0.563 |
0.563 |
0.310 |
0.636 |
0.636 |
0.530 |
0.126 |
0.126 |
0.091 |
0.506 |
0.506 |
0.128 |
|
CNB |
0.715 |
0.715 |
0.558 |
0.768 |
0.768 |
0.562 |
0.576 |
0.575 |
0.319 |
0.132 |
0.132 |
0.182 |
|
SVC |
0.623 |
0.623 |
0.366 |
0.735 |
0.735 |
0.508 |
0.662 |
0.662 |
0.411 |
0.457 |
0.457 |
0.124 |
|
LSVC |
0.768 |
0.768 |
0.590 |
0.815 |
0.815 |
0.700 |
0.762 |
0.762 |
0.571 |
0.510 |
0.506 |
0.150 |
|
KNN |
0.609 |
0.609 |
0.436 |
0.722 |
0.722 |
0.521 |
0.689 |
0.689 |
0.473 |
0.120 |
0.120 |
0.124 |
|
DT |
0.550 |
0.550 |
0.314 |
0.510 |
0.510 |
0.395 |
0.556 |
0.556 |
0.376 |
0.506 |
0.506 |
0.141 |
|
RF |
0.437 |
0.437 |
0.940 |
0.444 |
0.444 |
0.957 |
0.437 |
0.437 |
0.091 |
0.506 |
0.506 |
0.135 |
|
Bagging |
0.689 |
0.689 |
0.436 |
0.715 |
0.715 |
0.550 |
0.722 |
0.722 |
0.463 |
0.506 |
0.506 |
0.128 |
|
GB |
0.636 |
0.636 |
0.410 |
0.543 |
0.543 |
0.372 |
0.583 |
0.583 |
0.385 |
0.481 |
0.481 |
0.120 |
|
AdaBoost |
0.695 |
0.695 |
0.477 |
0.709 |
0.709 |
0.532 |
0.722 |
0.722 |
0.511 |
0.444 |
0.444 |
0.182 |
According to the precision findings in Table 2, it is possible to identify that Ridge, PA, SGD, LSVC and Adaboost algorithms achieved the best results in precision measure for all vectorizers except Chi Squared. The precision score of these combinations were equal to or more than 70%. Where the PA and LSVC combined with TF-IDF scored 0.815 which is greater than other combinations. Both the MNB and SGD scored 0.768 using BoW and Hashing respectively, which is the second highest among the obtained precision. However, the Chi Squared performed worst for all classifiers with a maximum value of 0.51 using LR and Ridge algorithms. Based on the precision measures, the remarkable difference was found for LSVC with an increase of 61% from Chi Squared to TF-IDF measures. And the maximum average precision score is 0.712 achieved by LSVC.
As stated in Table 2, it is noticeable that RF had the better classification performance with its recall measure of 0.957 and 0.95 using TF-IDF and BoW respectively. However, the RF algorithm achieved only 0.091 and 0.135 for Hashing and Chi Squared vectorization methods. Among the four vectorizers, the Chi Squared performed poor and scored only 0.182 as maximum recall value. Among the classifiers, the MNB algorithm showed the lowest score both for Hashing and Chi Squared vectorization with the recall value of 0.09. On the other hand, the PA, SGD and LSVC algorithms showed good performance (0.57 or more) for all vectorizers except Chi Squared. For these three vectorizations, the average recall of PA, SGD and LSVC algorithms is 0.692, 0.625 and 0.620 respectively.
In relation to the results of vectorizers in Table 2, Chi Squared performed worst with the average accuracy, precision and recall of 0.429, 0.429 and 0.134 respectively. The average performance of BoW and TF-IDF is same (except fractional difference) and performed best compared to other vectorizers. Where the average score of TF-IDF is 0.66, 0.66, 0.53 for accuracy, precision and recall respectively. The Hashing is followed by BoW and TF-IDF for NFRs classification. Therefore, BoW and TF-IDF combined with LSVC can perform good for NFRs classification problem.
This comparative study measured F1-score to evaluate the effect of vectorization methods when using different ML algorithms on the predictive performance of requirements classification. “Fig. 2.”, presents the evaluated performance in terms of F1-score, where four vectorization methods are demonstrated for fifteen classifiers. The higher F1-score in a result means better combination of classifier and vectorizer.
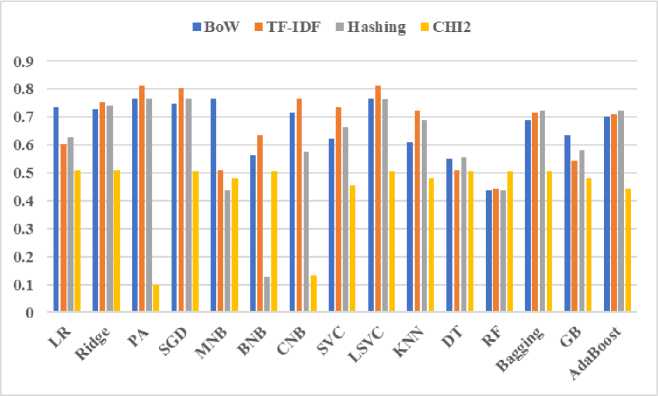
Fig.2. F1-score of ML algorithms for vectorization techniques
According to the plotted results in “Fig. 2.”, the PA, SGD and LSVC classifiers performed best using BoW, TF-IDF and Hashing vectorization techniques and the measured performance is 0.75 or more. Among the other classifiers, both MNB and CNB secured second position with F1-score of 0.768 using BoW and TF-IDF vectorizer. The LR and Ridge using BoW, SVC and kNN using TF-IDF, Bagging and Adaboost using Hashing achieved F1-score ranging from 0.722 to 0.755. On the other hand, the BNB using TF-IDF and GB using BoW reported F1-score as 0.636. However, both DT and RF scored lower in terms of F1-score which is below of 0.56; the results are comparatively lower than the other mentioned classifiers. In addition, the Chi Squared performed below of 0.2 as F1-score for two cases, which needs to be investigated more.
For better visualization and comprehension, “Fig. 2.” shows the relation among the vectorizers and the F1-score obtained by each classifier. We can notice that, there exists a relationship among the combination of vectorizer and classifier to achieve good performance. Because, classification performance is varied based on the combination of vectorizer and ML algorithm for the same dataset. In relation to that, it is observed that Chi Squared using PA and CNB has a significant negative impact on F1-score. Most of the F1-score of this experiment increases when the classifier is combined with BoW, TF-IDF or Hashing vectorizer. Moreover, except few cases consistent F1-score is found for BoW, TF-IDF and Hashing, e.g., F1-score of Ridge classifier is almost same for these three vectorizers. However, hashing combined with BNB performed worst which is not common for this study. Analyzing the findings of “Fig. 2.”, it is found that PA, SGD and LSVC are the top scorers compared to other classifiers. The average F1-score of SGD and LSVC are 0.707 and 0.713 respectively. However, PA scored only 0.1 using Chi Squared in terms of F1-score measure. Therefore, among selected classifiers, LSVC is the best performer when considering these four vectorization techniques.
-
5.3. K-fold Cross Validation
The k-fold cross validation results for ML algorithms and BoW, TF-IDF and Hashing vectorizers are analyzed in order to verify model performance consistency. The k-fold cross validation result is demonstrated using mean accuracy and standard deviation in “Fig. 3.” and “Fig. 4.” respectively. The accurate model outcomes result in better decision; therefore, mean accuracy and standard deviation are measured to find the best combination of ML algorithm and vectorizer. The k-fold cross validation measure is not considered for Chi Squared vectorizer in this study.
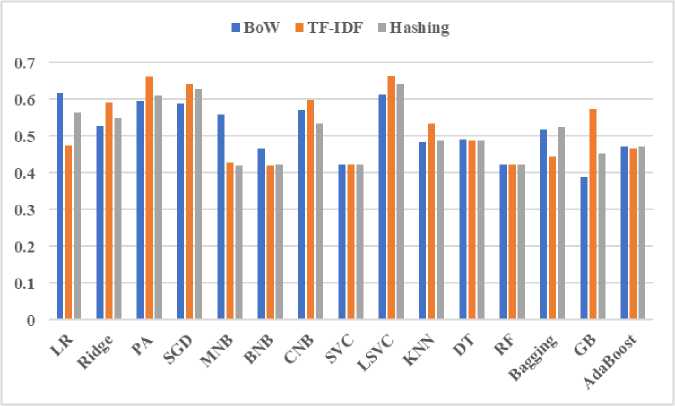
Fig.3. Mean Accuracy (MA) of ML algorithms for BoW, TF-IDF and hashing vectorizers
The “Fig. 3.” presents an overview of mean accuracy of this experiment obtained by the three feature extraction techniques BoW, TF-IDF and Hashing combined with fifteen ML algorithms. In general, the mean accuracy is greater or equal to 0.4, that is indication of good consistency of classification models.
■ BoW ITFIDF ■ Hashing
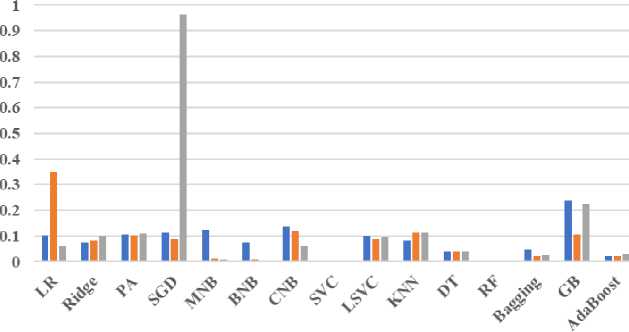
Fig.4. Standard deviation (SD) of ML algorithms for BoW, TF-IDF and hashing vectorizers
As demonstrated in “Fig. 3.”, the measured mean accuracy falls in the range of 0.4 to 0.6 for considered classifiers using BoW, TF-IDF and Hashing vectorizers. Only GB reported mean accuracy less than 0.40 using BoW vectorizer. On the contrary, LR with BoW, PA, CNB and LSVC with TF-IDF achieved more than 60% mean accuracy. LSVC combined with TF-IDF scored top with mean accuracy of 0.664 i.e., 66.4%. Therefore, LSVC combined with TF-IDF vectorizer is the best combination in terms of k-fold cross validation mean accuracy.
“Fig. 4.” depicted the standard deviation of the cross-validation results; the measure indicates how much the distribution of the values scatters around the mean value. Low standard deviation means data are clustered around the mean, and high standard deviation indicates data are more spread out. Hence, the model which reports lower standard deviation is good for NFRs classification problem.
It is possible to observe a good standard deviation shown by vectorizers except SGD using Hashing and LR using TF-IDF. The SGD using hashing reports standard deviation with a value 0.965 which is the worst case in this case. The SGD is followed by LR using TF-IDF with a value of 0.35. Both the cases are uncommon in this experiment; therefore, these can be considered as outlier, and needed to investigate more. However, standard deviation is less than 0.2 for most of the cases, which means that the mean accuracies are clustered around the center value. This is the indication of model consistency and can classify requirements consistently.
6. Discussion
This section discussed the analyzed results for ML algorithms and vectorization techniques in order to answer the
RQs, which are described below.
6.1. RQ1. Which Vectorization Strategy Performs Best (BoW vs. TF-IDF vs. Hashing vs Chi Squared) for Classifying Non-Functional Requirements?
6.2. RQ2. Which combination of ML Classifier and Vectorizer Provides the Best Performance for the Non-functional Requirements Classification Task?
7. Threats to Validity7.1. External Threats
According to the findings of BoW, TF-IDF, Hashing and Chi Squared vectorizers for fifteen ML classifiers, Chi Squared performed worst. The BoW reports the average score as 0.660, 0.660 and 0.527 for accuracy, precision and recall respectively. Where the TF-IDF measured as 0.667, 0.667, 0.539 for accuracy, precision and recall respectively. The average evaluated score of BoW and TF-IDF is same except fractional difference, and performed best compared to Hashing and Chi Squared vectorizers. The score of Hashing is followed by BoW and TF-IDF for this classification task.
Both BoW and TF-IDF are the better feature extraction techniques than Hashing and Chi Squared for NFRs classification problem.
As demonstrated in Table 2, the LSVC algorithm and TF-IDF vectorizer achieved the highest accuracy score i.e., 0.815. In terms of precision evaluation metric, the PA and LSVC combined with TF-IDF scored 0.815 which is the highest among other obtained results. In case of recall, RF reported 0.957 using TF-IDF; the uppermost over the results. However, RF achieved very poor scores for Hashing (0.091) and Chi Squared (0.135). In opposite, the PA, SGD and LSVC achieved higher recall scores compared to other classifiers using BoW, TF-IDF and Hashing. The average scores of PA, SGD and LSVC are 0.692, 0.625 and 0.620 respectively. So, these three algorithms are best for NFRS classification when considering recall measures.
According to the findings of “Fig. 2.”, the highest performers in terms of F1-score are SGD and LSVC algorithms when using TF-IDF vectorization. Where, the max score of SGD and LSVC is 0.803 and 0.815 respectively. Even though both secured more than 80% F1-score, the LSVC positioned top of SGD. Therefore, LSVC and TF-IDF is the best combination for NFRs classification by means of F1-score measuring. The “Fig. 3.” of cross validation mean accuracy, revealed that LSVC combined with TF-IDF performed best with a score of 0.664 i.e., 66.4%. In addition, this classifier reports moderate standard deviation as 0.1, 0.08, 0.09 for BoW, TF-IDF and Hashing vectorizations respectively, which is depicted in “Fig. 4.”.
Out of the investigated accuracy, precision, recall, F1-score, mean accuracy, and standard deviation metrics, the LSVC combined with TF-IDF performed best for most of the cases in this study. Therefore, it is possible to conclude that, the LSVC and TF-IDF is the good combination for non-functional requirements classification.
The limitations and threats to validate this work and how these threats were partially mitigated during the conduct of this research are discussed in this section.
A threat to external validity exists due to the dataset used in this research, which is not large and it is formed as an outcome of different course work projects and might have different properties than real projects. Although, a very few software requirements data are publicly available to study, the PROMISE dataset [35] has been used by researchers [2, 11, 13, 14]. We have used the PROMISE dataset here for the experiments. More analysis with large dataset can contribute to the purpose. In future we will explore the ways to mitigate the unbalance dataset problem, being able to improve the classification with small training dataset.
7.2. Internal Threats
8. Conclusions
The model validation procedure concerns the reliability of the study, i.e., the research conducted will produce the same results as other researchers who replicate the study. The reliability of this research is related to the technique applied to perform the non-functional requirements classification. This research considers cross validation over the models including other steps discussed in the experiment section. Thus, this threat has been partially mitigated and it seems unlikely that this research performance measures are less reliable.
In this research, four text vectorization methods are combined with fifteen ML classifiers to categorize requirements into eleven types of non-functional requirements. The performance of these combinations is evaluated using PROMISE_exp dataset. The experimentation is conducted to measure the performance of the trained and tested models in terms of accuracy, precision, recall and F1-score. In addition, mean accuracy and standard deviation is measured to examine the consistency of experimented models. Among vectorization methods, Chi Squared performed the worst, Hashing followed by BoW and TF-IDF. The TF-IDF exhibits the best performance for requirement classification and the reported accuracy, precision and recall is 0.667, 0.667 and 0.539 respectively. On the other hand, the LSVC combined with TF-IDF reports the highest accuracy score as 81.5%. For classification precision, the PA and LSVC are positioned top when using TF-IDF with a value of 0.815. In case of recall, RF reported 0.957 using TF-IDF, the uppermost over the outcomes. However, RF secured a lower recall score when using Hashing and Chi Squared techniques. According to the F1-score, both the SGD and LSVC combined with TF-IDF secured more than 80%. However, the max F1-score of LSVC is 0.815; more than that of SGD. Also, the cross validation mean accuracy revealed that LSVC and TF-IDF outperformed scoring 66.4%. In addition, standard deviation of LSVC and TF-IDF is 0.08, which indicates the model’s good classification consistency. It is concluded that the LSVC algorithm and TF-IDF vectorization technique is the best combination for non-functional requirements classification. In future, this research can be extended on a large-scale real-life software requirements dataset to get the more precise view of nonfunctional requirements classification.
Conflict of Interest
The authors declare no conflict of interest.
References Non-Functional Requirements Classification Using Machine Learning Algorithms
- Hussain I, Kosseim L, Ormandjieva O. Using linguistic knowledge to classify non-functional requirements in SRS documents. In International Conference on Application of Natural Language to Information Systems 2008 Jun 24 (pp. 287-298). Springer, Berlin, Heidelberg.
- Tabassum MR, Siddik MS, Shoyaib M, Khaled SM. Determining interdependency among non-functional requirements to reduce conflict. In2014 International Conference on Informatics, Electronics & Vision (ICIEV) 2014 May 23 (pp. 1-6). IEEE.
- Kurtanović Z, Maalej W. Automatically classifying functional and non-functional requirements using supervised machine learning. In 2017 IEEE 25th International Requirements Engineering Conference (RE) 2017 Sep 4 (pp. 490-495). IEEE.
- Doerr J, Kerkow D, Koenig T, Olsson T, Suzuki T. Non-functional requirements in industry-three case studies adopting an experience-based NFR method. In13th IEEE International Conference on Requirements Engineering (RE'05) 2005 Aug 29 (pp. 373-382). IEEE.
- Rahman MA, Haque MA, Tawhid MN, Siddik MS. Classifying non-functional requirements using RNN variants for quality software development. InProceedings of the 3rd ACM SIGSOFT International Workshop on Machine Learning Techniques for Software Quality Evaluation 2019 Aug 27 (pp. 25-30).
- Kumar L, Baldwa S, Jambavalikar SM, Murthy LB, Krishna A. Software functional and non-function requirement classification using word-embedding. InAdvanced Information Networking and Applications: Proceedings of the 36th International Conference on Advanced Information Networking and Applications (AINA-2022), Volume 2 2022 Mar 31 (pp. 167-179). Cham: Springer International Publishing.
- Cleland-Huang J, Settimi R, Zou X, Solc P. The detection and classification of non-functional requirements with application to early aspects. In14th IEEE International Requirements Engineering Conference (RE'06) 2006 Sep 11 (pp. 39-48). IEEE.
- Cleland-Huang J, Settimi R, Zou X, Solc P. Automated classification of non-functional requirements. Requirements engineering. 2007 Apr;12(2):103-20.
- Slankas J, Williams L. Automated extraction of non-functional requirements in available documentation. In 2013 1st International workshop on natural language analysis in software engineering (NaturaLiSE) 2013 May 25 (pp. 9-16). IEEE.
- Casamayor A, Godoy D, Campo M. Identification of non-functional requirements in textual specifications: A semi-supervised learning approach. Information and Software Technology. 2010 Apr 1;52(4):436-45.
- Mahmoud A, Williams G. Detecting, classifying, and tracing non-functional software requirements. Requirements Engineering. 2016 Sep;21(3):357-81.
- Lu M, Liang P. Automatic classification of non-functional requirements from augmented app user reviews. In Proceedings of the 21st International Conference on Evaluation and Assessment in Software Engineering 2017 Jun 15 (pp. 344-353).
- Amasaki S, Leelaprute P. The effects of vectorization methods on non-functional requirements classification. In 2018 44th Euromicro Conference on Software Engineering and Advanced Applications (SEAA) 2018 Aug 29 (pp. 175-182). IEEE.
- Li LF, Jin-An NC, Kasirun ZM, Chua YP. An Empirical comparison of machine learning algorithms for classification of software requirements. International Journal of Advanced Computer Science and Applications. 2019;10(11).
- Dias Canedo E, Cordeiro Mendes B. Software requirements classification using machine learning algorithms. Entropy. 2020 Sep 21;22(9):1057.
- Abad ZS, Karras O, Ghazi P, Glinz M, Ruhe G, Schneider K. What works better? a study of classifying requirements. In 2017 IEEE 25th International Requirements Engineering Conference (RE) 2017 Sep 4 (pp. 496-501). IEEE.
- Lima M, Valle V, Costa E, Lira F, Gadelha B. Software engineering repositories: expanding the promise database. In Proceedings of the XXXIII Brazilian Symposium on Software Engineering 2019 Sep 23 (pp. 427-436).
- Haque MA, Rahman MA, Siddik MS. Non-functional requirements classification with feature extraction and machine learning: An empirical study. In2019 1st International Conference on Advances in Science, Engineering and Robotics Technology (ICASERT) 2019 May 3 (pp. 1-5). IEEE.
- Sharma VS, Ramnani RR, Sengupta S. A framework for identifying and analyzing non-functional requirements from text. In Proceedings of the 4th international workshop on twin peaks of requirements and architecture 2014 Jun 1 (pp. 1-8).
- Sarkar D. Text analytics with python. New York, NY, USA: Apress; 2016.
- Bengfort B, Bilbro R, Ojeda T. Applied text analysis with python: Enabling language-aware data products with machine learning. " O'Reilly Media, Inc."; 2018 Jun 11.
- Forman G. An extensive empirical study of feature selection metrics for text classification. J. Mach. Learn. Res. 2003 Mar 3;3(Mar):1289-305.
- Cox DR. Two further applications of a model for binary regression. Biometrika. 1958 Dec 1;45(3/4):562-5.
- He J, Ding L, Jiang L, Ma L. Kernel ridge regression classification. In2014 International Joint Conference on Neural Networks (IJCNN) 2014 Jul 6 (pp. 2263-2267). IEEE.
- Crammer K, Dekel O, Keshet J, Shalev-Shwartz S, Singer Y. Online passive aggressive algorithms.
- Zhang T. Solving large scale linear prediction problems using stochastic gradient descent algorithms. In Proceedings of the twenty-first international conference on Machine learning 2004 Jul 4 (p. 116).
- Domingos P, Pazzani M. On the optimality of the simple Bayesian classifier under zero-one loss. Machine learning. 1997 Nov;29(2):103-30.
- Cortes C, Vapnik V. Support-vector networks. Machine learning. 1995 Sep;20(3):273-97.
- Kotsiantis SB, Zaharakis I, Pintelas P. Supervised machine learning: A review of classification techniques. Emerging artificial intelligence applications in computer engineering. 2007 Jun 10;160(1):3-24.
- Apté C, Damerau F, Weiss SM. Automated learning of decision rules for text categorization. ACM Transactions on Information Systems (TOIS). 1994 Jul 1;12(3):233-51.
- Breiman L. Random forests. Machine learning. 2001 Oct;45(1):5-32.
- Quinlan JR. Bagging, boosting, and C4. 5. InAaai/Iaai, vol. 1 1996 Aug 4 (pp. 725-730).
- Friedman JH. Greedy function approximation: a gradient boosting machine. Annals of statistics. 2001 Oct 1:1189-232.
- Freund Y, Schapire R, Abe N. A short introduction to boosting. Journal-Japanese Society for Artificial Intelligence. 1999 Sep 1;14(771-780):1612.
- Iqbal T, Elahidoost P, Lucio L. A bird's eye view on requirements engineering and machine learning. In2018 25th Asia-Pacific Software Engineering Conference (APSEC) 2018 Dec 4 (pp. 11-20). IEEE.
