Optimization of System's Performance with Kernel Tracing by Cohort Intelligence
Автор: Aniket B. Tate, Laxmi A. Bewoor
Журнал: International Journal of Information Technology and Computer Science(IJITCS) @ijitcs
Статья в выпуске: 6 Vol. 9, 2017 года.
Бесплатный доступ
Linux tracing tools are used to record the events running in the background on the system. But these tools lack to analyze the log data. In the field of Artificial Intelligence Cohort Intelligence (CI) is recently proposed technique, which works on the principle of self-learning within a cohort. This paper presents an approach to optimize the performance of the system by tracing the system, then extract the information from trace data and pass it to cohort intelligence algorithm. The output of cohort intelligence algorithm shows, how the load of the system should be balanced to optimize the performance.
Kernel Trace, Linux Tracing Tool Next Generation (LTTng), Metaheuristics, Cohort Intelligence
Короткий адрес: https://sciup.org/15012657
IDR: 15012657
Текст научной статьи Optimization of System's Performance with Kernel Tracing by Cohort Intelligence
Published Online June 2017 in MECS
Kernel is the black box of the operating system which handles the system resources like Memory, Input Output, CPU time etc. Observing system and understanding what is happening inside the operating system is the important aspect to optimize the system performance. Kernel tracing facilitates to demonstrate various activities running inside the Operating System. Kernel tracing is the activity of listing down, which OS process is using which system resources at what time. There are various tools available to trace down kernel activities like LTT, LTTng, DTrace, FTrace etc. these tracing tools provides details about processes running in the background and their resource uses. This traced information can assist performance optimization of operating system. These tracing tools provide details about process and resources they use but lack to analyze log data and extract knowledge from it. [1] Another approach to improve the system’s performance is to optimize the scheduler. Scheduler is one of the major components which affect system performance largely. The aim of the scheduling is to share the resources by a number of processes. Scheduling is central to an Operating-system’s design and constitutes an important topic in the computer science curriculum. Heuristics like Genetic Algorithm (GA) [2][3], Ant Colony Optimization (ACO) [4][5] have been implemented on the scheduler to optimize system performance like maximize resource utilization, minimal execution time etc. which shows better results. While scheduling a process on one of the cores, the scheduler considers the average waiting time, turnaround time, time quantum for a process, number of context switches, earliness, the tardiness of process etc. But the scheduler does not take CPU load into consideration. As a result of this, the cores get unevenly loaded and many of the cores will be kept in ideal state. Cohort Intelligence (CI) is recently introduced meta-heuristics [6][7] it works on self-supervised learning behavior in a cohort. Cohort refers to a group of candidates which communicate with each other to achieve the common goal of the cohort by improving individual’s behavior. In the cohort, every candidate observes every other candidate and tries to adopt a new behavior. Each candidate must follow other candidate or itself in the cohort, which results in improvement of behaviors of the candidate. In this way, every candidate helps in improving the cohort’s behavior. The cohort is considered to be saturated if the behavior of candidate within adjacent iterations is nearly equal, a maximum number of iterations occur [6][7].
This paper proposes an approach to use the LTTng 2.7 tool for tracing out the kernel (Ubuntu12), analyze the trace data and pass CPU load information to CI algorithm. CI algorithm works on that data and gives a set of cores as an output to reschedule the processes. Finally, a simulation is shown how to migrate process on core or set of cores to balance system’s load.
The remainder of this paper is organized as follows. Section II covers literature survey regarding kernel tracing, system optimization techniques, and cohort intelligence. In section III, steps to trace Linux system (Ubuntu12) are listed. Section IV gives an overview of system architecture. Section V gives flow chart of CI algorithm and explanation of how CI is used in the proposed system. Section VI shows a mathematical model of proposed system. The result and analysis of the proposed system are presented in section VII. The concluding remark is presented in section VIII of the paper.
-
II. Related Work
Anderson et al. [1] suggested software performance optimization methodology. Scheduling solutions based on data mining. Parameters considered for optimization throughout the paper are response time, throughput, scalability, waiting time, turnaround time, and resource utilization. They studied system performance by two methods (1) Experimentation (2) Analytical modeling. The paper suggested the optimization in various fields: The work suggests a solution for (1) Distributed system (2) Single processor (3) Symmetric multiprocessing system 4.Asummetric multiprocessing system. The work shows resource scheduling with machine learning, schedule java thread to minimize garbage collection and synchronization, trace data used to find patterns and analyze them, optimization of e-commerce websites, finding frequent patterns on trace data to detect bugs, capturing semantics of data, machine learning to recognize workload and to select appropriate disk scheduling policy, GA library developed in kernel to tune various part of kernel, dynamic customization of system, self-tuning of kernel activities, tests to recognize correlation between OS performance and scheduling parameters, decompose workload and again reallocate jobs to machines, manipulating threads priority, core to core data transmission with low cost, scheduling algorithm which calculate number of events and match it with expected performance ratio, queue is used to add jobs from one end and delete on another end; if no job is found in queue that queues extract job from another queue.
Bhulli [8] introduced a framework for trace kernel activities, the framework is named KTrace, Paper survey represent Strace, the Linux kernel debugger, Dtrace. Strace tool provides the complete picture about system calls and the signal received between user mode and kernel mode. The disadvantage of Strace is that it is limited to system calls and signal behavior of the system. The Linux kernel debugger is a direct way to analyze Linux kernel. The disadvantage of this tool is it needs external breakpoint to observe kernel memory and data structure. Dtrace is used for Solaris OS and works well for Solaris kernel. The disadvantage of Dtrace is it cannot be directly used to trace Linux kernel because of different Linux and Solaris kernel. The paper introduces complete working of Strace and Dtrace. The paper presents a design of kernel module with a list of events and variables to be considered. The buffer tracing criteria, methods to access buffer to trace the logs. At the end, they provide results of Ktrace and compared with Strace, with one tracing application. In future scope, they suggested that the number of events and variables can be increased for total kernel trace.
LaRosa et al. [9] presented system architecture for kernel tracing. The new concept of window slicing and window folding is introduced to find frequent patterns item set. The paper used LTT tool to trace kernel and system calls. For log analysis, they used MAFIA algorithm, with data preprocessing tool and maximal frequent item set (MFI) mining. They took trace with the isolated environment (no user activity), with the noisy environment (user activity). Then they took two traces with similar circumstances. They used minimal support concept between 0.1 to 0.9. They created items based on (1) present in the single item set (2) present in multiple items set (3) present with interference (4) not present. The results are calculated based on (1) varying fold-slice window time (2) Varying support value (3) minimal support decides the quality of results. The literature work includes papers for intrusion detection, bugs, and malware detection. The future work suggests that stream mining of frequent item set. Identify any loss because of window slicing and Performance improvement by data filtering methods.
Kaur et al. [3] proposed an optimization of execution time and penalty cost of processes with a common deadline on a single processor. The paper calculates earliness and tardiness to calculate the penalty. They have used 3 processes with deadline length 12. The paper has presented 6 orders of scheduling and calculated earliness and tardiness of each process. The paper used GA with initial population size 20, roulette wheel selection, two point crossover and 0.05 mutation rate. Results show GA gives less execution time than other heuristics.
Punhani et al. [10] proposed GA to optimize CPU scheduling based on two objectives (1) waiting time (2) execution time with priority. Authors have used two fitness functions to represent low average waiting time and priority of jobs. GA is used to find a good solution, delete bad solution and make a copy of good solution. Rank based selection is used with two point crossover. GA parameters used in the paper are population size: 10, generation count: 10, the probability of crossover: 0.8, the probability of mutation: 0.2.They used NSGA-II to show results for 10 cases for 5 processes. Paper presents pseudo-code for NSGA-II algorithm. Results are compared with SJF and priority scheduling. The author suggested that starvation should be taken into consideration as future scope.
Maktum et al. [2] proposed GA for processor scheduling based on average waiting time. The authors have used fitness function to represent average waiting time. Number of waiting processes to the total number of processes. Chromosomes of size 5 are taken which represents set of processes. Crossover of a single point and mutation rate is 0.005 is considered. 10 cases are taken and compare with FCFS and SJF. The graphical representation is given for a set of processes against average waiting time. Future scope suggests considering turnaround time and context switch.
Yasin et al. [11] suggested a technique to RR so that waiting time, turnaround time, and context switches get minimized. The scheduling algorithm depends on following selection criteria (1) Fairness (2) CPU Utilization (3) Throughput (4) Response Time (5) Waiting Time (6) Turnaround Time (7) Context Switch. The algorithm works with priority. They have presented Flow Chart of Prioritized Fair Round Robin (FPRR) algorithm along with its step by step explanation. The assumptions are it is a single processor, overhead is solved by considering a priority and burst time of the process. Results are compared with RR, IRRVQ, and
Priority RR. The conclusion suggests that the proposed algorithm is good for time sharing system.
Kotecha et al. [5] presented a combination of two algorithms called EDF and ACO for scheduling. When the system is underloaded EDF is used, and when the system is overloaded ACO is used. Switching occurs at run time. The adaptive algorithm is compared with EDF and ACO by success ratio and effective CPU uses with 10 cases. Load at a particular time is calculated by the sum of the execution time of task to the total period of tasks. The success ratio is total scheduled jobs to the total arrived jobs.
Kulkarni et al. [6] proposed a self-supervised algorithm called cohort intelligence. The cohort intelligence algorithm works by observing other candidates in the cohort (cluster) and tries to adapt the behavior of best candidate observed. The paper shows results taken over four functions and these results are compared with Sequential Quadratic Programming (SQP), Chaos-PSO (CPSO), Robust Hybrid PSO (RHPSO) and Linearly Decreasing Weight PSO (LDWPSO).
Vyas et al. [12] presented an approach of load balancing using master-slave model and Berkeley Lab checkpoint and restart toolkit. Migration of process takes place from highly loaded node to lightly loaded node. Master divides the work into tasks and gives it to slaves after executing a process slave write back its output to master. Master now calculates the aggregate result of all slaves. Two algorithms have been used in the paper to migrate pre-emptive and non-pre-emptive process (1) Sender-initiated algorithm (2) Receiver initiated algorithm. In sender initiated algorithm highly loaded node tries to send its process to another node. In receiver initiated algorithm lightly loaded node tries to receive process from an overloaded node. Process migration is done by transferring address space and state of the process. The paper present an approach for migration as client submit process on the master node (server), master start execution of process without calculating memory and processing power if memory or power is insufficient then master transfer that process to slave. Memory and processing power of slave are known to master in advance. Selection of slave is based on Round Robin technique. Another technique is if the master is not having enough memory for process then it perform checkpoint using BLCR mechanism. Once the checkpoint is created process is transferred to the available node via file transfer mechanism. Then slave start execution of the process using BLCR mechanism and Multithreading.
Vallee et al. [13] worked on process virtualization using kernel service called ghost process. The ghost process mechanism has been implemented in the KERRIGHED Single System Image (SSI) in cluster operating system. Migration of process is done on the basis of checkpoint and restart. One process creates a ghost process and it handles other tasks. Working of ghost process is to send other processes to the destination node via the network. The paper shows sudo code for process migration, checkpoint and restart, checkpoint and restart for the disk. Checkpoints are put on memory and on the disk. Implementation is done on Kerrighed cluster operating system based on Linux 2.4.24 with 1 GHz processor, 512 RAM, 100Mps Ethernet.
Zarrabi et al. [14] presented dynamic process migration framework in the Linux system to increase compatibility and reduce system overload. The architecture considers 3 steps (1) Checkpoint/ restart subsystem (2) Migration coordinator at source machine (3) Migration daemon at the destination. Checkpoint/restart provides infrastructure for migration. Source coordinator carries out required events to migrate process. The Same process is done by the daemon on the source machine. The architecture shows four main layers as (1) Subsystem-specific layer (2) Transfer medium layer (3) Core system control layer (4) Userspace interface layer. The paper use ioctl system commands to interact with device files. The process is migrated on the basis of the address space. CPU load and memory are continuously monitored while migrating a process.
Mustafa et al. [15] presented an approach to the dynamically checkpointing state of the process, transferring address space of the process, and storing the data on hard disk. The paper works on the reduction of hard disk access time to transfer address space between machines in distributed environment. Read privileges are given to destination system. The paper shows read mechanism in between two machines. The migration of process takes place in three phases (1) Detecting phase (2) Transfer phase (3) Attaching phase. Algorithmic steps to carry out migration of process are presented in the paper. The migration model in the paper works on source and destination architecture. The synthesized literature motivated us to perform kernel trace on ubuntu12 and apply metaheuristic to optimize the performance of the system by (1) Maximizing the CPU utilization (2) Determining the optimal set of cores to run processes.
-
III. Kernel Trace
Kernel tracing is the record of activities running inside the operating system at the particular time. Many tools are available to successfully trace kernel but they don’t analyze the system. LTTng is latest among all tools. LTTng tracing is the first part of this paperwork after that the trace is analyzed and passed to CI for suggesting near optimal solution.
LTTng is an open source tracing framework for Linux. This tracing tool provides details about processes running on the system.
To use LTTng on Ubuntu following packages needs to be installed on the system:
-
A. LTTng-tools: libraries and command line interface to control tracing sessions.
-
B. LTTng-modules: Linux kernel modules for tracing the kernel
-
C. LTTng-UST: user space tracing library
-
1. LTTng installation steps:
-
• sudo apt-add-repository ppa:lttng/ppa
-
• sudo apt-get update
-
• sudo apt-get install lttng-tools
-
• sudo apt-get install lttng-modules-dkms
-
• sudo apt-get install liblttng-ust-dev
-
2. Linux kernel tracing steps:
-
• Create a session:
sudo lttng create
-
• Enable some/all events for this session:
sudo lttng enable-event –kernel sched_switch,sched_process_fork OR sudo lttng enable-event --kernel –all
-
• Start tracing:
sudo lttng start
-
• To stop tracing:
-
3. Install babeltrace as:
sudo lttng stop
-
• sudo apt-add-repository ppa:lttng/ppa
-
• sudo apt-get update
-
• sudo apt-get install babeltrace
-
4. View trace:
-
• babeltrace ~/lttng-traces/my-session1
-
IV. System Architecture
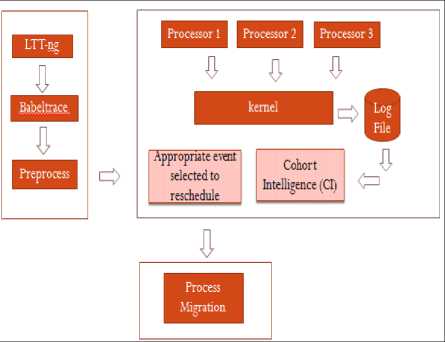
Fig.1. System Architecture
Fig.1 shows three separate modules of system architecture. In the first module, the system (Ubuntu12) is traced with the LTTng 2.7 tool using commands shown in section III. After tracing the system (Ubuntu12) the traced data is converted into a readable format by babeltrace and log file is generated. The next step is to preprocess the log file to extract useful information. In preprocessing, tokens are generated from trace file and separate text files are created for each core. Then based on the value of core each process data is stored in a respective text file. These text files will be referred at the time of process migration from one core to another core. The second module shows the application of CI algorithm on the traced data. CI takes core load and priority as initial input and generates candidates from initial data.
The third module is the migration of CPU intensive processes based on the output of CI algorithm in the previous module.
-
V. Cohort Intelligence
CI is a metaheuristic that works on self-supervised learning approach in the cohort. In CI candidates communicate with each other to achieve the common goal. Every candidate improves its behavior by observing other candidates in the cohort. Candidates improve their behavior by partly or fully absorbing behavior of the other candidates. Fig.2 shows the working of CI[6][7] for proposed system. The first procedure to apply the algorithm is to initialize the number of candidates in the cohort, the reduction factor (r), the number of iterations (I), variations in candidates (t). The next step is to calculate probability associated with each candidate using probability formula. After calculating the probability roulette wheel is applied to select the following candidates. Each candidate observes the best candidate in the cohort and tries to follow the best candidate. The next step is to recalculate the upper bound and lower bound associated with iteration. Each time the range of bound get decreased. Iterate the procedure till a maximum number of iterations occurs. The final output of CI is the set of cores which are the near optimal solution to migrate the processes.
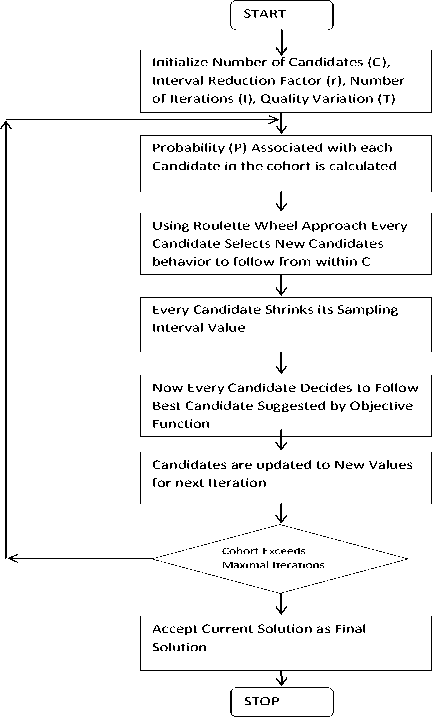
Fig.2. Cohort Intelligence Flow Chart
The proposed system uses four cores as starting objects. Each object is represented as core load and priority value. From these four cores, we have created eleven candidates as initial population. The probability of each candidate is calculated using probability formula.
р е = *f^
2 С =1 /р(х е )
Then fitness value of each candidate is calculated and overall cumulative fitness value is calculated, this cumulative fitness value lies in between 1 to 0.99. The next step is to allocate the space for each candidate on the roulette wheel. Then a set of followers and followee is generated using random function. Then for each follower, a random followee is selected. This will generate eleven set of new followers and followee. Now the follower will take followee’s values (behavior). The next step is to calculate upper bound and lower bound for each candidate. The proposed system has upper bound as 8 and lower bound as -8. Up to this stage, we get old candidate set and newly formed candidate set and new bound limits. Next step is to iterate the same above procedure up 100 iterations. In each iteration, the limit of bounds gets reduced so that the values of the solution will be saturated at a point. This is considered to be near optimal solution. The final solution from CI is the set of cores which will be near optimal to run the processes with the optimal use of cores at a time.
-
VI. Mathematical Model
-
4. Every candidate shrinks the sampling interval
Consider f(x) as the behavior of an individual candidate in the cohort, which it tries to improve by modifying the associated set of features x = (xvx 2 ,, x))
Consider a cohort with number of candidates C, every individual candidate c( c — l,,.,C ) belongs a set of characteristic xc — (x^x ^ ,, x)) which makes the overall quality of its behavior f (xc) . The individual behavior of each candidate c is generally being observed by itself and every other candidate ( c ) in the cohort. This naturally urges every candidate c to follow the behavior better than its current behavior.
X-[?] — [x^x??],... x?]
Vc[ ? ] for every feature x ^ 1 ']
-
a) t^M^H
-
5. Each candidate samples t qualities from updated sampling interval Vc[ ? ] for every its feature l?] and compute a set of associated t behaviors
V — (||VII)*r
b) Roulette Wheel

a) Fc,£ — [f(X)c 1 ,f (X)2,, f(X)£]
Select the best behavior f* (x c) from Fc' £
-
b) Updated behavior set
-
6. Accept any of the behaviors from updated behavior set and stop if maximum iteration occurs else continue to step 2.
Fc — [f *(X1), f*(X2),, f*(Xc)]
-
VII. Result and Discussion
Fig.3 shows the output of kernel trace data using LTTng 2.7 tool on Ubuntu12. To trace the kernel, commands shown in section III have been used. Three libraries are installed to use LTTng 2.7 tool. To trace the kernel, the session is created then process fork and schedule switch these two events are traced. To start tracing start command is used after few seconds stop command is run to stop tracing. Then to view the traced data in readable format babeltrace is installed using commands shown in section III. Babeltrace is a trace viewer and converter reading and writing then common trace format (CTF). Its main use is to pretty-print CTF traces into a human-readable text output ordered by time.Then the path of traced data is given to babeltrace. The output shows time of the trace, name of the process, PID of the process, state of the process, next command to run, PID of next command etc.
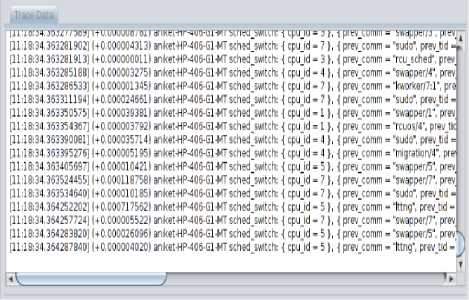
Fig.3. Kernel Trace
Cohort Intelligence is applied to a set of cores to determine near optimal set of cores to run the processes so that all cores will near equally be balanced. Fig.4 shows, core load and core priority are the initial input taken by CI. Based on this input the CI generates eleven candidates and then these eleven candidates look into one another behaviors to find near optimal solution. Roulette wheel is applied to find the next following candidate. Each candidate follows other candidate or itself. At each iteration, the values of the candidates get updated. At each iteration, the bound limits are calculated for each candidate and this limit range is degraded at every iteration so that after every iteration the solution gets saturated. Total 100 iterations are generated to find a final solution which is shown in Fig.5, this shows the near optimal set of cores to run the processes.
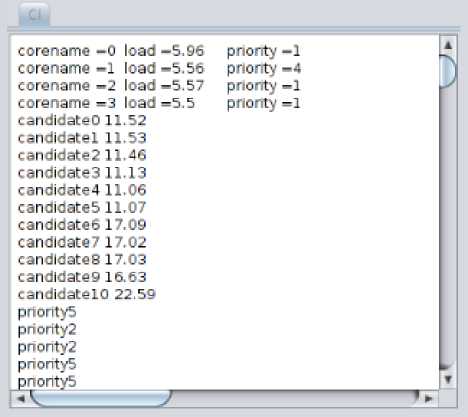
Fig.4. Cohort Intelligence
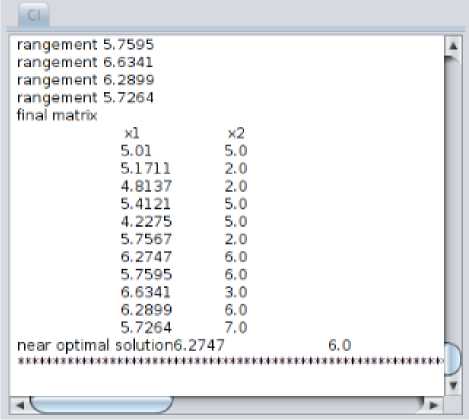
Fig.5. Cohort Intelligence Output
Table 1 shows an overall explanation of the CI working. The affinity of the process is the number of cores on which the process is running. Initially affinity bit for all processes is zero to seven. This means all processes can run on any core (core 0 to core 7) at any time. Table 1 shows initial load on core 0, core 1, core 2 and core 3. L is the load on the core and P is the priority assigned to that core by CI algorithm. Table 1 shows that core 0 has load 5.96 and priority 1, core 1 has load 5.56 and priority 4, core 2 has load 5.57 and priority 1, core 3 has load 5.5 and priority 1. After applying the CI algorithm with initial load and priority the output of CI suggest that the processes on the cores 0, 1 and 2 need to be migrated within each other to utilize the cores optimally by balancing the load on cores 0, 1 and 2.
Fig.6 shows a graphical representation of core values suggested by CI in each iteration. Fig.6. show that core 0 is heavily loaded as compared to rest of the cores. The final solution suggested by CI at 100th iteration is to migrate processes on cores 0, core 1 and core 2. As graph shows, core 0 is heavily loaded and core 2 is lightly loaded.
Fig.7 shows tokens generated from the trace file. This token file shows attributes of processes like cpuid, tid, state, priority etc. Using this token file the separate text files are generated named as core0, core1, core2 etc. as represented in Table 2 with their file sizes. Each text file will represent all the processes running on that core. These text files will be used in the step of process migration.
Table 1. CI Output
|
Initial Affinity (Cores) |
CI Input |
Affinity Suggested by CI (Cores) |
|||||||
|
Core0 |
Core1 |
Core2 |
Core3 |
||||||
|
L |
P |
L |
P |
L |
P |
L |
P |
||
|
0-7 |
5.96 |
1 |
5.56 |
4 |
5.57 |
1 |
5.5 |
1 |
0-2 |
Table 2. Core Wise Load Distribution
|
File |
Size (KB) |
|
Core0 |
504 |
|
Core1 |
568 |
|
Core2 |
848 |
|
Core3 |
712 |
|
Core4 |
176 |
|
Core5 |
1184 |
|
Core6 |
80 |
|
Core7 |
168 |
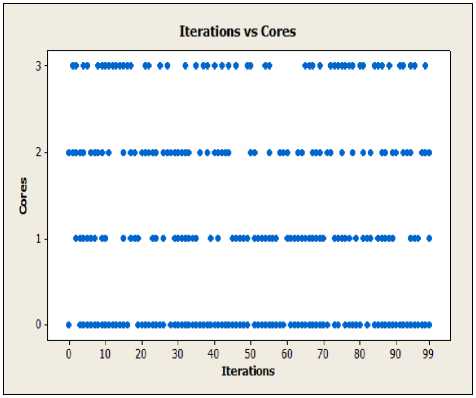
Fig.6. Iterations vs. Cores values
process (PID 2535) the load became 2.36 which is shown in Fig.9. This is how the migration took place within cores.
Output - processmigrace (run) x
H> run:
2535 firefox
LU pid 2535's current affinity list: о
_ pid 2535*s current affinity list: О pid 2535's new affinity list: 1 '.CPU %MEM PSR
9.4 15.9 О
Linux 3.13.0-32-generic (aniket-HP-406-Gl-t
|
06:10:09 06:10:09 06:10:09 |
1ST 1ST 1ST |
CPU all 0 |
"iusr 1.59 2.17 |
4*nice 0.00 0.00 |
4s у s 0.34 0.52 |
|
06:10:09 |
1ST |
- ■ 1 |
0.00 |
0.40 |
|
|
06:10:09 |
1ST |
0.00 |
0.39 |
||
|
06:10:09 |
1ST |
3 |
2.09 |
0.00 |
0.43 |
|
06:10:09 |
1ST |
4 |
1.06 |
0.00 |
0.20 |
|
06:10:09 |
1ST |
5 |
1.00 |
0.00 |
O. 17 |
|
06:10:09 |
1ST |
6 |
0.92 |
0.00 |
0. 17 |
|
06:10:09 |
1ST |
7 |
0.78 |
0.00 |
0. 41 |
BUILD SUCCESSFUL (total time: о seconds)
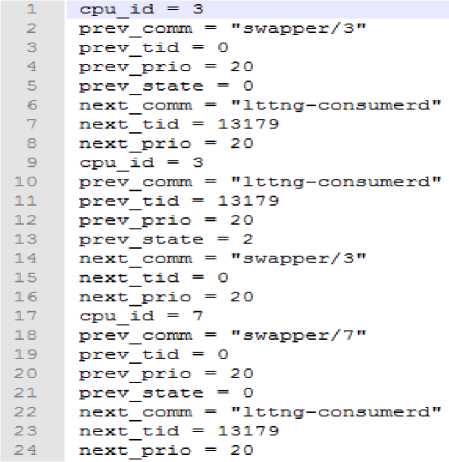
Fig.7. Tokens of Trace File
Fig.8. Process Migration Simulation1
|
Output - processmigrate (run) * |
||||
|
DO DO D Si |
run: 2535 firefox pid 2535's current affinity list: 1 pid 2535*s current affinity list: 1 pid 2535's new affinity list: 2 %CPU ^MB4 PSR 9.4 16.0 1 Linux 3.13.0-32-generic (aniket-HP- |
406-Gl-f |
||
|
06:10:24 06:10:24 06:10:24 |
IST IST IST |
CPU %usr 4nice all 1.60 0.00 2.17 0.00 |
4sys 0.34 0.52 |
|
|
06:10:24 |
IST |
I 0.00 |
0.40 |
|
|
06:10:24 1ST 2 2.38 0.00 06:10:24 1ST 3 2.10 0.00 06:10:24 ist 4 1.06 o.oo 06:10:24 IST 5 1.00 0.00 06:10:24 IST 6 0.92 0.00 06:10:24 IST 7 0.78 0.00 BUILD SUCCESSFUL (total time: О sec |
0.39 0.43 0.20 0.17 0. L8 0.41 onds) |
|||
Fig.9. Process Migration Simulation2
After Applying the CI algorithm the new affinity bit is generated, which shows that the processes on these cores need to be migrated. Fig.8 and Fig.9 show a simulation of process migration. The process named firefox with pid 2535 is initially having affinity bit 0, using Linux command2 we migrated this process to core 1. The Fig.8 shows the load on core 1 was 2.35 and after migration of
-
VIII. Conclusion
The kernel of Linux system (Ubuntu12) is successfully traced using LTTng 2.7 tool and traced data is stored in a text file and analyzed to detect affinity bit value of processes. The CPU load values are passed to CI algorithm which uses self-supervised learning approach to determine near optimal set of cores. Finally, a simulation of process migration is presented which shows effective utilization of cores to optimize the performance of the system.
Acknowledgment
This paper is based on my Post Graduation thesis in Savitribai Phule Pune University, Pune, India. I want to express my sincere gratitude to Professor Anand Kulkarni, Symbiosis Institute, Pune, India for his support.
Список литературы Optimization of System's Performance with Kernel Tracing by Cohort Intelligence
- G. Anderson, T. Marwala, and F. V. Nelwamondo, “Use of Data Mining in Scheduler Optimization,” p. 10, 2010.
- T. A. Maktum, R. A. Dhumal, and L. Ragha, “A Genetic Approach for Processor Scheduling,” in IEEE International Conference on Recent Advances and Innovations in Engineering (ICRAIE), Jaipur, India, 2014, pp. 9–12.
- A. Kaur and B. S. Khehra, “CPU Task Scheduling using Genetic Algorithm,” in IEEE 3rd International Conference onMOOCs, Innovation and Technology in Education (MITE), 2015, no. 2003, pp. 66–71.
- Chiang, Y.-C. Lee, C.-N. Lee, and T.-Y. Chou, “Ant colony optimisation for task matching and scheduling,” Comput. Digit. Tech. IEEE Proc., vol. 153, no. 2, pp. 130–136, 2006.
- K. Kotecha and A. Shah, “Adaptive scheduling algorithm for real-time operating system,” in IEEE Congress on Evolutionary Computation (IEEE World Congress on Computational Intelligence), 2008, pp. 2109–2112.
- A. J. Kulkarni, I. P. Durugkar, and M. Kumar, “Cohort intelligence: A self supervised learning behavior,” in Proceedings - 2013 IEEE International Conference on Systems, Man, and Cybernetics, SMC 2013, 2013, pp. 1396–1400.
- A. J. Kulkarni and H. Shabir, “Solving 0–1 Knapsack Problem using Cohort Intelligence Algorithm,” Int. J. Mach. Learn. Cybern., no. Ci, p. 15, 2014.
- N. Bhulli, “ktrace_dissertation.pdf.”
- C. LaRosa, L. Xiong, and K. Mandelberg, “Frequent pattern mining for kernel trace data,” in Proceedings of the 2008 ACM symposium on Applied computing - SAC ’08, 2008, p. 880.
- S. Punhani, Akash Sumit, Kumar Rama, Chaudhary Avinash Kumar, “A Cpu scheduling based on multi criteria with the help of Evolutionary Algorithm,” in 2nd IEEE International Conference on Parallel, Distributed and Grid Computing, 2012, pp. 730–734.
- A. Yasin, A. Faraz, and S. Rehman, “Prioritized Fair Round Robin Algorithm with Variable Time Quantum,” in 13th International Conference on Frontiers of Information Technology, 2015, pp. 314–319.
- Ravindra A. Vyas, H. H. Maheta, V. K. Dabhi, and H. B. Prajapati, “Load balancing using process migration for linux based distributed system,” in Internationai Conference on Issues and Challenges in Intelligent Computing Techniques (ICICT), 2014, pp. 248–252.
- G. Vallee, R. Lottiaux, D. Margery, C. Morin, and J. Y. Berthou, “Ghost process: A sound basis to implement process duplication, migration and checkpoint/restart in linux clusters,” in 4th International Symposium on Parallel and Distributed Computing, ISPDC, 2005, vol. 2005, pp. 97–104.
- A. Zarrabi, K. Samsudin, and A. Ziaei, “Dynamic process migration framework,” in International Conference of Information and Communication Technology, ICoICT, 2013, pp. 410–415.
- B. A. Mustafa, N. T. Saleh, and A. M. Khidhir, “Process Migration Based on Memory to Memory Mechanism,” in The First International Conference of Electrical, Communication, Computer, Power and Control Engineering ICECCPCE, 2013, p. 5.
- Ahmed F. Ali, “Genetic Local Search Algorithm with Self-Adaptive Population Resizing for Solving Global Optimization Problems,” I.J. Information Engineering and Electronic Business (IJIEEB),2014, vol.6, no.3, pp. 51-63.
- Hedieh Sajedi, Maryam Rabiee, “A Metaheuristic Algorithm for Job Scheduling in Grid Computing,” I.J. Modern Education and Computer Science (IJMECS),2014, vol.6, no.5, pp. 52-59.

