Параметры оптических сигналов на телескопе АЗТ-33ИК, зарегистрированных в активном космическом эксперименте «Радар-Прогресс»

Автор: Еселевич М.В., Хахинов В.В., Клунко Е.В.
Журнал: Солнечно-земная физика @solnechno-zemnaya-fizika
Статья в выпуске: 3 т.2, 2016 года.
Бесплатный доступ
При проведении активного космического эксперимента «Радар-Прогресс» с помощью оптического телескопа АЗТ-33ИК Саянской обсерватории ИСЗФ СО РАН регистрировались изображения транспортных грузовых кораблей серии «Прогресс» и области пространства вокруг них. Во время включения двигательной установки и после ее выключения в процессе продувки топливной системы были получены изображения струй выхлопных газов и топливных струй, сопровождавших эти процессы. В разных сеансах эксперимента ориентация «Прогрессов» относительно телескопа была различной, что позволило определить некоторые параметры наблюдаемых явлений. Полученные параметры позволяют определить момент включения двигательных установок, оценить скорость истечения струй и, при необходимости, контролировать геометрию космического эксперимента. В работе приведены обобщенные характеристики и параметры оптических сигналов от струй, измеренные в данных экспериментах.
Активный космический эксперимент, оптический сигнал, космический аппарат, низкая орбита, телескопические наблюдения
Короткий адрес: https://sciup.org/142103608
IDR: 142103608 | УДК: 550.388.2 | DOI: 10.12737/20494
Текст научной статьи Параметры оптических сигналов на телескопе АЗТ-33ИК, зарегистрированных в активном космическом эксперименте «Радар-Прогресс»
The active space experiment Radar-Progress was aimed first at studying processes in ionospheric plasma caused by controlled ignitions of propulsion systems on board Progress cargo spacecraft (PCS) [Khakhinov et al., 2012, 2013]. In this experiment, ionospheric conditions were largely examined using the Irkutsk Incoherent Scatter Radar (IISR) of the Institute of Solar-Terrestrial Physics of Siberian Branch of the Russian Academy of Sciences (ISTP SB RAS) [Lebedev et al., 2008; Potekhin et al., 2009].
At the same time, engine ignitions can cause other effects that cannot be measured by radars. Therefore, we tried to capture the optical image of PCS during the experiment. The spacecraft moves in a low Earth orbit at 300–400 km. At this distance, we can obtain a sufficiently detailed image of the spacecraft or at least of the area around the spacecraft, which is associated with the exhaust jet from its engines.
Orbit and technical state of a spacecraft are often analyzed using telescopic observations [Korobtsev et al., 2011]. In such measurements, solar emission reflected from the spacecraft is usually registered as being generated by a point source, i.e., we analyze variations in the brightness of the spacecraft.
Special adaptive optical systems provide detailed images of low-orbit spacecraft [Galkin et al., 2008], whereas speckle-interferometry methods together with a sufficiently large instrument allow us to capture images of geostationary orbit spacecraft as well [Aleshin et al., 2011].
In this work, we did not set the goal to take an image of the PCS because it is unattainable with the existing observational facilities. We planned to register the instant of engine ignition, capture images of engine jets, which filled a volume far exceeding sizes of the spacecraft itself, measure parameters of the engine jets, and study their dynamics and interaction with the environment.
These objectives were only partially achieved. The optical signal from the engine jet appeared to be rather weak – at the sensitivity limit of the detection system. A serious limitation was also the dependence on weather conditions. The space experiment sessions lasted less than several minutes, and, although the sessions were planned under assumption of the best visibility from the radar and other observational stations, weather conditions could be far from being ideal then. In some cases, optical images were not captured during the experiment for technical reasons.
Nevertheless, in some successful observation sessions we took optical images of engine jets when the PCS’s engine worked. Equipment and methods used for the optical observations of PCS during the Radar-Progress space experiment sessions are described in [Klunko et al., 2016]. Generalized characteristics and parameters of optical signals from jets measured during these experiment sessions are given in this paper.
TYPES OF OPTICAL SIGNALS
The first optical measurements made during the space experiment have revealed two very different types of optical signals.
In all the space experiment sessions, time was measured from the start of the PCS’s onboard approach correction engine (ACE). Engine running time varied in different sessions and was approximately 7–8 s. Figure 1 presents a sequence of images captured in the wide-field optoelectronic system (parameters of this system are given in [Klunko et al., 2016]) during the ACE start in the observation session on September 01, 2010. Under each of the images is the difference T – T 0 (in seconds) between the instant of exposure beginning and the instant of ACE start. The image of PCS is saturated and looks like a bright spot near the center of the frame. Thin slant lines in the images are tracks of stars. Figure 1 shows that beginning at the instant of ACE start, a very weak optical signal was detected as a low-contrast luminous area above the PCS image. The signal faded rapidly, and the time of registration of this region did not exceed ≈ 1–1.5 s, whereas the engine running time during that observation session was 7.5 s. The start time of the optical signal detection corresponds to the instant of ACE start. The frame exposure beginning in Figure 1 with the first detection of the signal corresponds to T – T 0 = –0.3 s; however, we should take into account that the exposure time is 0.5 s and therefore it is impossible to perform more accurate time synchronization.
Another type of optical signals registered during the Radar-Progress space experiment sessions corresponds to the post-cutoff period. After being cut off, the engines work in the purge mode and unburned fuel particles are ejected from the engine. This process generates a much more intense optical signal – there appears a fairly bright jet extended along the ACE axis (Figure 2). Its shape changes rapidly, and brightness gradually decreases.
Due to the higher brightness of fuel jet, the period of registration of the optical signal from the jet was longer than that received when ACE worked, and in some observation sessions it was 10–20 s.
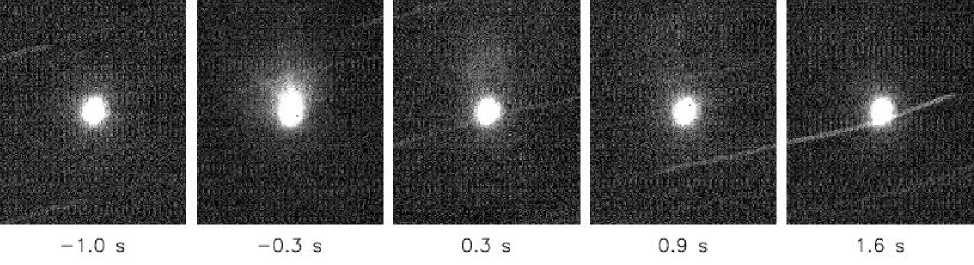
Figure 1 . Optical signal registered when ACE worked (September 01, 2010). Exposure time is 0.5 s
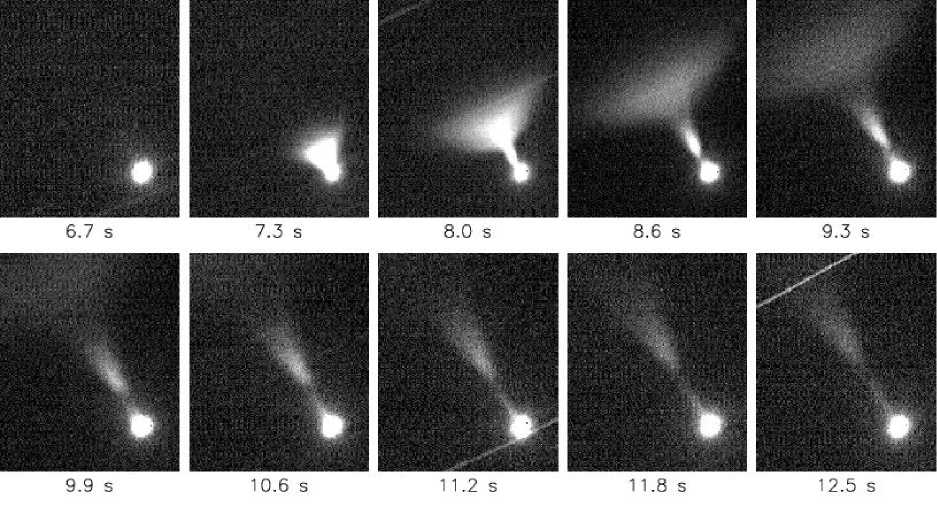
Figure 2 . Optical signal registered during purging process (September 01, 2010). Exposure time is 0.5 s
GEOMETRY OF THE EXPERIMENT
The PCS trajectory relative to the celestial coordinate system is always known from experimental conditions. This allows us to track the spacecraft with the optical telescope at the trajectory section of interest. The mutual arrangement of the optical observation station and the IISR is also known from geographic coordinates of the observatories. All these data enable us to relate the features and details of optical images observable during the experiment to the direction of the apparent velocity of PCS and to directions to other observation stations. Depending on experimental conditions, the mutual orientation of these directions may differ.
Figure 3 (left panel) presents an image of PCS and fuel jet captured during the space experiment on September 02, 2010. Sides of the images taken with the optical telescope are oriented along axes of the celestial coordinate system. The horizontal axis of the images coincides with the direction of change of right ascension α ( α increases leftward in the image); and the vertical axis, with the direction of changes of the declination angle δ that increases upward in the image.
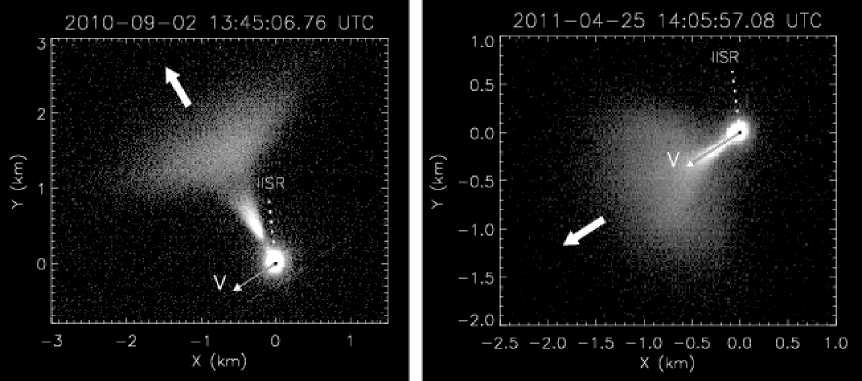
Figure 3 . Geometry of the space experiment on September 02, 2010 (on the left) and April 25, 2011 (on the right) as inferred from optical observations. The vector V depicts the projection of the PCS velocity. The dashed line shows the direction to the IISR; the wide arrow indicates the direction of fuel jet
Given the distance to the PCS and scale of images, we can calculate the linear size (the axes in the figure are given in kilometers). The direction and projection of the PCS velocity on the image plane are indicated in the figure by a vector denoted by V. The length of the vector corresponds to the distance travelled by the PCS in 0.1 s.
At the instant of time pictured in the figure, the PCS velocity was 6.7 km/s. The wide arrow in the figure marks the apparent direction of the fuel jet, and the dashed line shows the direction to the IISR. In the plane of the image, the angle between the direction of the exhaust and the direction to the IISR was 21 ° ; and between the direction of exhaust and velocity direction, 83 ° .
In the space experiment sessions of April 22–26, 2011, the engine worked for breaking. In this case, the jet direction coincided with the direction of the PCS velocity (Figure 3, on the right). Thus, by registering the direction of fuel jet in the image and knowing the PCS orbit relative to the observation stations, we can control geometry of the experiment as a whole.
FEATURES OF THE OPTICAL SIGNAL FROM ACE START
Observations of the PCS with the AZT-33IK optical telescope during the space experiment sessions have revealed optical phenomena caused by ACE running. They look like low-contrast bursts (cloud) appearing at the moment of ACE start and disappearing in 1–2 s. Typical examples of registration of ACE starts are given in Figure 4.
These images were taken in the wide-field optoelectronic system [Klunko et al., 2016] with 0.5 s exposure. Due to design features of the lens and camera of the system, the PCS (the bright saturated spot in the center of the frame) gives a small halo in its vicinity. This can be seen in brightness isolines (white dashes). Isolines denote brightness levels slightly exceeding the background brightness level – by 0.5 and 1.0 from the noise level measured in the background portion of the image. Before ACE start, the shape of the brightness isolines resembles a circle, i.e., there is a symmetrical halo around the PCS. During ACE start, there arises a region with enhanced brightness; this is clearly seen in isolines. In 1–2 s, everything reverts back to the initial state (the last frames in the series).
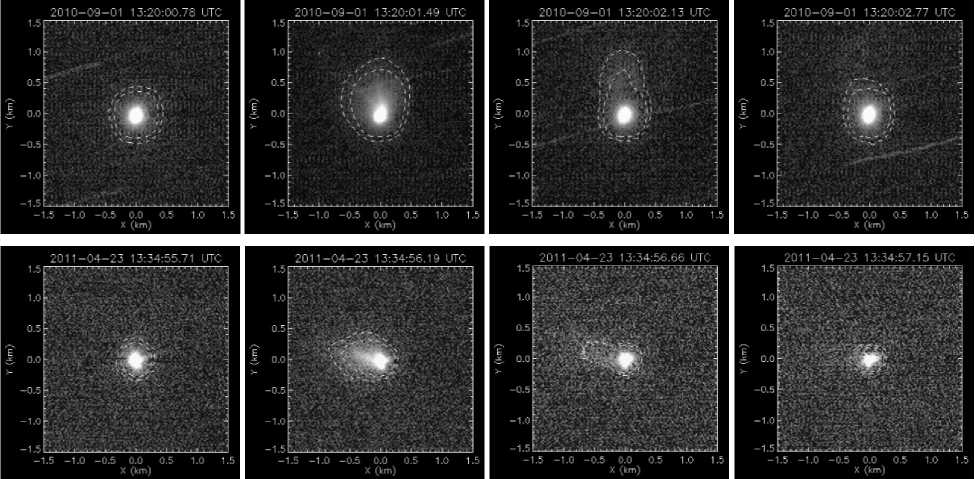
Figure 4. Sequence of images taken on September 01, 2010 (top row) and April 23, 2011 (bottom row). ACE was started at 13:20:01.58 and 13:34:55.5 UTC respectively
In some cases, under favorable experimental conditions, we managed to track some features associated with ACE starts. In the sessions of September 1 and 2, 2010, the orientation of the PCS axis was around 90 ° toward the telescope. Thus, we can measure real sizes and velocities of engine and fuel jets unaffected by projection. In particular, in the image captured on September 01, 2010 at the instant of ACE start, we can distinguish two low-contrast beams situated at an angle of 30 ° (Figure 5, on the left). This angle corresponds to the ACE nozzle angle, and the mean direction of beams is close to the direction of the fuel jet that was observed later.
From the cross-section pictured on the right panel in Figure 5, we can estimate the characteristic size of the outer boundary of the beam – it is about 100 m (from peak to peak). The second beam (the right one on the cross-section) is worse pronounced, but it is possible to establish that the typical size of the beam boundary is also ~100 m. We can assume that these beams trace the boundary of the expanded exhaust jet.
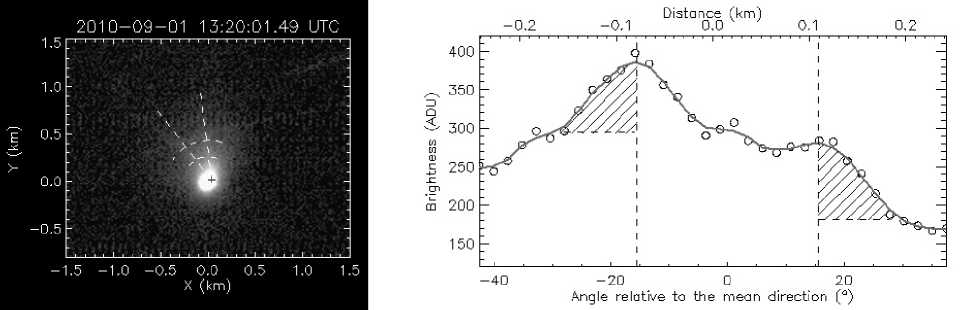
Figure 5 . On the left is the image captured at the instant of the ACE start on September 01, 2010: there are two low-contrast beams at an angle of 30 ° corresponding to the ACE nozzle angle (dashed straight lines). On the right is the azimuthal crosssection of beams (averaging within the range depicted by dashed arcs on the left); outer boundaries of the beams on this crosssection are shown by hatching
A different situation arises when we observe ACE start at a small angle to the direction of the exhaust. For example, on July 27, 2014, the angle between the PCS axis and the direction to the observation station was around 30° at the instant of ACE start (Figure 6).
The images in Figure 6 were taken in the main optoelectronic system of the AZT-33IK telescope [Klunko et al., 2016] with 0.05 s exposure. These images show that after the ACE start at 19:28:16.96, at 19:28:17.32 there appeared a diffuse expanding ring that quickly lost its brightness. We can see traces of the ring up to 19:28:17.70; hence the optical effect lasts approximately one second. Using two moments of time when we can reliably identify the ring boundary, we measured the rate of its expansion (the rate of radius increase): V p « 1.2 km/s. If, during observation along the exhaust axis, we can see an expanding boundary of cone basis with an angle of 30 ° near the vertex (the ACE nozzle angle), then the velocity of the exhaust V can be recalculated from the measured rate of expansion, using V = V p/tg15 ° . Thus we obtain the velocity of the exhaust V « 4.5 km/s.
Figure 7 illustrates a cross-section of the expanding ring. From the cross-section we can determine the typical width of the ring as well as the width of its front boundary (shaded area in the plot), which is ~50 m. Notice that the image was captured with the 0.05 s exposure. At a rate of ring expansion of ~ 1 km/s over the exposure period, the transverse profile of the ring expands by approximately 50 m, i.e., by a quantity of order of the measured width of the ring boundary. Optical measurements can be expected to show the outer boundary of the exhaust from ACE. It stands out in the images because of its increased brightness. The shape of the jet roughly holds the shape of the nozzle, at least in the first seconds of engine running. This allows us (if necessary) to estimate the exhaust gas velocity and to control the operating mode of ACE.
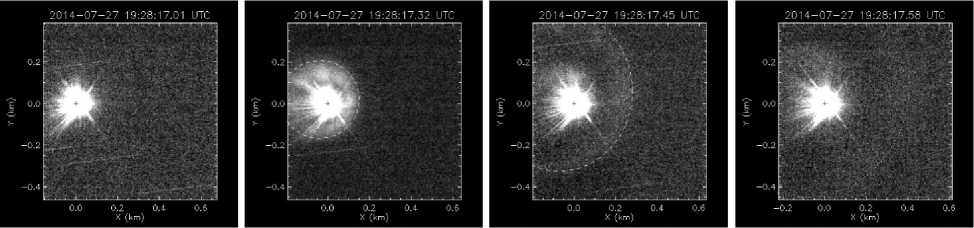
Figure 6. ACE start on July 27, 2014. There is a divergent ring that loses brightness. At 19:28:17.58, it is impossible to reliably determine the boundary of the ring
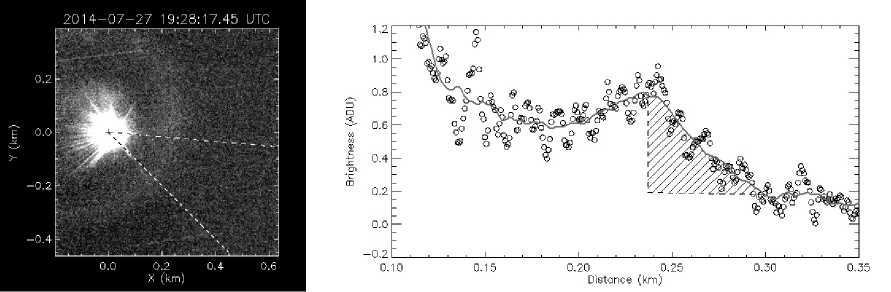
Figure 7. Image (on the left) and cross-section (on the right) of the expanding ring at 19:28:17.45 on July 27, 2014. To reduce noise, we carried out averaging over the sector marked with dashed lines on the left. The region of the front boundary of the ring on the cross-section is shown by hatching on the right
As inferred from the analysis, ACE starts produce a very weak effect on optical images. This is associated both with the weak reflection from the exhaust jet and with the rapidity of this process. The best results during optical observations are obtained from measurements made in the main high-sensitivity optoelectronic system of the AZT-33IK telescope, with short exposures and high frame frequency. Nevertheless, even in this case, we can register an optical signal only in the first 1–2 s after the ACE start.
FEATURES OF THE OPTICAL SIGNAL FROM FUEL JET
During optical observations, the purging process when ACE is cut off proves to be much brighter. In this case, there appears a fairly bright jet extended along the ACE axis. In the jet, we can distinguish two parts (Figure 8). The former, adjacent to the PCS, looks like a narrow cone with ~ 30 ° opening angle. The latter part, adjacent to the former one, is wide, diffuse. It also has the form of a cone but with ~120 ° opening angle.
Both the parts gradually grow in size, with their brightness decreasing. The narrow part, brighter one, remains visible for 10–20 s. Axes of the narrow and diffuse parts can have different directions. It is especially evident in observations at a small angle to the direction of the exhaust (Figure 8, on the right). Yet the diffuse part of the jet can have an apparent angle wider than 120 ° , probably due to projection. Between the two parts there is a lower brightness region.
We can most easily examine the dynamics of the jet during the space experiment sessions in which the exhaust is directed at an angle close to 90 ° toward the telescope. Among these are the sessions on September 1 and 2, 2010 with similar observing conditions. The vertex of the narrow part of the fuel jet is separated from the PCS by a small distance, which increases during the purging process. In the images, the position of the jet vertex can be found from the position of the brightness minimum between the jet and PCS (white cross on the left panel in Figure 9). Measurements show that the jet vertex moves away from the PCS center at a mean velocity of ~0.2 km/s.
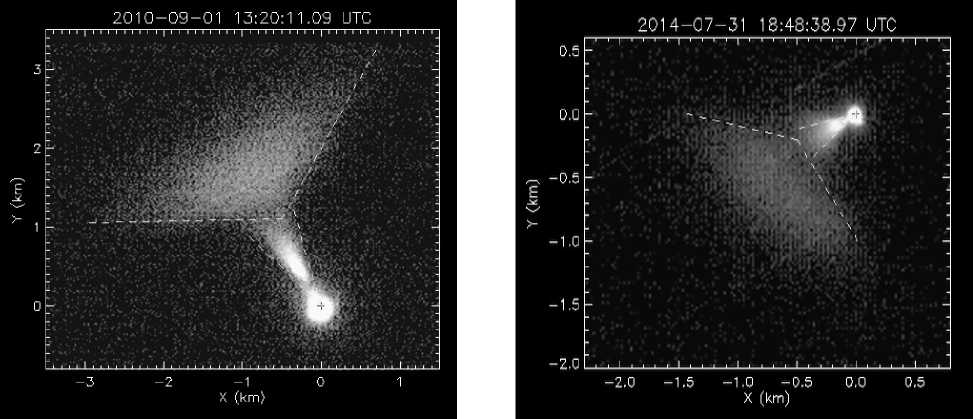
Figure 8. Typical fuel jet: during sidewise observation on September 01, 2010 (on the left ); during observation at a 30° angle to the direction of the exhaust on July 31, 2014 (on the right) 38
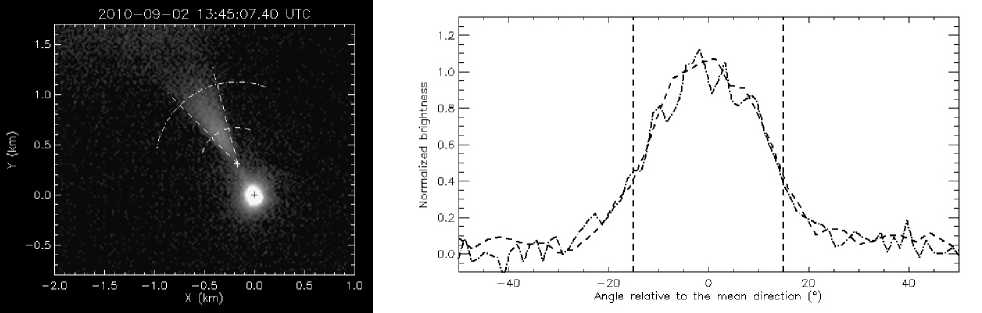
Figure 9 . Narrow component of fuel jet: the image at a moment of the space experiment session on September 01, 2010 (on the left); two azimuthal cross-sections of the jet at different distances shown by dashed and dash-dot arcs on the left
As was mentioned above, the narrow part of the fuel jet has an angle of 30°. Note that this angle remains constant if it is built not from the center of the PCS image but from the jet vertex, i.e., from the minimum brightness (Figure 9).
Of particular emphasis is the difference between the brightness profile across the fuel jet and the profile obtained from scanning across the exhaust jet during ACE running (compare the right panel in Figure 5 with that in Figure 9). When the engine works, there are brighter regions at the boundary of the 30° angle. In the case of fuel jet, the brightness peaks in the middle of the jet and gradually decreases toward boundaries of the 30° angle.
The total velocity of the exhaust can be determined from the position of the front and back boundaries of the diffuse part. The back boundary is well determined from the position of the minimum brightness between the narrow and diffuse parts of the jet.
The diffuse-part boundaries thus determined are marked with an arrow on the left panel in Figure 10. The position of the front and back boundaries of the diffuse part as a function of time is plotted on the right panel. The velocity of the front boundary of the jet is 1.0 km/s (Figure 10, on the right, squares). The velocity of the back boundary of the diffuse part is about 0.67 km/s (Figure 10, on the right, circles).
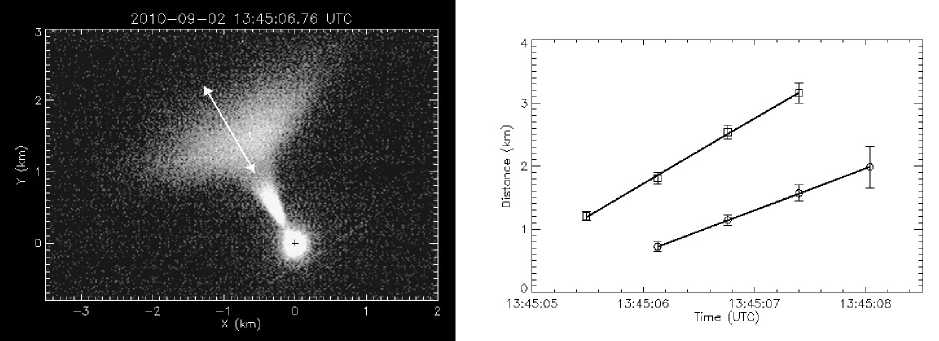
Figure10 . Sizes and position of the diffuse part along the jet on September 02, 2010: longitudinal boundaries of the diffuse part (on the left, arrow); distance to the PCS from the front (squares) and back (circles) boundaries of fuel jet as a function of time (on the right)
The transverse size of the diffuse part, if it is measured in the widest part of the jet, as is shown in Figure 11 on the left, also increases, and the rate of its increase is approximately 1.6 km/s (Figure 11, on the right).
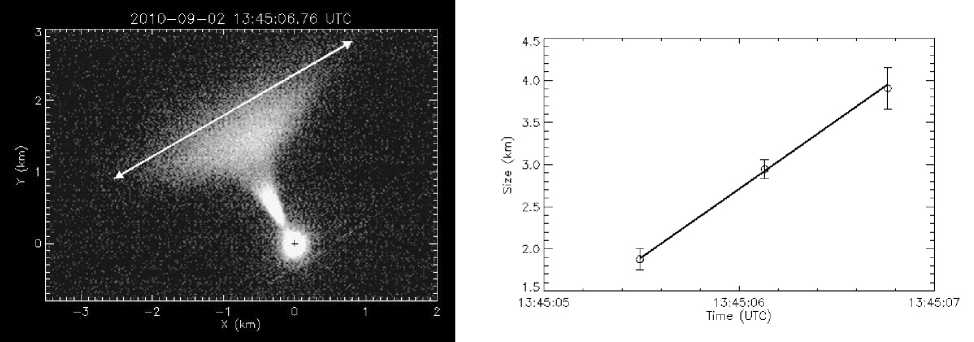
Figure 11 . Sizes and position of the diffuse part across the jet on September 02, 2010: transverse boundaries of the diffuse part (on the left, arrow); transverse size of the diffuse part as a function of time (on the right)
There is a slight asymmetry in the transverse expansion of the jet. In the direction coinciding with the direction of the PCS (nearly at right angle to the direction of the jet), the size of the diffuse part increases more slowly than in the opposite direction. This produces a general shift of the jet to the direction transverse to the direction of the exhaust. The rate of this shift is about 0.3 km/s. A similar rate measured on September 01, 2010 was 0.2. km/s. In both the cases, the shift was directed oppositely to the PCS; therefore, this shift may be attributed to the jet– environment interaction.
CONCLUSION
Measurements made with the AZT-33IK optical telescope during the Radar-Progress space experiment have revealed that both during the PCS’s engine ignitions and during post-cutoff purging process we can detect an optical signal from engine and fuel jets.
When the engine works, there is a weak optical signal; the gas expansion process occurs rapidly. Therefore, the optical signal from the exhaust jet can be registered only in the first 1–2 s after engine ignitions. The main peculiarity in the engine running is the increased brightness of the outer boundary of the exhaust jet. The shape of the jet roughly holds the shape of the nozzle in the first seconds of engine running. This allows us to estimate the exhaust gas velocity – 4–5 km/s.
The optical signal received during the purging process is formed due to reflection of sunlight from more dense fuel particles ejected from the engine. The rate of the ejection is lower than that of the exhaust jet when the engine works, and does not exceed « 1 km/s. Yet the jet consists of two parts - a narrow and a wide, more diffuse one. The narrow part has the form of a cone with an opening angle of 30 ° , which corresponds to the nozzle angle that remains constant with time. The wide part represents a cone with an opening angle of « 120 ° . Against the general expansion, the jet slightly shifts ( V « 0.2-0.3 km/s) in the direction opposite to the direction of PCS, which may be associated with the jet–environment interaction.
The observed differences in the brightness distribution across the engine and fuel jets are likely to be due to the different nature of the stream and particle composition in the jets. In both the cases, the observed glow is caused by solar emission scattered by dispersion particles existing in the jet. In liquid rocket engines, dispersion particles are formed due to condensation of water vapor [Wu, 1975; Platov, Kosch, 2003] under their fast expansion and cooling after leaving the nozzle. Brightness distribution depends on the nature of supersonic exhaust jet and on the process of ice particle formation. The results we obtained in this study show that the observed distribution of brightness of exhaust jet during engine running is more intense at the jet boundary. A similar brightness distribution is discussed in [Platov et al., 2011]; the authors registered the engine jet from the GLONASS spacecraft at a height of 20000 km over Earth’s surface. An analogous effect was also noted in the engine jet from the Saturn-IVB spacecraft during the Apollo-8 lunar mission [Kung et al., 1975]. Possible causes of the effects are thought to be formation of larger ice particles at a jet boundary (this can lead to higher scattering intensity) and higher particle condensation at the jet boundary due to the interaction with surrounding oxygen atoms [Kung et al., 1975]. These problems have not been considered in detail and therefore warrant further study.
During observations of fuel jet, particles of unburned fuel, expelled from the rocket thrust chamber, work as scattering particles. In this case, under uniform distribution of particle density over the jet cross-section, the number of scattering particles in the line of sight decreases toward the side boundary of the jet; accordingly, the observed brightness on its axis is maximum. Let us note that the process analogous to the purging process takes place when solid fuel rocket engine is shut off [Platov et al., 2003]: a sudden pressure release in the thrust chamber causes an almost instantaneous ejection of different fuel components and exhaust products into the atmosphere. High power spacecraft can discharge hundreds of kilograms of substance, thus forming huge gas-dust clouds of size up to ~1500 km.
Список литературы Параметры оптических сигналов на телескопе АЗТ-33ИК, зарегистрированных в активном космическом эксперименте «Радар-Прогресс»
- Алешин В.П., Балега Ю.Ю., Максимов А.Ф. и др. Спекл-интерферометрия геостационарных ИСЗ: реальность и перспективы//Вестник Сибирского государственного аэрокосмического университета им. академика М.Ф. Решетнева. 2011. Вып. 6 (39). С. 154-158.
- Галкин А.А., Гришин Е.А., Иншин П.П., Шаргородский В.Д. Получение изображений космических аппаратов телескопом Алтайского оптико-лазерного центра с использованием адаптивной оптики//Космические исследования. 2008. Т. 46, № 3. С. 201-205.
- Клунко Е.В., Еселевич М.В., Тергоев В.И. Наблюдения на оптическом телескопе АЗТ-33ИК//Солнечно-земная физика. 2016. Т. 2, № 3. С. 17-23.
- Лебедев В.П., Хахинов В.В., Габдуллин Ф.Ф. и др. Исследование методами радиозондирования характеристик плазменного окружения низкоорбитальных космических аппаратов//Космонавтика и ракетостроение. 2008. № 1 (50). С. 51-60.
- Платов Ю.В., Куликова Г.Н., Черноус С.А. Классификация газопылевых образований в верхней атмосфере, связанных с выбросами продуктов сгорания ракетных двигателей//Космические исследования. 2003. Т. 41, № 2. С. 168-173.
- Платов Ю.В., Семенов А.И., Филиппов Б.П. Конденсация продуктов сгорания в выхлопной струе ракетных двигателей в верхней атмосфере//Геомагнетизм и аэрономия. 2011. Т. 51, № 4. С. 556-562.
- Хахинов В.В., Потехин А.П., Лебедев В.П. и др. Результаты дистанционного зондирования ионосферных возмущений в активных космических экспериментах «Радар-Прогресс»//Современные проблемы дистанционного зондирования Земли из космоса. 2012. Т. 9, № 3. С. 199-206.
- Хахинов В.В., Потехин А.П., Лебедев В.П. и др. Некоторые результаты активных космических экспериментов «Плазма-Прогресс» и «Радар-Прогресс»//Вестник Сибирского государственного аэрокосмического университета им. академика М.Ф. Решетнева. 2013. Спец. вып. 5 (51). С. 160-163.
- Korobtsev I., Tergoev V., Karavaev Yu., et al. Observations of near-Earth space objects at the Sayan Observatory. Opportunities and perspectives//Proceeding of 9-th US/Russian Space Surveillance Workshop. Irkutsk, 2012. S5.6.
- Kung R.T.V., Cianciolo L., Myer J.A., Solar scattering from condensation in Apollo translunar injection plume//AIAA J. 1975. V. 13. P. 432-437.
- Platov Y.V., Kosch M.J. Sublimation of ice particles from rocket exhausts in the upper atmosphere//J. Geophys. Res. 2003. V. 108, N A12. P. 1434-1439.
- Potekhin A.P., Khakhinov V.V., Medvedev A.V., et al. Active space experiments with the use of the transport spacecraft “Progress” and Irkutsk IS Radar//PIERS Proceedings. Moscow, 2009. P. 223-227.
- Wu B.J.C. Possible water vapor condensation in rocket exhaust plumes//AIAA J. 1975. V. 13, N 6. P. 797-802.
