Plant disease detection system using bag of visual words

Author: D. Asir Antony Gnana Singh, E. Jebamalar Leavline, A. K. Abirami, M. Dhivya
Journal: International Journal of Information Technology and Computer Science @ijitcs
Article in issue: 9 Vol. 10, 2018.
Free access
Plants are important to human life since plants provide the food, shelter, rain, building material, medicine, fuel such as coal, wood, etc. Therefore, planting, growing, and protecting the plants is essential for sustainable development of any nation. The plant disease can affect the growth of the plats that is caused by pathogens, living microorganisms, bacteria, fungi, nematodes, viruses, and living agents. Hence, identifying the plant disease is very essential to protect the plants in the early stage. Moreover, the plant diseases are identified from the symptoms that appear in stem, fruit, leaf, flower, root, etc. The common symptom of the plant disease can be predicted from the appearance of leaf since the appearance of leaves highly depends on the healthiness of the plant. Therefore, this paper presents a system to identify the lesion leaf from the plants in order to detect the disease occurred in the plant. This system is developed using the bag of visual words model. Moreover, the real time images are collected for various plants and tested with this system and the system produces better results for the given set of images.
Bag of Visual Words, Plant disease detection, Speeded up robust features (SURF), Support vector machine (SVM)
Short address: https://sciup.org/15016298
IDR: 15016298 | DOI: 10.5815/ijitcs.2018.09.07
Text of the scientific article Plant disease detection system using bag of visual words
Published Online September 2018 in MECS DOI: 10.5815/ijitcs.2018.09.07
Plants play a vital role in improving the quality of healthy life of the humankind and animals. Moreover, plants are important to human life since plants provide the food, shelter, building material, medicine, fuel such as coal, wood, etc. Plants protect the environment by preventing soil erosion from rain, floods and earthquake. They also and prevent the air pollution by observing carbon dioxide and releasing the oxygen. Plants also provide food and shelter for wild animals. The crops and plants contribute to the economy of the nation by yielding fruits, vegetables, flower, grain, and nuts and medicine. Moreover, the wood plants provide wood for construction, furniture, paper etc. The degraded plants are used as fertilizer and to produce biofuel [1].
Therefore, planting, growing, and protecting the plants is important for sustainable development of any nation. The plant disease that is caused by pathogens, living microorganisms, bacteria, fungi, nematodes, viruses, and living agents can affect the growth of the plants. Hence, identifying the plant disease is very essential to protect the plants from the disease in early stage.
The plant diseases are identified from the symptoms appears in stem, fruit, leaf, flower, root, etc. The common symptoms of plant disease can be predicted from the appearance of leaf since the appearance of leaves highly depends on the healthiness of the plant.
Many researchers paid attention with different approaches to detect plant disease by identifying the quality of leaves such as normal leaf or lesion (affected) leaf. However, in common method, the leaf images are collected from the plants such as affected and unaffected leaf. Then, the features are extracted from the images and the features are used to train the classification model using any one of the supervised machine learning algorithm [2]. From the classification model, the unlabeled leaf is identified whether it is affected leaf or not.
Therefore, this paper presents a system to identify the lesion leaf from the plants in order to detect the disease occurred in the plant. This system is developed using the bag of visual words model. The rest of the paper is organized as follows: Section II presents the related works. Section III explains the plant disease detection system and Section IV discusses the results. Section V concludes the paper.
-
II. Related Works
This section presents the research works that are carried out by many researchers that are related to the proposed research work. In general, the plant disease is identified through the appearance of the leaf. If the leaf is identified as affected leaf, then the corresponding plant is identified as the diseased plant. In order to identify the disease affected leafs, leafs are collected from the plants and the image processing is performed on the images for extracting features. Then, the machine learning algorithm is used to build the model and leafs are tested with the model for identifying the affected leaf.
The researchers use different approaches for feature extraction and image detection and the researchers paid attention to detect diseases for different plants. Ganesan P et al presented a disease affected plant leave detection system. This system works in CIELuv color space with fuzzy based approach. To identify the disease affected plant leaf, initially, the leaf images are collected through any one of the image acquisition devices from the affected and unaffected plants. Then, the image preprocessing is performed on the images using median filter to remove the noise from the images. Further, these images are transformed from the RGB to CIELuv color space and the image is sharpened with fine details of the image for image enhancement. The fuzzy-based segmentation method is used to segment the images. Then, the image quality parameters are used to distinguish the disease affected parts and the unaffected portions of the leaves [3].
Aakanksha Rastogi et al proposed a system for detecting the leaf disease and grading using fuzzy logic technique and computer vision. The proposed system consists of two phases. In the first phase, the features are extracted from the leaf image and the classification is carried out using artificial neural network (ANN). In the second phase, the k-means clustering is used to segment the defected area, then the features are extracted and the ANN is used for classification. Moreover, this system grades the disease based on the infected level of the disease on the leaf [4].
Herbals provide the medicinal benefit. Hence, Robert G. de Luna presented a system to recognize the medicine plant of Philippine herbal. This system is developed using the feature extraction technique and artificial neural network for plant recognition. This system also provides the information about the diseases that can be cured by the Philippine herbal [5]. Sachin D. Khirade et al suggested another plant disease detection system. This system is developed using five phases of image processing techniques namely image acquisition, preprocessing, segmentation, extraction and detection [6].
The viruses that affect the leaf and the plant must be detected in early stage so as to save the plants. Namita Sengar presented a plant disease system for detecting the Ageratum enation virus (AEV) which affects the health of the plant. In order to identify AEV infected plant, the texture based images are collected from the infected and uninfected plants. From, the collected red green blue (RGB) color images the blue channel is selected, and this channel is divided into blocks. Then the statistical and Gray Level Co-occurrence Matrix (GLCM) features are extracted from these blocks and the significant features are identified. Then, a threshold value is fixed for the significant features to differentiate the infected plant image and unindicted plant image [7].
Paddy fields are the source of food for more country. Xiaochun Mai et al presented a rice leaf blast disease identification system using random forest classifier. In order to identify the disease, the leaf images are collected, resized, color is adjusted and the simple linear iterative clustering (SLIC) is used to perform the segmentation process. Then, the regional feature is extracted and the random forest classifier is used for classification of rice leaf [8].
Auzi Asfarian et al presented a paddy diseases identification method. In this method, the texture analysis is performed using the Fourier spectrum-based fractal descriptors. The extracted descriptors of each lesion image are used to build the classification model using probabilistic-based neural networks [9]. Santanu
Phadikar et al presented a rice disease identification system using pattern recognition. Moreover, this system uses the soft computing technique [10].
Some of the researchers paid attention to develop plant disease detection system for different plants such as Grape, Citrus, Groundnut, Flower, Pepper and Tomato. For example, Harshal Waghmare et al proposed Grape plant disease detection and classification system. This system extracts the opposite colour local binary pattern features from the leaf images and the automated decision supported system is used for detecting the disease affected leaf [11].
Kiran R. Gavhale et al developed an image processing approach-based unhealthy region of Citrus leaf detection system. This system consists of several image processing phases that include conversion of RGB into different color space and image enhancement. Further, image segmentation is performed using the k-means clustering algorithm to identify the region of interest, and feature extraction. Furthermore, the SVM algorithm is employed to develop the classifier to detect the unhealthy region of the Citrus leaf [12].
Ramakrishnan.M et al presented a Groundnut leaf disease detection system. This system is developed using the back propagation classification algorithm. Using this system, the ground nut disease namely cercospora is detected. In order to construct this system, the Groundnut leaf images are collected and these images are transformed from RGB to HSV. Then, the plane separation is performed and then the colour features are extracted. These features are used to develop the back propagation-based classifier for disease detection [13].
Getahun Tigistu et al presented a flower disease detection system using artificial neural networks. Initially, the images are captured. Then, the images are segmented for identifying the region of interest (ROI). The Gabor feature extraction technique is used to extract the texture features from the region of interest. Then, artificial neural network algorithm is used to train the model with the extracted features to detect the diseased flower leaf [14]. Jobin Francis presented a pepper plant leaf disease identification method using soft computing technique. Initially, the image is acquired and the RGB color images are transformed into HSV color space. Then, the image segmentation is performed using the masking and thresholding. Further, the image features are extracted and the feed forward back propagation neural network is used for classification [15]. Moreover, Megha P Arakeri uses the image processing to conduct the analysis of late blight disease in tomato leaf [16].
The plant disease recognition system is also used for smart farming. Chit Su Hlaing et al presented a plant disease recognition system for smart farming. This system preprocesses the images and extracts the scale invariant feature transforms (SIFT) feature. Then, these features are given to support vector machine (SVM) to develop the classification model in order to recognize the plant disease. Moreover, the 10-fold cross validation method is used to evaluate the performance of this recognition system [17]. Shitala Prasad et al presented mobile phone based-leaf disease detection. In order to detect the leaf disease, the image is captured and the k-means clustering is used for segmentation followed by classification [18]. The bag of visual words-based feature extraction technique is one of the image processing techniques. Mohammad Reza Zare et al presented an automatic medical X-ray image classification method using bag of visual words approach. This method extracts features with bag of visual words. Moreover, it uses radial basis function (RBF)-based support vector machine for classification [19].
From these literatures, it is observed that many researchers developed different types of the plant disease system with different approaches for various plants. Moreover, the bag of visual words-based feature extraction technique is also used for image detection. Therefore, this paper presents a plant disease detection system for different plants by detecting the disease affected leaf of the plants.
-
III. Plant Disease Detection System
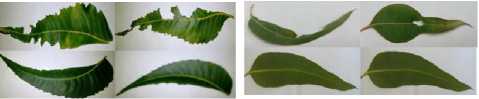
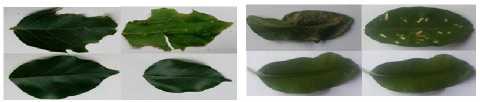
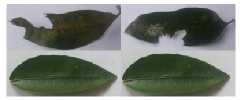
In order to develop the plant disease detection system, the images are collected from five plants namely Mango, Lemon, Eucalyptus, Neem, and Indian beech and image dataset is prepared as shown in Table 1. Moreover, sample images from the image dataset are illustrated in Fig. 1.
Table 1. Details of Image Dataset
|
Name of the image dataset |
Number of leaf images |
Number of classes |
|
|
Affected leaf |
Unaffected leaf |
||
|
Mango |
114 |
57 |
57 |
|
Lemon |
116 |
58 |
58 |
|
Eucalyptus |
134 |
67 |
67 |
|
Neem |
112 |
56 |
56 |
|
Indian beech |
60 |
30 |
30 |
|
Total number of leaf images |
536 |
268 |
268 |
(b)
(a)
(c) (d)
(e)
Fig.1. Sample affected and unaffected leaf images of (a) Neem (b) Eucalyptus (c) Indian beech (d) Mango (e) Lemon plants
Each image dataset is randomly split into two datasets namely training and test image datasets with equal number of affected and unaffected class labels as shown in Fig. 2.
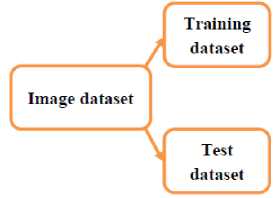
Fig.2. Preparation of training and test dataset
The features are extracted from the entire dataset as shown in the Fig. 3. In order to extract the features, the key points are extracted from each image using the speeded up robust features (SURF) feature extraction method. The feature vectors are formed from the extracted key points. The K-means clustering is used for group the similar feature vectors and to form the vocabulary. Then, centroid of each cluster is collected and combined together that is known as visual words.
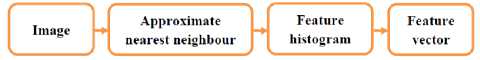
Fig. 4 shows the feature vector representation for each image. In order to represent the feature vector from the image features are extracted from the collected images. Then, the approximate nearest neighbor algorithm is used to develop the feature histogram for each image with respect to the visual words. Then, the histogram value is considered as the feature vector. Fig. 5 shows the steps for development of classifier and evaluation. The training feature vectors are given to the classification algorithm namely support vector machine (SVM) and the classifier is developed. The test feature vectors are given to the classifier and the performance of the developed classifier is evaluated.
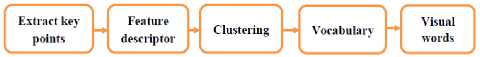
Fig.3. Extraction of visual words
(2), (3), respectively.
Fig.4. Feature vector representation of image for training an image classifier
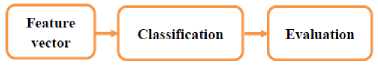
Fig.5. Classifier building and evaluation
-
A. Experimental Setup And Procedure
This presented plant disease detection system is implemented using the MATLAB R2015a software. Moreover, The Computer Vision System Toolbox is used for developing the presented system. In order to construct the detection system, the images are collected from the various plants and the image dataset is prepared as shown in Table 1. Each dataset is split into training and test image datasets. The training image dataset is used to develop the detection system and the test image dataset is used to evaluate the performance of the detection system. Thus, each dataset is split with the following ratio: 80:20, 70:30, 60:40, 50:50 and 40:60. For example, 80:20 ratios represent that the particular dataset is split as 80 percentage of training dataset and the remaining 20 percentage is used as testing dataset.
-
B. Performance Evaluation
The performance of the plant disease detection system is evaluated in terms of accuracy, sensitivity or True Positive Rate (TPR), specificity or True Negative Rate (TNR). The accuracy, sensitivity and specificity are calculated using the confusion matric as shown in Fig. 6 obtained from the evaluation on the classifier. True positive (TP) represents the number of images that correctly detected images from the positive images (affected leaf images), true negative (TN) represents the number of images that are correctly detected images from the negative images (unaffected leaf images), false positive (FP) represents the number of images that are wrongly detected from the negative images (unaffected leaf images), false negative (FN) represents the number of images that are wrongly detected positive images (affected leaf images).
|
Detected affected leaf |
Detected unaffected leaf |
|
|
Actual affected leaf |
TP |
FN |
|
Actual unaffected leaf |
FP |
TN |
Fig.6. Confusion matrix
Fig. 7 shows a sample confusion matrix for leaf detection. Moreover, Fig. 7 shows totally 100 positive images (affected leaf images) and 100 negative images (unaffected leaf images) are given to test the classification model and results in 94, 06, 00, 100 as TP, FN, FP and TN, receptively. Then, the accuracy, sensitivity, specificity are calculated from Equation (1),
|
Detected affected leaf |
Detected unaffected leaf |
Total |
|
|
Actual affected leaf |
094 |
006 |
100 |
|
Actual unaffected leaf |
000 |
100 |
100 |
|
Total |
094 |
106 |
200 |
Fig.7. Sample confusion matrix for leaf detection
Accuracy _ TP + TN (1)
TP + TN + FN + FP
IV. Results and Discussion
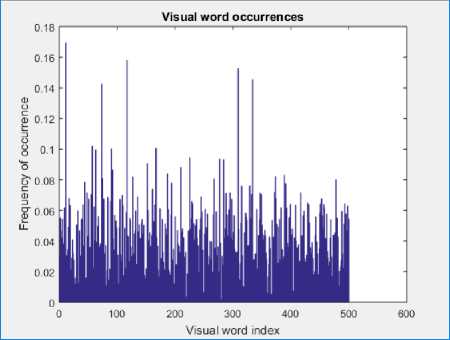
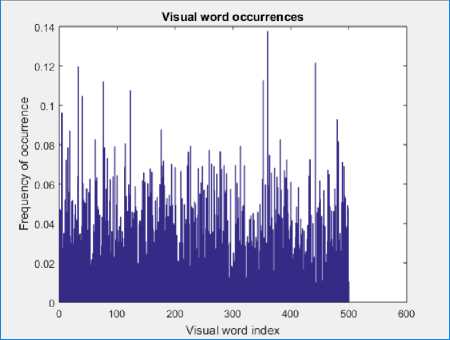
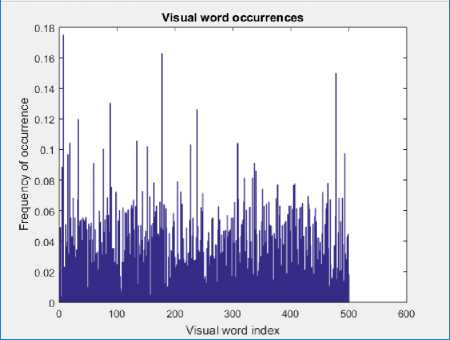
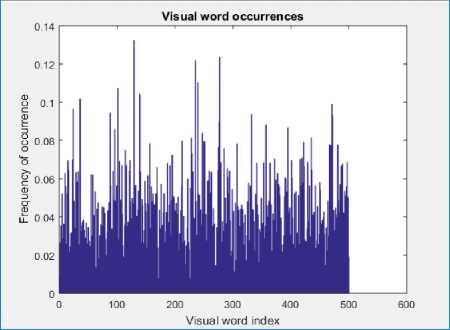
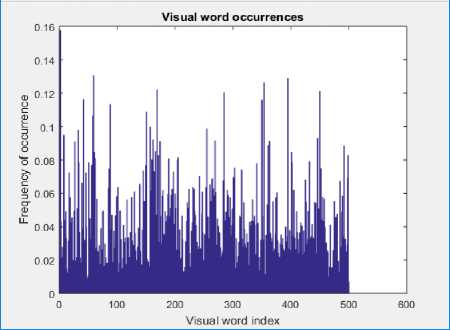
Fig. 8 shows the sample visual word occurrences for the image dataset Mango with respect the frequency of occurrence and visual word index.
(a)
_ 94 + 100
= 94 + 100 + 6 + 100 + 0
|
194 |
|
|
= = 0.97 |
|
|
200 |
|
|
Sensitivity _ TP TP + FN 94 = —--- = 0.94 94 + 6 |
(2) |
|
Specificity = TN TN + FP = -™- = 1.00 100 + 0 |
(3) |
(b)
(f)
Fig.8. Sample visual word occurrences for the image dataset Mango
(c)
Table 2. Accuracy in Percentage on Datasets With Respect to the Number of Test Images from Dataset in Percentage
|
Image datasets |
Number of test images from dataset in percentage |
||||
|
20 |
30 |
40 |
50 |
60 |
|
|
Mango |
90.00 |
98.50 |
95.00 |
96.00 |
100.00 |
|
Lemon |
82.50 |
86.50 |
84.00 |
88.00 |
89.00 |
|
Eucalyptus |
97.00 |
97.00 |
100.00 |
97.00 |
97.50 |
|
Neem |
58.00 |
69.50 |
68.00 |
60.50 |
62.50 |
|
Indian beach |
86.00 |
94.50 |
62.50 |
96.00 |
90.00 |
(d)
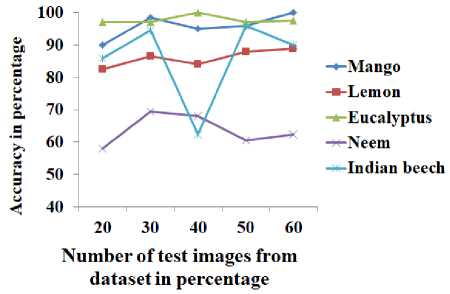
Fig.9. Accuracy in percentage on datasets with respect to the percentage of test image dataset
Table 3. Sensitivity in Percentage on Datasets With Respect to the Number of Test Images from Dataset in Percentage
|
Image dataset |
Percentage of test image dataset |
||||
|
20 |
30 |
40 |
50 |
60 |
|
|
Mango |
83.33 |
97.08 |
93.21 |
96.00 |
100.00 |
|
Lemon |
98.52 |
93.97 |
95.94 |
100.00 |
90.62 |
|
Eucalyptus |
94.33 |
96.07 |
100.00 |
94.33 |
95.23 |
|
Neem |
83.33 |
68.57 |
66.98 |
74.41 |
100.00 |
|
Indian beach |
86.00 |
100.00 |
100.00 |
92.59 |
100.00 |
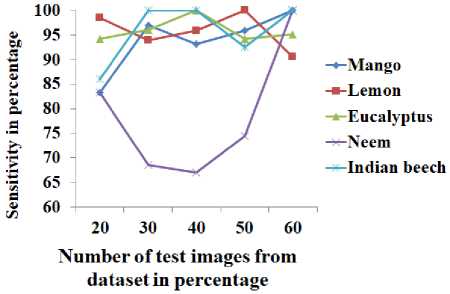
Fig.10. Sensitivity in percentage on datasets with respect to the percentage of test image dataset
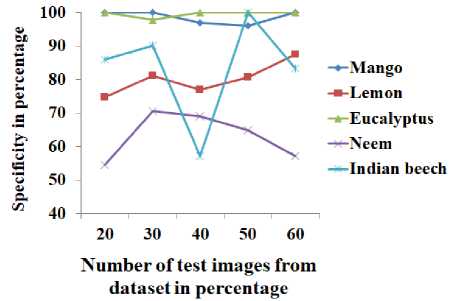
Fig.11. Specificity in percentage on datasets with respect to the percentage of test image dataset
Table 2 and Fig. 9 show that the detection accuracy for each image dataset with respect to percentage test dataset. From Table 2 and Fig. 9, it is obvious that the presented system gives more detection accuracy for the Mango image dataset compared to other image datasets except the 20 and 30 percentage of the test image dataset. The system gives less detection accuracy for the Neem image dataset except 40 percentage of the test image dataset. Moreover, there is no evidence or correlation among varying the number of images for test image dataset.
Table 3 and Fig. 10 show the detection sensitivity for each image dataset with respect to percentage test dataset. From Table 3 and Fig. 10, the presented system gives more detection sensitivity for the Indian beech image dataset compared to other image datasets except the 20 and 50 percentage of the test image dataset. The system gives less detection accuracy for the Neem image dataset except 20 and 60 percentage of the test image dataset.
Moreover, there is no evidence or correlation among varying the number of images for test image dataset.
Table 4 and Fig. 11 show the accuracy value for each image dataset with respect to percentage test dataset. From Table 4 and Fig. 11, the presented system gives more detection accuracy for the Eucalyptus image dataset compared to other image datasets except the 30 percentage of the test image dataset. The system gives less detection accuracy for the Neem image dataset except 40 percentage of the test image dataset. Moreover, there is no evidence or correlation among varying the number of images for test image dataset.
Table 4. Specificity in Percentage on Datasets With Respect to the Number of Test Images from Dataset In Percentage
|
Image datasets |
Percentage of test image dataset |
||||
|
20 |
30 |
40 |
50 |
60 |
|
|
Mango |
100.00 |
100.00 |
96.87 |
96.00 |
100.00 |
|
Lemon |
74.80 |
81.19 |
76.98 |
80.64 |
87.50 |
|
Eucalyptus |
100.00 |
97.95 |
100.00 |
100.00 |
100.00 |
|
Neem |
54.54 |
70.52 |
69.14 |
64.96 |
57.14 |
|
Indian beach |
86.00 |
90.09 |
57.14 |
100.00 |
83.33 |
-
V. Conclusion
This paper presented a plant disease detection system using the bag of visuals words method. In order to develop this system, the images were collected from various plants and the features are extracted from the images. Support vector machine (SVM) was used to develop the classifier and to detect the affected leaf to identify the disease of the plant. Moreover, the performance of the plant disease detection system is evaluated in terms of accuracy, sensitivity and specificity. From the performance evaluation, it is identified that the presented system performs better for identifying the diseased plants.
References Plant disease detection system using bag of visual words
- Singh, D.A.A.G., Leavline, E.J., Priyanka, V. and Swathi, V., 2016. Agriculture classification system using differential evolution algorithm. International Advanced Research Journal in Science, Engineering and Technology, 3, pp.24-28.
- Singh, D.A.A.G. and Leavline, E.J., 2014. A Pragmatic Approach on Knowledge Discovery in Databases with WEKA. International Journal of Engineering Technology and Computer Research (IJETCR), 2(7), pp.81-87.
- Ganesan, P., Sajiv, G. and Leo, L.M., 2017, March. CIELuv color space for identification and segmentation of disease affected plant leaves using fuzzy based approach. In Science Technology Engineering & Management (ICONSTEM), 2017 Third International Conference on (pp. 889-894). IEEE.
- Rastogi, A., Arora, R. and Sharma, S., 2015, February. Leaf disease detection and grading using computer vision technology & fuzzy logic. In Signal Processing and Integrated Networks (SPIN), 2015 2nd International Conference on (pp. 500-505). IEEE.
- de Luna, R.G., Baldovino, R.G., Cotoco, E.A., de Ocampo, A.L.P., Valenzuela, I.C., Culaba, A.B. and Gokongwei, E.P.D., 2017, December. Identification of philippine herbal medicine plant leaf using artificial neural network. In Humanoid, Nanotechnology, Information Technology, Communication and Control, Environment and Management (HNICEM), 2017 IEEE 9th International Conference on (pp. 1-8). IEEE.
- Khirade, S.D. and Patil, A.B., 2015, February. Plant disease detection using image processing. In Computing Communication Control and Automation (ICCUBEA), 2015 International Conference on (pp. 768-771). IEEE.
- Sengar, N., Srivastava, A. and Dutta, M.K., 2017, November. Machine vision based detection of ageratum enation virus infection using light microscopic images of poppy plants cells. In Emerging Trends in Computing Communication Technologies (ICETCCT), International Conference on (pp. 1-4). IEEE.
- Mai, X. and Meng, M.Q.H., 2016, June. Automatic lesion segmentation from rice leaf blast field images based on random forest. In Real-time Computing and Robotics (RCAR), IEEE International Conference on (pp. 255-259). IEEE.
- Asfarian, A., Herdiyeni, Y., Rauf, A. and Mutaqin, K.H., 2013, November. Paddy diseases identification with texture analysis using fractal descriptors based on fourier spectrum. In Computer, Control, Informatics and Its Applications (IC3INA), 2013 International Conference on (pp. 77-81). IEEE.
- Phadikar, S. and Sil, J., 2008, December. Rice disease identification using pattern recognition techniques. In Computer and Information Technology, 2008. ICCIT 2008. 11th International Conference on (pp. 420-423). IEEE.
- Waghmare, H., Kokare, R. and Dandawate, Y., 2016, February. Detection and classification of diseases of Grape plant using opposite colour Local Binary Pattern feature and machine learning for automated Decision Support System. In Signal Processing and Integrated Networks (SPIN), 2016 3rd International Conference on (pp. 513-518). IEEE.
- Gavhale, K.R., Gawande, U. and Hajari, K.O., 2014, April. Unhealthy region of citrus leaf detection using image processing techniques. In Convergence of Technology (I2CT), 2014 International Conference for (pp. 1-6). IEEE.
- Ramakrishnan, M., 2015, April. Groundnut leaf disease detection and classification by using back probagation algorithm. In Communications and Signal Processing (ICCSP), 2015 International Conference on (pp. 0964-0968). IEEE.
- Tigistu, G. and Assabie, Y., 2015, September. Automatic identification of flower diseases using artificial neural networks. In AFRICON, 2015 (pp. 1-5). IEEE.
- Francis, J. and Anoop, B.K., 2016, March. Identification of leaf diseases in pepper plants using soft computing techniques. In Emerging Devices and Smart Systems (ICEDSS), Conference on (pp. 168-173). IEEE.
- Megha P Arakeri, Malavika Arun, Padmini R K,"Analysis of Late Blight Disease in Tomato Leaf Using Image Processing Techniques", International Journal of Engineering and Manufacturing(IJEM), Vol.5, No.4, pp.12-22, 2015.DOI: 10.5815/ijem.2015.04.02
- Chit Su Hlaing, Sai Maung Maung Zaw., 2017. Plant Diseases Recognition for Smart Farming Using Model-based Statistical Features. 2017 IEEE 6th Global Conference on Consumer Electronics (GCCE 2017)
- Prasad, S., Peddoju, S.K. and Ghosh, D., 2014, April. Energy efficient mobile vision system for plant leaf disease identification. In Wireless Communications and Networking Conference (WCNC), 2014 IEEE (pp. 3314-3319). IEEE.
- Zare, M.R., Mueen, A. and Seng, W.C., 2013. Automatic classification of medical X-ray images using a bag of visual words. IET Computer Vision, 7(2), pp.105-114.
