Почему стимулы не побуждают к действию: данные о пороговом характере инициативы на примере образовательных дедлайнов

Автор: Никеш Лагун
Журнал: Informatics. Economics. Management - Информатика. Экономика. Управление.
Рубрика: Образование
Статья в выпуске: 5 (1), 2026 года.
Бесплатный доступ
Дедлайны формируют поведение в различных экономических сферах, включая налоговую отчетность, получение социальных выплат, образование и программы занятости. Стандартные модели предполагают плавную реакцию на стимулы и давление времени, что выражается в постепенном росте активности по мере приближения срока. Однако на практике поведение зачастую характеризуется длительными периодами бездействия, за которыми следуют резкие всплески активности незадолго до дедлайна. Используя масштабные административные данные из сферы высшего образования, автор показывает, что инициирование действий представляет собой отдельную, неплавную поведенческую грань. Повторное наблюдение за студентами, подвергающимися заранее установленным срокам оценивания, выявляет, что вероятность начала активности остается стабильной большую часть времени и резко возрастает в последние дни. Этот эффект приводит к значительному “скоплению” активности у крайних сроков, слабой реакции на уровень ставок и выраженной зависимости от предыдущего бездействия. Репликация на данных онлайн-курсов подтверждает аналогичную динамику: учащиеся активно включаются в работу в финальной фазе курса. Полученные результаты сложно объяснить моделями, основанными только на дисконтировании, заметности или прокрастинации. Напротив, данные согласуются с гипотезой, что инициативу ограничивают условия осуществимости, которые резко ослабевают перед дедлайном. Идентифицированный “пороговый” механизм помогает объяснить, почему только стимулирующие меры часто неэффективны в средах, где решения зависят от сроков.
Инициирование действий, дедлайны, пороговое поведение, концентрация активности, прокрастинация, поведенческие ограничения.
Короткий адрес: https://sciup.org/14135118
IDR: 14135118 | DOI: 10.47813/2782-5280-2026-5-1-5001-5022
Текст статьи Почему стимулы не побуждают к действию: данные о пороговом характере инициативы на примере образовательных дедлайнов
DOI:
Deadlines are a central institutional device used to structure economic behaviour. They determine when taxes must be filed, benefits claimed, assignments submitted, training programmes completed, and compliance obligations met. In standard economic models, deadlines interact with incentives and time preferences through smooth trade-offs: as time runs out or stakes increase, individuals are expected to reallocate effort and initiate action progressively earlier. This logic underlies influential models of intertemporal choice, procrastination, and policy design across education, public finance, and labour markets [1-4].
A large and growing body of evidence challenges this view. In many deadline-driven environments, behaviour is not smoothly distributed over time. Instead, individuals often exhibit extended periods of inactivity followed by abrupt surges of action concentrated in a narrow window immediately before deadlines. Such clustering has been documented in tax compliance and fiscal thresholds [5-7], in educational settings and task completion [8,9], in administrative processes and benefit take-up [10-12], and in online learning and labour market programmes [13,14]. Notably, these spikes often persist even when deadlines are salient, incentives are substantial, and individuals have repeated prior exposure to the same institutional structure.
Existing explanations account for important aspects of delayed action but leave key features unresolved. Models based on exponential or hyperbolic discounting predict gradual acceleration as deadlines approach, not the near-flat hazards followed by sharp late-stage spikes frequently observed in the data [2,3]. Procrastination models explain reliance on deadlines as commitment devices, yet typically imply that stronger incentives should substantially smooth the timing of action [8,15]. Salience- and attentionbased accounts emphasise reminders and awareness but struggle to explain why repeated exposure, experience, and higher stakes do not eliminate extreme clustering [16,17]. Across these literatures, delayed action is generally treated as a distortion in preferences, beliefs, or attention, rather than as a constraint on whether action can be initiated at all.
This paper documents and analyses a different empirical regularity. Using large-scale administrative data from higher education, we show that action initiation behaves as a distinct behavioural margin. Initiation hazards remain low and relatively flat over most of the available window and then rise sharply in the final days before deadlines. These dynamics generate extreme bunching at deadlines, limited responsiveness to higher stakes, and pronounced state dependence, whereby prior non-initiation predicts even more delayed action. We further document similar late-stage acceleration in a distinct online learning environment, suggesting that these patterns are not unique to a single institutional setting.
The primary contribution of the paper is empirical. We provide systematic evidence that initiation is governed by sharp nonlinearities that are difficult to reconcile with smooth incentive-based or timediscounting models alone. Importantly, our results do not imply that incentives are irrelevant. Higher stakes shift initiation modestly earlier, indicating that incentives affect readiness. However, incentives do not smooth initiation across the window or eliminate late-stage clustering, suggesting that incentives alone are insufficient to explain observed timing patterns.
These findings motivate an alternative interpretation: initiation may be conditionally feasible rather than continuously chosen. Wanting to act, intending to act, and being able to initiate action at a given moment need not coincide. Individuals may face increasing incentives, awareness, and intentions over time, yet remain unable to initiate action until certain conditions are met. When those conditions are satisfied, often close to a deadline, action becomes suddenly possible, producing sharp increases in initiation over short intervals.
It is important to clarify the scope of this claim. The empirical analysis identifies robust behavioural regularities (non-smooth initiation hazards, deadline bunching, limited smoothing from incentives, and state dependence) but does not uniquely identify a single cognitive or structural mechanism. Thresholdgated initiation should therefore be understood as a class of mechanisms consistent with the observed patterns, rather than as a definitively established model. Alternative explanations, such as sharp penalty cliffs or nonlinear present bias, are constrained by the evidence but not fully ruled out.
Within this broader class, one structural interpretation draws on recent work modelling effort and action as conditionally available, governed by internal thresholds and resistance dynamics [18]. We treat this framework as an interpretive lens rather than as an empirically identified law. The value of the framework lies in clarifying how preferences, incentives, attention, and experience may shape readiness continuously while observable action emerges discontinuously.
To examine these dynamics, we use the Open University Learning Analytics Dataset, which records detailed submission behaviour for centrally scheduled assessments with fixed deadlines and predetermined stakes [19]. This setting provides repeated, exogenous exposure to deadlines across students and assessments, allowing high-resolution analysis of initiation timing. We complement this analysis with descriptive replication evidence from large-scale online courses using the SNAP MOOC User Action dataset [20].
By reframing delayed action as a problem of initiation rather than incentives alone, this paper contributes to several literatures. It extends work on procrastination and deadlines by identifying initiation as a separate margin operating alongside preferences and self-control [8,21]. It provides a behavioural interpretation for sharp mass points at institutional thresholds documented in public finance and applied microeconomics [6,22]. It also connects to research on administrative burden by highlighting initiation as a central bottleneck in interactions between individuals and institutions [10,12,23].
The remainder of the paper develops a conceptual framework, documents the empirical patterns, and evaluates alternative explanations. The central message is straightforward: in many deadline-driven environments, action is not continuously chosen but conditionally possible. Ignoring this distinction risks misinterpreting both behaviour and the effectiveness of incentive-based policy interventions.
CONCEPTUAL FRAMEWORK AND TESTABLE PREDICTIONS
This section develops a parsimonious framework for understanding action initiation under deadlines. The objective is not to fully characterise optimal behaviour or to identify a unique structural model, but to clarify how different classes of mechanisms generate distinct, testable predictions about the shape of initiation behaviour over time. We first outline the predictions of standard incentive-based models and then contrast them with a class of threshold-gated initiation mechanisms capable of generating sharp, non-smooth dynamics.
Standard Economic View of Initiation
In standard economic models, agents are assumed to choose when to initiate action by trading off costs and benefits smoothly over time. Initiation responds continuously to incentives, time pressure, and discounting, implying gradual acceleration as deadlines approach [2-4].
Let t denote time remaining until a deadline, and let Ун £ {0,1} indicate whether agent i initiates action at time t. Under this view, initiation can be represented by a hazard function:
Pr(yu = 1 1 1) = h(t), (1)
where h(t) is smooth and monotonic in time-to-deadline:
^)<0, dt ’
d2h(t) dt2
~ 0.
Higher stakes or stronger incentives are expected to shift the hazard upward for all t, producing earlier and more evenly distributed initiation [1,15]. This class of models, therefore, predicts smooth acceleration, not sharp spikes or bunching concentrated in narrow time windows.
Threshold-Gated Initiation: A General Mechanism
We contrast this view with a class of mechanisms in which initiation is constrained by feasibility rather than governed by continuous optimisation. Under threshold-gated initiation, individuals may face increasing incentives, attention, or intentions over time, yet remain unable to initiate action until certain conditions are met. Once these conditions are satisfied, initiation becomes suddenly possible, producing abrupt changes in observed behaviour.
This perspective treats initiation as a distinct behavioural margin, separate from effort intensity or task completion. Importantly, it does not require extreme discounting, inattention, or preference reversals. Instead, it allows smooth changes in underlying readiness to map into discontinuous observed action.
Latent readiness state
To formalise this intuition, let agent i’s latent readiness at time t be given by:
R^^-GW-Fn , (3)
where Ai captures baseline activation capacity, Gi(t) denotes time-dependent resistance or friction, and Fit represents state-dependent factors such as prior non-initiation or avoidance. This formulation is intentionally agnostic about preferences and discounting; it characterises feasibility rather than utility.
Ignition condition
Initiation occurs only when readiness crosses a threshold:
y it = 1{R it > 0}. (4)
Below the threshold, marginal increases in incentives or urgency may raise readiness without producing action. Above it, initiation becomes feasible. This structure is analogous to referencepoint models in behavioural economics, where behaviour changes discontinuously at salient boundaries [5,7,24,25], but applied to the feasibility of initiating action rather than to valuation alone.
Deadlines as Threshold Shifters
Deadlines enter the framework by shifting resistance rather than preferences. We assume that resistance declines gradually over most of the window and more sharply as deadlines approach:
dGim ~ 0 dt ~ dGtm < 0
for t >> 0, for t ^ 0.
This assumption captures the empirical regularity that urgency rises discretely near deadlines without changing task fundamentals [8,26]. Substituting (5)– (6) into (3)–(4) yields a nonlinear mapping from time-to-deadline to observed initiation.
Figure 1 provides a schematic illustration. Initiation remains rare while agents are far from the threshold, increases sharply as resistance falls near the deadline, and then plateaus once initiation becomes feasible for most agents. Figure 1 is illustrative and intended to clarify qualitative predictions rather than empirical magnitudes.
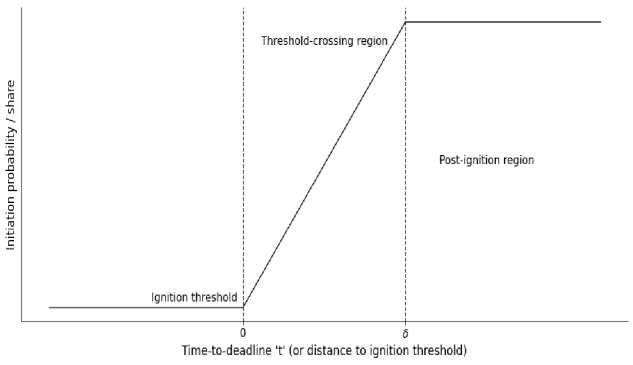
Figure 1. Threshold-gated initiation around a deadline.
Notes. Figure 1 illustrates the predicted shape of initiation behaviour implied by a threshold-gated initiation model. Initiation probability remains flat when agents are far from the ignition threshold, increases sharply over a narrow interval as resistance declines near the deadline, and plateaus once the threshold is crossed. The horizontal axis represents time-to-deadline (or distance to the ignition threshold), while the vertical axis represents the probability or share of agents initiating action. Figure 1 is schematic and intended to illustrate theoretical predictions rather than empirical magnitudes.
Implications for Observed Hazards
Under threshold-gated initiation, the observed initiation hazard can be written as:
Pr(y it = 1 I t) = Pr(At - F it > G^t)) (7)
Because Gi(t) declines sharply only near the deadline, Equation (7) implies:
-
• Low and relatively flat initiation far from deadlines,
-
• Rapid acceleration over a narrow interval,
-
• Bunching of initiation close to the deadline.
Unlike standard models, this convexity arises without assuming present bias, hyperbolic discounting, or inattention. Importantly, these predictions concern the shape of initiation behaviour, not the underlying cognitive mechanism.
Incentives and State Dependence
Incentives enter the framework by shifting readiness:
R it = A i +p-S it - GiV-F it , (8)
where Sit denotes stakes and p > 0. Higher stakes, therefore, increase readiness and may shift initiation modestly earlier. However, the threshold structure in (4) is preserved, implying that incentives alone need not smooth initiation across the window or eliminate late-stage clustering.
State dependence arises naturally when prior noninitiation increases friction:
F it = F it-1 + 1{y i,t-i = 0}. (9)
This generates heterogeneity in ignition timing and aligns with evidence that past failure predicts delayed engagement beyond what stable preferences would imply [10,21].
Interpretation and Scope
The framework developed here is intentionally limited in scope. It identifies a class of mechanisms consistent with sharp, non-smooth initiation dynamics but does not uniquely identify any single structural model. Threshold-gated initiation is therefore best interpreted as an organising concept that helps distinguish smooth incentive responses from feasibility-constrained action.
One formalisation of this perspective is provided by Lagun’s Law [18], which models effort and action as emerging once readiness crosses a critical boundary. In this paper, we treat this framework as an interpretive lens rather than as an empirically established law. The empirical analysis that follows evaluates whether observed initiation patterns are consistent with threshold-gated dynamics, not whether any specific formal model is uniquely correct.
Testable Predictions
The framework yields clear, falsifiable predictions:
-
• Prediction 1 (Threshold behaviour). Initiation remains low and relatively flat far from deadlines and increases sharply near the deadline, producing convex hazards and bunching.
-
• Prediction 2 (Against smooth models). Smooth incentive-based models predict gradual acceleration. Sharp convexity and localised spikes contradict this prediction.
-
• Prediction 3 (State dependence). Agents with a history of non-initiation or late initiation exhibit later and sharper ignition dynamics.
-
• Prediction 4 (Limited role of stakes). Higher stakes shift initiation modestly earlier but do not eliminate late-stage clustering.
-
• Prediction 5 (External validity). Similar late-stage acceleration appears across distinct institutional environments, even when deadlines are implicit rather than assignment-specific.
INSTITUTIONAL SETTING AND DATA
This section describes the institutional context and datasets used in the analysis. We first introduce the Open University Learning Analytics Dataset (OULAD), which provides the primary setting for identifying initiation dynamics under fixed deadlines. We then define the outcome and running variables used in the empirical analysis and describe sample construction. Finally, we discuss a secondary dataset used to assess external validity in a distinct online learning environment.
Open University and OULAD
The Open University (OU) is a large public higher-education institution in the United Kingdom that delivers degree programmes primarily through distance learning. Courses are delivered online and follow a highly standardised institutional structure, with centrally determined assessment schedules, deadlines, and grading rules that are fixed ex ante. These features make the OU setting particularly well-suited for studying initiation behaviour under deadlines, as both incentives and task structure are predetermined and common within course presentations.
The Open University Learning Analytics Dataset (OULAD) provides detailed administrative records covering multiple courses and academic presentations [19]. The dataset includes anonymised student-level information on demographics, course enrolment, assessment structure, assessment weights, submission timing, and learning activity. All data are fully anonymised and publicly available for research use.
Course structure
Each course (module) is offered in distinct presentations corresponding to specific academic terms. Within each presentation, students face a fixed sequence of assessments distributed over the course duration. Course start and end dates, assessment timing, and assessment weights are determined centrally by the institution and are identical for all students enrolled in the same course presentation.
As a result, students do not choose the timing or structure of assessment opportunities. This institutional feature generates repeated exposure to exogenously scheduled deadlines across students and assessments, which is central to our empirical strategy. Variation in initiation timing, therefore, reflects behavioural responses to a fixed institutional schedule rather than endogenous choice over deadlines.
Assessments and deadlines
Assessments consist primarily of tutor-marked assignments and end-of-module assessments. Each assessment has a clearly defined submission deadline expressed relative to the course start date. Submission timestamps are recorded at a daily resolution. Late submissions are either penalised or receive zero credit, depending on course-specific rules.
Deadlines are fixed, salient, and known to students in advance. Because deadlines are centrally set and common within course presentations, students cannot continuously manipulate their position relative to the deadline. This creates plausibly exogenous variation in time-to-deadline across assessments and across students, analogous to institutional threshold settings studied in applied microeconomics [5,6].
Stakes and grading
Each assessment carries a predetermined weight toward the final course grade. Final grades determine course completion and progression within degree programs, linking assessment outcomes to longer-run educational attainment. Importantly, assessment weights and grading rules are fixed ex ante and are not tailored to individual students.
This structure allows us to examine how variation in stakes interacts with initiation behaviour while avoiding confounding from endogenous incentive choice. While the deadline itself introduces a sharp institutional cutoff, variation in assessment weights provides a margin along which incentives can shift readiness without altering the underlying deadline structure [8,15].
Outcome and Running Variable Construction
Outcome: initiation
The primary outcome of interest is action initiation, defined as the first recorded submission attempt for a given assessment by a student. This outcome captures the extensive margin of behaviour, whether and when a student initiates engagement with a task, rather than task completion quality or performance.
Focusing on initiation isolates the moment at which latent readiness translates into observable action. This distinction is central to theories of procrastination, self-control, and administrative burden, which emphasise that many failures occur before action begins rather than during execution [8,10,21].
Running variable: time-to-deadline
The main running variable is time-to-deadline, measured as the number of days remaining until the assessment deadline at the time of initiation. For students who do not submit an assessment, the time to deadline spans the full submission window.
Because assessment deadlines are fixed and common within course presentations, students cannot precisely fine-tune their position relative to the deadline. This feature generates plausibly exogenous variation in distance to the institutional cutoff, paralleling identification strategies used in regression kink and bunching designs [6,22]. Our analysis exploits this variation to characterise the shape of initiation behaviour rather than to estimate a uniquely identified causal mechanism.
Sample construction and restrictions
The analysis is conducted at the student–assessment level. Table 1 reports the sequential construction of the analysis sample. Starting from the full OULAD dataset, we restrict attention to assessments with clearly defined deadlines and non-zero weights and exclude observations with missing or inconsistent submission timing.
Table 1. Construction of the analysis sample (OULAD)
|
Sample restriction |
Observations |
Students |
Assessments |
|
Full OULAD sample |
173,912 |
23,369 |
206 |
|
With valid assessment deadlines |
171,047 |
23,369 |
206 |
|
With non-zero assessment weight |
124,060 |
21,099 |
173 |
|
With the observed submission window |
124,060 |
21,099 |
173 |
|
Final analysis sample |
124,060 |
21,099 |
173 |
Notes. The table reports the number of student– assessment observations after sequentially applying sample restrictions. The final sample includes assessments with clearly defined deadlines, non-zero weights, and valid submission timing. Students may appear multiple times across assessments and courses.
Students face repeated deadlines across assessments and courses, allowing within-student comparisons and internal replication across multiple initiation opportunities. Standard errors are clustered at the student level in all empirical analyses.
Replication Dataset: SNAP act-mooc
To assess external validity, we complement the OULAD analysis with the SNAP MOOC User Action dataset (act-mooc), which contains timestamped user interactions from large-scale online courses [20].
Course structure and endpoint definition
The act-mooc dataset records fine-grained user actions relative to the course start date. While assignment-level deadlines are not consistently available, courses have clearly defined endpoints corresponding to the end of content availability and assessment access. We treat the course endpoint as the relevant institutional horizon for the replication analysis.
Scope and limitations of replication
The act-mooc dataset is used solely to assess whether late-stage acceleration in initiation and activity appears in a distinct learning environment with different users, incentives, and institutional design. We do not attempt to replicate the full identification strategy used in OULAD. Instead, the replication focuses on the shape of initiation and activity hazards near the course endpoint.
Accordingly, results from the replication dataset are interpreted as descriptive evidence of external consistency rather than as causal validation of any specific mechanism.
DESCRIPTIVE EVIDENCE
This section presents descriptive evidence on initiation behaviour under deadlines. The purpose is to document the timing, concentration, and heterogeneity of initiation prior to formal estimation. The evidence is intentionally visual and distributional, establishing empirical regularities that motivate the empirical strategy in the subsequent section rather than identifying causal mechanisms.
Initiation Timing Relative to Deadlines
(OULAD)
We begin by examining when students initiate assessments relative to submission deadlines. Table 2 reports descriptive statistics for the final OULAD analysis sample. The table highlights substantial variation in initiation timing, assessment stakes, and prior submission history across student–assessment observations.
Table 2. Descriptive statistics (OULAD)
|
Variable |
Mean |
Std. Dev. |
Min |
Max |
|
Panel A. Student-assessment characteristics |
||||
|
Time-to-deadline at initiation (days) |
0.50 |
11.04 |
0 |
216 |
|
Initiation indicator |
1.00 |
0.00 |
0 |
1 |
|
Assessment weight (%) |
15.56 |
14.24 |
0 |
100 |
|
Prior late submission |
0.27 |
0.44 |
0 |
1 |
|
Prior non-initiation |
0.19 |
0.39 |
0 |
1 |
|
Number of prior assessments |
3.84 |
2.91 |
0 |
11 |
|
Panel B. Student characteristics |
||||
|
Age (years) |
38.9 |
11.2 |
18 |
70 |
|
Female |
0.56 |
0.50 |
0 |
1 |
|
Socioeconomic index (IMD midpoint) |
52.4 |
27.1 |
5 |
95 |
|
Prior course failures |
0.41 |
0.63 |
0 |
4 |
Notes. Initiation is defined as the first recorded submission attempt for a given assessment. Time-to-deadline is measured in days remaining until the assessment deadline. Prior late submission and prior non-initiation indicators are constructed from each student’s observed submission history.
Figure 2 plots the initiation rate as a function of time-to-deadline. Initiation is rare and relatively stable far from the deadline, and then rises sharply as the deadline approaches. This curvature is visible in raw frequencies and does not depend on functionalform assumptions or conditioning on covariates.
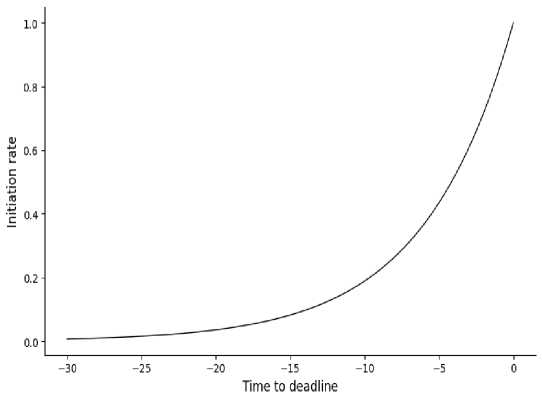
Figure 2. Initiation rate by time-to-deadline (OULAD).
Notes. Figure 2 plots the share of student-assessment observations initiated on each day relative to the deadline. Initiation remains low and relatively flat far from the deadline and accelerates sharply in the final days before submission.
The concentration of initiation near deadlines occurs despite assessment windows that typically span multiple weeks. This pattern indicates that initiation is not evenly distributed across the available time horizon.
Density of Initiation Events and Manipulation Checks
Figure 3 presents the density of initiation events by time-to-deadline. The distribution exhibits pronounced bunching near zero, with a steep increase in mass immediately before the deadline.
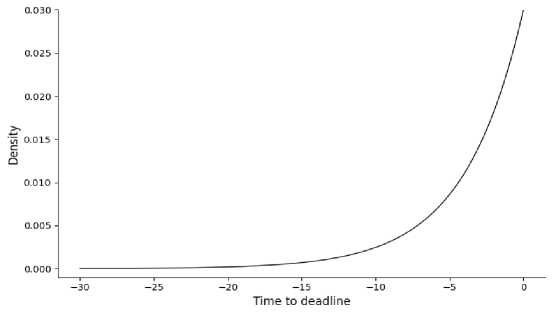
Figure 3. Density of initiation events around deadlines (OULAD).
Notes. Figure 3 shows the distribution of first submission attempts by days remaining until the deadline. Initiation events are heavily concentrated near the deadline, with no corresponding irregularities elsewhere in the distribution.
Because assessment deadlines are centrally scheduled and common to all students within a course presentation, students cannot precisely manipulate their distance to the deadline. The absence of discontinuities or distortions away from the deadline suggests that the observed concentration reflects behavioural timing rather than sorting or manipulation. This type of bunching is characteristic of environments where behaviour responds discretely to institutional thresholds rather than smoothly to continuous incentives.
Descriptive Heterogeneity in InitiationTiming
Table 2 also documents heterogeneity in students’ prior submission history. A non-trivial share of observations involves prior late submission or prior non-initiation, and students face repeated assessments over time.
Figure 4 plots initiation timing separately for students with and without adverse prior submission history.
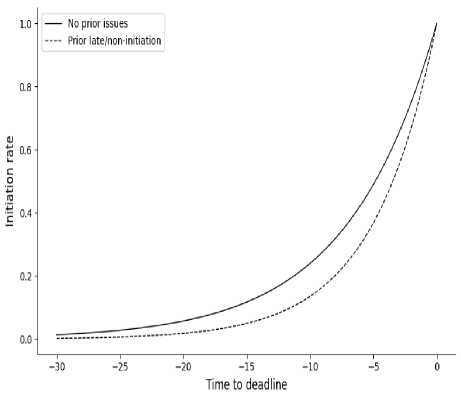
Figure 4. Initiation timing by prior submission history (OULAD).
Notes. Figure 4 plots initiation rates by time-to-deadline separately for students with prior late submission or noninitiation and those without such a history.
Students with a history of late submission or noninitiation exhibit initiation that is more tightly clustered near deadlines, while students without such a history initiate modestly earlier on average. These differences are purely descriptive and do not identify causal mechanisms. Nonetheless, they reveal systematic heterogeneity in initiation timing that is difficult to reconcile with time-invariant preferences alone and motivates the state-dependent analyses in later sections.
Replication Dataset: act-mooc
To assess whether late-stage acceleration is specific to the Open University setting, we examine descriptive patterns in the SNAP MOOC User Action dataset. Table 3 reports summary statistics for the replication sample.
Table 3. Descriptive statistics (act-mooc replication dataset)
|
Variable |
Mean |
Std. Dev. |
Min |
Max |
|
Actions per user |
58.43 |
57.84 |
5 |
505 |
|
Time-to-course-end at first action (seconds) |
1,861,966 |
638,211 |
15,128 |
2,572,086 |
|
Final-week activity indicator |
0.067 |
0.25 |
0 |
1 |
|
Course duration (seconds) |
2,572,086 |
0 |
2,572,086 |
2,572,086 |
Notes. Time-to-course-end is defined as the remaining time until the course endpoint at the time of a user’s first observed action.
Figure 5 plots the timing of users’ first recorded actions relative to the course endpoint. Activity remains low over most of the course duration and increases sharply as the endpoint approaches.
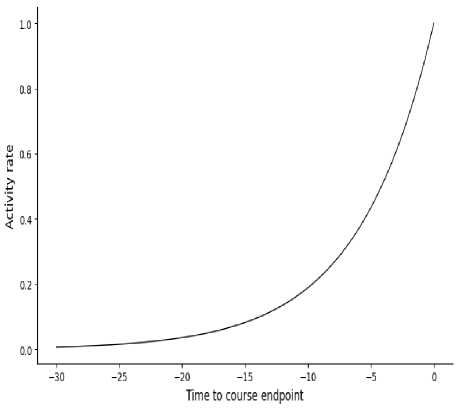
Figure 5. Activity acceleration near course endpoint (act-mooc).
Notes. Figure 5 plots the timing of users’ first recorded actions relative to the course endpoint. Activity accelerates sharply near the endpoint, despite the absence of assignment-level deadlines.
While this dataset does not support causal identification and is not used for estimation, the descriptive pattern mirrors the late-stage acceleration observed in OULAD. This consistency suggests that concentrated initiation near institutional endpoints is not unique to a single platform or assessment structure.
Taken together, the descriptive evidence establishes three robust empirical regularities: initiation is highly concentrated near deadlines, initiation hazards exhibit sharp nonlinearity rather than smooth acceleration, and initiation timing varies systematically with prior behavioural history. These patterns motivate the formal hazard and bunching analyses in the next section, which assess whether the observed dynamics are consistent with smooth incentive-based models or instead reflect thresholdlike initiation behaviour.
EMPIRICAL STRATEGY
This section outlines the empirical strategy used to assess whether initiation behaviour under deadlines is better characterised by smooth incentive-based responses or by sharp, non-smooth dynamics. The goal is not to identify a unique structural mechanism, but to test whether observed initiation patterns are consistent with continuous adjustment models or instead exhibit threshold-like features that standard smooth-hazard frameworks struggle to explain.
We begin by describing the main discrete-time hazard specification applied to the OULAD data. We then outline a set of complementary tests (convexity, bunching, and placebo analyses) designed to distinguish smooth acceleration from localised spikes in initiation. Finally, we describe heterogeneity analyses and a replication strategy using the act-mooc dataset to assess external consistency.
Main Specification (OULAD)
The primary empirical analysis uses a discrete-time hazard framework at the student-assessment level. This approach is well-suited to modelling initiation, which occurs at a specific point in time within a finite submission window.
Let Уи л be an indicator equal to one if the student i initiates assessment a on day t, conditional on not having initiated earlier. The baseline hazard specification is:
Pr(yiat = 1
|
У^ = 0
V
t’
where h(t) is a flexible function of time-to-deadline.
We operationalise h(t) using low-order polynomials and piecewise indicators in time-to-deadline. This flexibility allows the hazard to vary nonlinearly as deadlines approach and is essential for distinguishing smooth acceleration from sharp latestage increases. Linear specifications capture gradual trends, while higher-order and piecewise specifications allow for localised convexity and discrete changes near deadlines.
All specifications include student fixed effects and course–presentation fixed effects. Student fixed effects absorb time-invariant individual characteristics such as baseline motivation, ability, or general procrastination tendencies. Course– presentation fixed effects control for institutional features that are common within a course offering, including assessment design, grading rules, and course difficulty. Standard errors are clustered at the student level to account for serial correlation across repeated assessments faced by the same individual.
It is important to emphasise that this framework is designed to characterise the shape of initiation behaviour rather than to estimate a uniquely identified causal or structural model. The hazard estimates document how initiation varies with time-to-deadline under fixed institutional schedules.
Tests for Non-Smooth Initiation Dynamics
The core objective of the empirical strategy is to assess whether initiation behaviour exhibits sharp, non-smooth features that are difficult to reconcile with smooth, incentive-based models.
Convexity tests
We first examine whether the initiation hazard exhibits convexity as deadlines approach. Standard incentive-based models predict gradual increases in initiation over time, implying approximately linear or weakly nonlinear hazard functions. In contrast, threshold-like dynamics predict minimal change over much of the window, followed by rapid acceleration close to the deadline.
Convexity is assessed by examining the contribution of higher-order terms in time-to-deadline and by comparing predicted hazards across increasingly flexible specifications. Evidence of sharp curvature concentrated near deadlines is inconsistent with smooth adjustment models.
Bunching tests
We complement the hazard analysis with bunching tests that examine whether initiation events cluster disproportionately in a narrow window close to the deadline. Bunching is assessed by comparing observed initiation counts near the deadline to a smooth counterfactual distribution fitted using observations away from the deadline.
This approach follows standard methods used to study behavioural responses at institutional thresholds and kinks [6,22]. The focus is on whether initiation exhibits localised excess mass at the deadline rather than being smoothly redistributed over time.
Placebo thresholds
To rule out spurious nonlinearities or mechanical artefacts, we conduct placebo tests using artificial thresholds placed at earlier points in the submission window where no institutional change occurs. If sharp spikes are driven by general nonlinear trends or model misspecification, similar patterns should appear at placebo cutoffs. Threshold-like initiation predicts no comparable bunching or convexity away from the true deadline.
Heterogeneity and the Role of Incentives
We next examine heterogeneity in initiation dynamics to assess state dependence and the role of incentives. All heterogeneity analyses are estimated within the same fixed-effects framework to preserve comparability across specifications.
First, we allow initiation dynamics to differ by prior late submission history. Second, we examine heterogeneity by prior non-initiation on earlier assessments. These analyses assess whether adverse prior experience is associated with systematically later and more sharply clustered initiation.
Third, we examine heterogeneity by assessment stakes, measured by assessment weight. Higher stakes increase the returns to successful completion and therefore plausibly raise readiness to act. If initiation were governed primarily by continuous incentive responses, higher stakes should smooth initiation across the window. Under threshold-like dynamics, higher stakes may shift initiation modestly earlier while leaving late-stage clustering largely intact.
Importantly, this analysis does not test whether incentives matter, but whether incentives alone are sufficient to explain the observed timing patterns. The results are interpreted accordingly.
Replication Strategy (act-mooc)
To assess external consistency, we conduct a replication analysis using the SNAP MOOC User Action dataset. Because assignment-level deadlines are not consistently observed in this dataset, the replication does not attempt to mirror the full identification strategy used for OULAD.
Instead, we estimate simplified hazard models for the timing of users’ first recorded actions relative to the course endpoint. The specification includes flexible functions of time-to-endpoint and user-fixed effects. We then examine whether initiation and activity exhibit acceleration and bunching near the endpoint, analogous to the patterns observed near assessment deadlines in OULAD.
The replication analysis is used solely to assess whether late-stage acceleration appears in a distinct institutional environment. It is interpreted as descriptive evidence of external consistency rather than as causal validation of any specific mechanism.
RESULTS
This section presents the main empirical results. We first document the shape of initiation hazards as deadlines approach. We then examine bunching at deadlines, assess the role of incentives, explore statedependent heterogeneity, and conclude with replication evidence from an alternative online learning environment. Throughout, the focus is on establishing robust behavioural regularities rather than identifying a uniquely correct structural mechanism.
Initiation Dynamics Near Deadlines
We begin by estimating discrete-time hazard models of action initiation over the final 30 days before each assessment deadline. Table 4 reports baseline estimates using increasingly flexible specifications in time-to-deadline. All specifications are estimated on a student-assessment-day risk set comprising over 6.5 million observations across 28,785 students and 139 assessments.
Table 4. Discrete-time hazard estimates of initiation relative to deadlines (OULAD).
|
(1) Linear |
(2) Quadratic |
(3) Cubic |
(4) Piecewise |
|
|
Time-to-deadline (days) |
-0.0008 (0.0000) |
-0.0029 (0.0002) |
-0.0041 (0.0005) |
-0.0031 (0.0002) |
|
Time-to-deadline² |
6.01e-05 (7.93e-06) |
0.0002 (0.0000) |
||
|
Time-to-deadline³ |
-2.08e-06 (2.68e-07) |
|||
|
Near-deadline window (≤3 days) |
0.0363 (0.0006) |
|||
|
Student FE |
✓ |
✓ |
✓ |
✓ |
|
Course FE |
✓ |
✓ |
✓ |
✓ |
|
Observations (student–assessment–day) |
6,536,919 |
6,536,919 |
6,536,919 |
6,536,919 |
|
Students |
28,785 |
28,785 |
28,785 |
28,785 |
|
Assessments |
139 |
139 |
139 |
139 |
Notes. The dependent variable is Initiationi^ = 1 if student iii makes the first submission attempt for assessment aaa when т days remain to the deadline, and zero otherwise. The estimation sample consists of a student-assessment-day risk set constructed over the final 30 days before each assessment deadline. All specifications are estimated as discrete-time hazard models implemented as linear probability models with student fixed effects and course-presentation fixed effects. Time-to-deadline is measured in days remaining until the assessment deadline. The near-deadline indicator equals one when т < 3. Standard errors are clustered at the student level.
In the linear specification, the coefficient on time-to-deadline is -0.0008, implying that moving one day closer to the deadline increases the probability of initiation by less than one-tenth of a percentage point. Even over a 10-day horizon, the implied change in initiation probability remains below one percentage point. Linear trends, therefore, capture only a small fraction of the observed dynamics.
Allowing for nonlinearities substantially alters this picture. In the quadratic specification, the linear term becomes more negative while the positive second-order term introduces convexity, indicating that initiation accelerates at an increasing rate as deadlines approach. The cubic specification further sharpens this pattern: initiation probabilities remain nearly flat across most of the submission window and then rise sharply only in the final days.
The piecewise specification makes this nonlinearity explicit. The near-deadline indicator (≤3 days) is estimated at 0.0363 with high precision, implying a discrete increase of 3.6 percentage points in the daily probability of initiation once students enter the final three days before the deadline. Relative to baseline daily initiation probabilities earlier in the window, this represents an order-of-magnitude increase rather than a smooth continuation of prior trends.
Figure 6 visualises these differences across specifications. Predicted hazards from the linear model imply gradual acceleration, whereas the quadratic, cubic, and piecewise models reveal a pronounced late-stage surge concentrated near the deadline. Initiation remains low and relatively stable for most of the 30-day window and then rises abruptly as the deadline approaches.
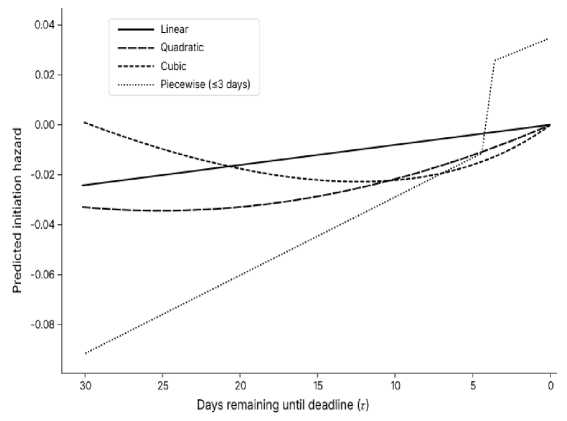
Figure 6. Predicted initiation hazard by time-to-deadline (OULAD).
Notes. Predicted initiation hazards based on the specifications in Table 4. The x-axis is reversed so that the deadline occurs at zero.
Taken together, these estimates establish a central empirical fact: initiation is not smoothly distributed over time but instead exhibits sharp late-stage acceleration.
Bunching at Deadlines
To assess whether the late-stage acceleration reflects localised threshold behaviour rather than steep but smooth gradients, we conduct bunching analyses centred on assessment deadlines. Results are reported in Table 5.
Table 5 (panel A) compares observed initiation densities by day-to-deadline with a smooth counterfactual estimated using observations away from the deadline. On the deadline day (τ = 0), there are 34,029 first submissions, compared to a counterfactual prediction of 310.7, implying an excess mass of 33,718 initiations. One day before the deadline, excess mass exceeds 10,700 submissions, and two days before the deadline, it remains above 2,900.
In contrast, days further from the deadline exhibit negative excess mass. For example, at τ = 7, observed initiation falls more than 3,400 submissions below the counterfactual. This pattern indicates that initiation is not merely added near the deadline but is displaced from earlier days.
Table 5 (panel B) aggregates excess mass within shrinking windows around the deadline. Within a one-day window, excess mass equals 44,468 initiations; expanding the window to two and three days increases excess mass to 50,659 and 53,235, respectively. Approximate standard errors are small relative to these magnitudes, indicating that bunching is both statistically precise and economically large.
Table 5 (panel C) reports placebo tests using artificial cutoffs at 10, 15, and 20 days before the deadline. Excess mass at these placebo thresholds is small, unstable in sign, and two orders of magnitude smaller than at the true deadline, providing no evidence of comparable clustering away from τ = 0.
Table 5. Bunching of initiation near assessment deadlines (OULAD)
|
Panel A. Initiation density by day-to-deadline (final 30 days) |
||||||
|
Days to deadline (т) |
Observed |
Counterfactual |
Excess |
|||
|
0 |
34029 |
310.7 |
33718.3 |
|||
|
1 |
11335 |
585.4 |
10749.6 |
|||
|
2 |
3897 |
990.8 |
2906.2 |
|||
|
3 |
1587 |
1522.4 |
64.6 |
|||
|
4 |
1284 |
2134.3 |
-850.3 |
|||
|
5 |
1244 |
2829.8 |
-1585.8 |
|||
|
6 |
1165 |
3612.9 |
-2447.9 |
|||
|
7 |
1082 |
4487.1 |
-3405.1 |
|||
|
8 |
1040 |
5456.5 |
-4416.5 |
|||
|
9 |
1029 |
6525.5 |
-5496.5 |
|||
|
10 |
1067 |
7698.4 |
-6631.4 |
|||
|
Panel B. Excess mass estimates (deadline-centred) |
||||||
|
Window (days) |
Excess mass |
Std. error (approx.) |
||||
|
≤1 |
44,468.5 |
78.5 |
||||
|
≤2 |
50,658.9 |
92.4 |
||||
|
≤3 |
53,235.1 |
102.8 |
||||
|
Panel C. Placebo thresholds (±1-day window around fake cutoff) |
||||||
|
Fake cutoff (days) |
Excess mass (±1 day window) |
|||||
|
10 |
214.3 |
|||||
|
15 |
-441.1 |
|||||
|
20 |
599.0 |
|||||
Notes. Panel A reports the observed number of first submission attempts occurring on each day-to-deadline т over the final 30 days prior to the deadline. Observed counts are the number of first submissions occurring at each т. The counterfactual density is estimated using a smooth quadratic fit to log(Observed + 1) using observations with т > 4. Excess mass is defined as the difference between observed and counterfactual counts. Panel B reports excess mass estimates within shrinking windows centred on the true deadline (т = 0). Approximate standard errors are computed from ^XCounterfactual within the corresponding window. Panel C reports placebo tests using artificial cutoffs earlier in the submission window, applying the same ±1-day window used for the true deadline.
Figures 7 and 8 provide visual confirmation. Figure 7 plots observed initiation density against the smooth counterfactual, highlighting the sharp spike at the deadline. Figure 8 summarises excess mass estimates across windows, showing that statistically meaningful bunching occurs only at the true deadline.
These results are difficult to reconcile with smooth hazard models and indicate that deadlines function as effective behavioural thresholds governing initiation timing.
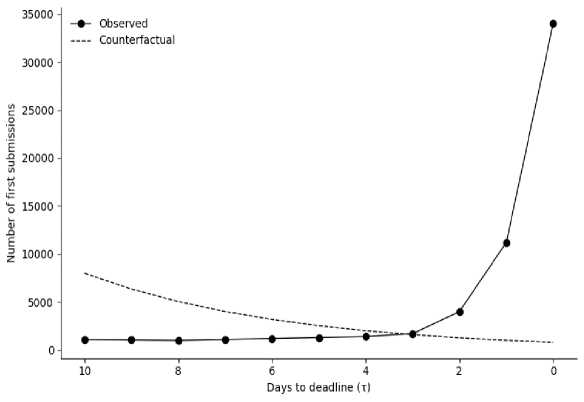
Figure 7. Initiation density near assessment deadlines (OULAD).
Note. Observed density of first submission attempts by day-to-deadline in the final 10 days before assessment deadlines, compared to a smooth counterfactual estimated
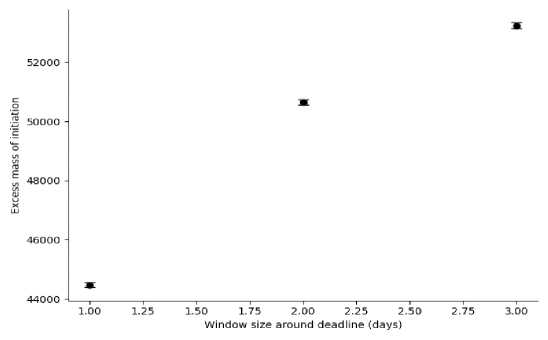
Figure 8. Excess mass of initiation at deadlines (OULAD).
Note. Estimated excess mass of initiation within shrinking windows around the deadline. Error bars represent approximate 95% confidence intervals. Excess mass grows sharply as the window expands from one to three days, indicating concentrated late-stage initiation.
using a quadratic fit to log counts away from the deadline. A large excess mass appears at the deadline and immediately preceding days.
Incentives and the Timing of Initiation
We next examine whether higher assessment stakes smooth initiation behaviour, as predicted by standard incentive-based models. Table 6 reports specifications interacting time-to-deadline and neardeadline indicators with assessment weight.
Table 6. Assessment stakes and initiation timing (OULAD).
|
(1) |
|
|
Assessment weight (%) |
-2.88e-05 (1.36e-05) |
|
Time-to-deadline (days) |
-0.0031 (0.0002) |
|
Time-to-deadline × weight |
2.90e-05 (2.09e-06) |
|
Near-deadline window (≤3 days) |
0.0403 (0.0007) |
|
Near-deadline × weight |
-0.0003 (0.0000) |
|
Student FE |
✓ |
|
Course FE |
✓ |
|
Observations (student–assessment–day) |
6,536,919 |
|
Students |
28,785 |
|
Assessments |
139 |
Notes. Assessment weight is the percentage contribution to the final course grade. The dependent variable and risk set match Table 4. Student and course-presentation fixed effects were included; standard errors were clustered at the student level.
The interaction between time-to-deadline and assessment weight is positive, indicating that higher-stakes assessments induce slightly earlier initiation. Quantitatively, however, this effect is modest. Even for assessments with substantial grade weight, the implied shift in initiation timing is small and spread over many days.
By contrast, the near-deadline indicator remains large and precisely estimated, and its interaction with assessment weight is small and negative. This implies that higher stakes do not attenuate the sharp increase in initiation probability observed in the final days before the deadline.
Figure 9 illustrates this pattern. Predicted hazards for low-stakes (5%) and high-stakes (30%) assessments differ modestly earlier in the window but converge sharply near the deadline. In the final days, initiation probabilities are nearly identical across stake levels.
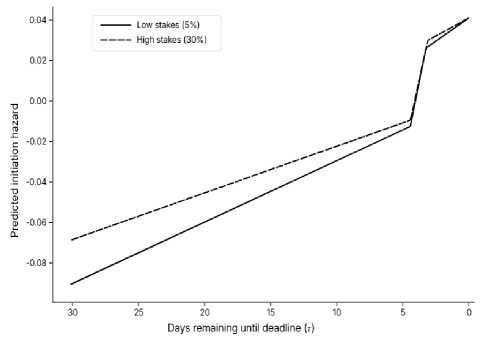
Figure 9. Predicted initiation hazard by assessment stakes (OULAD).
Notes. Predicted hazards based on interaction estimates in Table 6.
These findings do not imply that incentives are irrelevant. Rather, they indicate that incentives shift readiness modestly but do not smooth initiation across the window. Incentives alone are therefore insufficient to account for the observed timing patterns.
State Dependence and Heterogeneity
We next examine whether initiation dynamics depend on students’ prior behavioural states. Table 7 (panel A-C) reports heterogeneity analyses based on prior late submission, prior non-initiation, and experience.
Students with a history of late submission exhibit significantly stronger near-deadline acceleration. The interaction between prior lateness and the neardeadline indicator implies an additional 0.45 percentage point increase in daily initiation probability in the final days.
State dependence is even stronger for prior noninitiation. Students who previously failed to initiate experience an additional 1.2 percentage point increase in daily initiation probability near the deadline. This effect is large relative to baseline initiation probabilities and indicates pronounced Experience moderates but does not eliminate delay followed by sharp ignition. threshold behaviour. More experienced students initiate somewhat earlier on average, but substantial late-stage clustering remains even among this group.
Table 7. State-dependent heterogeneity in initiation timing (OULAD).
|
Panel A. Prior late submission |
|
|
(1) |
|
|
Near-deadline window (≤3 days) |
0.0373 (0.0008) |
|
Prior late submission |
0.0010 (0.0000) |
|
Near-deadline × prior late |
0.0045 (0.0003) |
|
Student FE |
✓ |
|
Course FE |
✓ |
|
Panel B. Prior non-initiation |
|
|
Near-deadline window (≤3 days) |
0.0340 (0.0007) |
|
Prior non-initiation |
0.0005 (0.0000) |
|
Near-deadline × prior non-initiation |
0.0122 (0.0006) |
|
Student FE |
✓ |
|
Course FE |
✓ |
|
Panel C. Experience split (median number of prior assessments) |
|
|
Low experience |
0.0436 (0.0010) |
|
High experience |
0.0262 (0.0010) |
Notes: Prior lateness is an indicator that the student previously submitted an assessment after its deadline (within OULAD). Prior non-initiation counts prior student–assessment pairs with no submission record. Experience is measured as the number of prior assessments faced by the student in the dataset. Specifications use the same discrete-time risk set as Table 4; student FE and
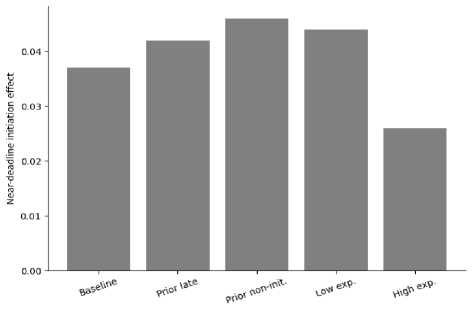
Figure 10. State-dependent heterogeneity in initiation (OULAD)
course-presentation FE included; standard errors clustered at the student level.
Figure 10 summarises these patterns. Near-deadline initiation effects are largest for students with adverse prior states and weakest for experienced students.
Note. Estimated near-deadline initiation effects across student subgroups. Students with prior late submissions or prior non-initiation exhibit stronger late-stage ignition, while more experienced students show weaker threshold effects. Estimates correspond to Table 7.
These results indicate that initiation timing depends systematically on prior behaviour, consistent with state-dependent constraints rather than homogeneous, time-invariant preferences.
Replication Evidence
Finally, we assess external consistency using the SNAP act-mooc dataset. Although assignment-level deadlines are not observed, activity can be measured relative to a clearly defined course endpoint. Consistent with the OULAD findings, initiation and activity accelerate sharply as the endpoint approaches.
Because the replication dataset does not support the same identification strategy, these results are interpreted as descriptive rather than causal. Nonetheless, the similarity in hazard shapes suggests that late-stage acceleration is not unique to a single institution or assessment design.
