Potential halal tourism destinations with applying K-Means clustering

Author: Qurrotul Aini, Eva Khudzaeva
Journal: International Journal of Intelligent Systems and Applications @ijisa
Article in issue: 9 vol.11, 2019.
Free access
The clustering application can be used to develop a variety of tourism potential. Currently, halal tourism is a national income that increases every year and is a favorite for Indonesia. The development of halal tourism is supported by a majority population Muslim and as a halal tourist destination in the world. The objective of this study is to investigate the number of clustering with partitioning approach i.e. K-Means (KM) with two simulation scenarios. The characteristics similarity of this method refers to 11 indicators in 2017 Global Muslim Travel Index (GMTI). The output of this study is to display the information in the form of a map and make it easier for the public to determine which halal tourism destinations are high, medium, and low potential.
Halal tourism, K-means, clustering, partitioning approach
Short address: https://sciup.org/15016619
IDR: 15016619 | DOI: 10.5815/ijisa.2019.09.02
Text of the scientific article Potential halal tourism destinations with applying K-Means clustering
Published Online September 2019 in MECS
Index Terms—Halal tourism, K-means, clustering, partitioning approach.
-
I. Introduction
Indonesia is the world's largest archipelago country with 5.8 million km2 of marine territorial that comprising 3.1 million km2 of Indonesia's territorial waters and 2.7 million km2 of exclusive economic zone marine waters [1]. Indonesia is the fourth largest population in the world around 264 millions makes the enormous potential of the country in economic growth and civilization [2]. The number of Muslims in Indonesia is 78.4% of the total population. Some areas with the largest Muslim population could be developed as potential Muslim tourist sites, which have supported the facilities and infrastructure of Muslim activities. Nowadays, Lombok island is declared as 'halal tourism' in Indonesia. To increase economic growth, another area has the potential to be developed as 'halal tourism' destination and become more diverse. It shown in Fig. 1, where income from the tourism sector from 2015 to 2018 has increased, as well as predictions for 2019 will also increase.
As the Muslim population reaches 207 million in Indonesia, the need for information on halal products and services is a priority. One of the services that demand to be considered is information on halal tourism destinations. Therefore, a lot of tourism destinations that exist; it is necessary to classify according to the characteristics of each destination whether by the sharia principle and 11 indicators of the Global Muslim Travel Index (GMTI). In
2017, Indonesia becomes the third rank in the world [3] as ‘Halal Tourism Destination.’ This position is increased a year before in fourth place after Malaysia, United Arab Emirates, and Turkey [4].
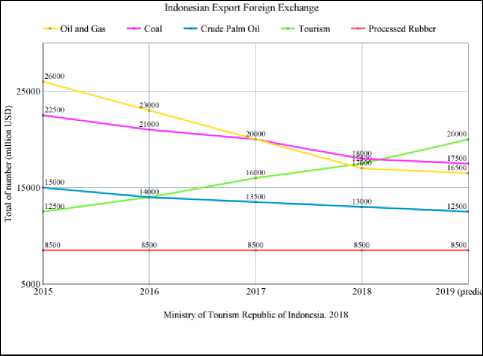
Fig.1. Tourism devisa is increasing every year compare with others [5]
The need and demand of consumers/markets globally have encouraged the establishment of a halal tourism industry. Even non-muslim majority countries have been interested in working in this sector. In GMTI, there are three groups of Halal tourism criteria, namely:
-
- family friendly destinations;
-
- services and facilities in a Muslim-friendly
destination;
-
- awareness of halal and destination marketing.
Prior research has been conducted before, for instance, [6] investigated to map tourism destinations, in particular five countries in the Asia Pacific, namely Hong Kong, Singapore, Indonesia, Philippines and Cambodia based on the development of tourism destinations and economic growth. The study stated that the five countries were included in different groups. Hong Kong is in the highest position because it has the highest profitability growth in tourism, which is close to Singapore's position. While Cambodia, Indonesia and Philippine are in the other group.
This study aims to investigate the potential of halal tourism destinations in particular Jawa and Sumatera islands by grouping them using the KM method thus it can be seen which halal tourism destinations are the top priority, medium and less. The remainder of the paper is organized as follows: in Section 2, we present a literature review in particular halal tourism and clustering approach. Meanwhile, the next is Section 3, and we describe the research method in detail. Simulation and results are presented in Section 4. Section 5 presents a discussion and the last, Section 6 is a conclusion of this study.
-
II. Basic Theory
This section explains the literature that relates directly and supports this study. In general, it is divided into three domains, i.e halal tourism, clustering methods, and related work. Studies refer to books, journal articles, and conferences. The goal of this literature review is to enrich knowledge and the position of this research in tourism destinations.
-
A. Halal Tourism
Sharia tourism is an activity supported by a variety of facilities and services provided by the community, entrepreneurs, government, and local governments that fulfill sharia provisions [7]. Halal tourism is a new concept of tourism. This is not religious tourism like Umrah and Hajj. Halal tourism is a tourism that serves holidays, by adjusting the holiday style according to the needs and requests of Muslim travelers. In this case, hotels that carry sharia principles do not serve alcoholic beverages and have separate swimming pools and spa facilities for men and women [8].
Halal tourism or sharia tourism has been introduced since 2000 at the meeting of the Organization of Islamic Cooperation (OIC). Halal tourism is a market/consumer demand based on the lifestyle of Muslim tourists during the holidays. Other criteria are flexible, rational, simple and balanced tourism. Tourists are motivated to get happiness and blessings from Allah SWT [9]. The definitions of tourism as stated in Qur'an are as follows:
-
• Hijjah is a trip and pilgrimage to Makkah. This trip is a requirement for every healthy adult Muslim, at least once in a lifetime to do the Hajj.
-
• Zejara is a visit to other holy places.
-
• Rihlah is a journey for other reasons, such as education and trade.
The focus of attention is on directed activities as a component of spiritual journey simply because of Allah SWT. Sharia is a law that determines what is acceptable (halal) and what is unacceptable (haram) in daily life and during the journey [10]. According to [10], there are eight factors that measure halal tourism standards in terms of administration and management for all tourists with the following characteristics:
-
• Services to tourists must be in accordance with Muslim principles as a whole;
-
• Guides and staff must have discipline and respect for Islamic principles;
-
• Arrangement of all activities so as not to conflict with Islamic principles;
-
• Buildings must be in accordance with Islamic principles;
-
• Restaurants must follow international standards of halal service;
-
• Transportation services must have protection system security;
-
• Availability of places for all Muslim tourists to carry out religious activities;
-
• Visits to places that do not conflict with Islamic principles.
Based on the characteristics of sharia tourism described by ref. [11], four important aspects below must be considered to support a halal tourism, i.e:
-
• Location
The implementation of the sharia system in the tourist area must be taken into account. The Islamic rules permit the chosen tourist location that can enhance the spiritual values of tourists.
-
• Transportation
The application of a system such as the separation of seats between non-mahram (unrelated) men and women must be run so that Islamic law continues and tourists are comfortable.
-
• Consumption
Islam is very concerned about aspects of halal consumption; it is stated in Q.S Al-Maidah verse 3. The halal aspects here are both of their nature, acquisition and processing. In addition, a study shows that tourist interest in food plays a central role in choosing tourist destinations [12].
-
• Hotels
All work processes and facilities provided run in accordance with sharia principles. According to ref. [13], the service here is not limited to the scope of food or drinks, but also in the facilities provided such as spa, gym, swimming pool, living room and functional for men and women should be separate.
Refer to [14], the Indonesian tourism is classified in three things, i.e.:
-
a . Nature (35%) which includes marine, eco-tourism, adventure;
-
b . Culture (60%) which includes history and religious, culinary and shopping, country and city.
-
c . Human-made (5%) which includes events, sport, and resort.
-
B. Indicators for Halal Tourism
Why is the need for halal tourism so important today? The need and demand of consumers/markets globally have encouraged the establishment of a halal tourism industry. Even non-muslim majority countries have been interested in working in this sector. Other competitive indicators are conceived in Indonesia Muslim Travel Index (IMTI) or Japan Muslim Travel Index (JMTI). All of these institutions/authorities issue the guidelines/benchmarks to measure halal tourism quality and quantity in the form of an index. In GMTI, there are three groups of Halal tourism criteria, namely: [15]
-
• Family-friendly holiday and safe travel
destinations;
-
• Muslim-friendly services and facilities at
destination;
-
• Halal awareness and destination marketing.
These three criterias can be spelled out in 11 indicators. First criteria, it covers family-friendly destinations, muslim traveler and general safety, and the number of muslim tourists arriving. While the second, it covers dining options and halal assurance, access to prayer places, aiport facilities, and accomodation options. Finally, the third criteria encompass ease of communication, Muslim travel needs, awareness and outreach, air connectivity, and visa requirements [15]. All indicators is depicted in Fig. 2.
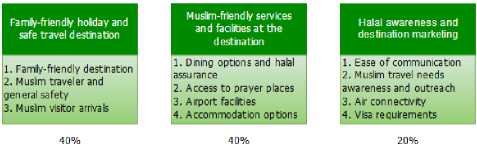
Fig.2. GMTI indicators consist of three parts, (1) family-freiendy holiday and safe travel desination; (2) Muslim-friendly services and facilities at the destination; and (3) halal awareness and destination marketing [15].
-
C. Clustering Approach
The clustering method can generally be divided into two, hierarchical clustering and partitional clustering [16]. In addition, there are also density-based and grid-based methods which are also often applied in clustering implementation. Here's the explanation:
-
1) Hierarchical clustering
In hierarchical clustering, data is grouped through a chart in the form of a hierarchy, where there is a combination of the two groups closest to each iteration or the division of all data sets into clusters. It is shown in Fig. 3. Steps to do hierarchical clustering:
-
• Identify items with the closest distance
-
• Combine the items into one cluster
-
• Calculate the distance between clusters
-
• Repeat from the beginning until everything is connected
-
2) Partitional Clustering
In partitional clustering, data is grouped into a number of clusters without any hierarchical structure between one another. In the partitional clustering method, each cluster has a cluster center point (centroid) and in general, this method has an objective function that is minimizing distance (dissimilarity) from all data to the center of each cluster. Examples of partitional clustering methods: KM, Fuzzy C-Means (FCM) and Mixture Modeling (Fig. 4).
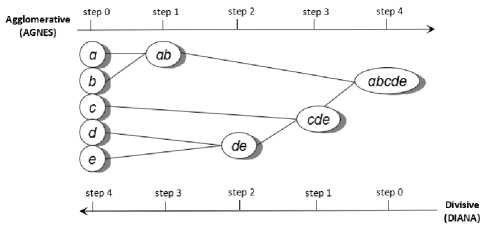
Fig.3. The steps are conducted at the hierarchical clustering. Step 0 is input data a and b , then grouped into one into ab . In Step 2, other entries d and e are grouped into de . Whereas in Step 3, data c is combined with de . Also, Step 4, the data is arranged between ab and cde [17]
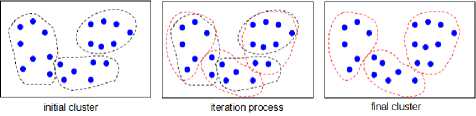
Fig.4. KM clustering process is divided into three parts [17]
Clustering is a method of grouping based on the size of closeness (similarity). Clustering is different from the group. The group means having the same conditions, if it is not; it certainly is not its group. But the cluster does not have to be the same, the grouping is based on the proximity of an existing sample characteristic, one of them is by using the Euclidean distance formula. There are so many cluster applications since it is not always exactly the same when identifying problems or making decisions. It only tends to have similarities [18].
Clustering is one of the unsupervised data mining methods meaning that the characteristics of each cluster are not predetermined but based on the similarity of the attributes of a group or cluster. Clusters divide data into groups or clusters based on a similarity of attributes among a set of data, similar attributes are represented as points in a multidimensional space. In data mining, there are two types of clustering methods used in grouping data, hierarchical clustering and non-hierarchical clustering [19]. Clustering is a method of grouping data. According to [16], clustering is a process to group data into several clusters or groups so that data in one cluster has a maximum level of similarity and data between clusters has a minimum similarity.
Clustering is the process of partitioning a set of data objects into subsets called clusters. Objects in clusters are similar in characteristics to each other and different from other clusters. Partitions are not done manually but by using a clustering algorithm. Therefore, clustering is very useful and can find unknown groups in the data. Clustering is widely used in various applications such as business intelligence, image pattern recognition, websearch, biology field, and security. In business intelligence, clustering can manage many customers into many groups for example, grouping customers into clusters with strong similarity characteristics. Clustering is also known as data segmentation because it partitions many data sets into many groups based on their similarity. In addition, it can also be an outlier detection.
There are some benefits of clustering, i.e.:
-
• A data segmentation method useful in predicting and analyzing certain business problems for examples, market segmentation, marketing, and zoning mapping of the region.
-
• Identification of objects in various fields such as computervision and image processing
The clustering method must also be able to measure its own ability in an effort to find a hidden pattern in the data being studied. There are various methods that can be used to measure the value of similarity between objects being compared. One of them is the weighted Euclidean distance. Euclidean distance calculates the distance of two points by knowing the value of each attribute on both points (Eq. 1).
N f ( v 1, v 2) = ∑ ( v 1( k ) - v 2( k ))2 (1)
k = 1
with v 1 and v 2 as two vectors whose distance will be calculated and N denotes the length of the vector. Distance is a commonly used approach to determine the similarity or inequality of two feature vectors expressed by ranking. The smaller the ranking value produced, the higher the similarity between the two vectors.
According to [17], the requirements and challenges that must be met by a clustering algorithm are:
-
1. Scalability: a clustering method must be able to handle large amounts of data. Currently large amounts of data are very commonly used in various fields such as a database. A large size database not only contains hundreds of objects but
-
2. Analytical ability of various forms of data: clustering algorithms must be able to be implemented in various forms of data such as nominal, ordinal and combined data.
-
3. Finding clusters with unexpected shapes: many clustering algorithms that use Euclidean or Manhattan methods with rounded results even though the results of clustering can be odd and not the same between one another. Therefore we need the ability to analyze clusters of any kind.
-
4. Ability to handle noise: data is not always in good condition. There are times when there is corrupt, incomprehensible or missing data. Because of this system, a clustering algorithm is required to be able to handle damaged data.
-
5. Sensitivity to changes in inputs: changes or additions to the input data can cause changes to existing clusters that can even cause striking changes when using a clustering algorithm that has a low sensitivity level.
-
6. Ability to do clustering for high dimensional data: a group of data can contain many dimensions or attributes. For this reason, clustering algorithms capable of handling data with large amount of dimensions are needed.
-
7. Interpretation and usability: the results of
also contains more than millions of objects.
clustering must be interpreted and can be benefited.
-
D. K-Means (KM)
KM method is the most simple and common clustering method because it has the ability to group large amounts of data with fast and efficient computing time. KM is one of the clustering algorithms with centering method. The KM algorithm in its application requires three parameters that are entirely user-defined, namely the number of cluster k , cluster initialization, and system distance. Usually KM is run independently with different initialization resulting in different final clusters because this algorithm principally only groups data towards local minimum. One way to overcome the local minimum is to implement the KM algorithm, for k given, with several different initial partition values and then partition with the least squares error [20].
KM is a technique that is quite simple and fast in object clustering process (clustering). It defines the centroid or cluster center of the cluster to be the average point of the cluster. In applying the algorithm, if given a set of data X = {x1, x2, ..., xn} with xi = (xi1, xi2, ..., xin) is a system in real space Rn, then the KM algorithm will compile partition X in a number of k clusters (a priori). Each cluster has a midpoint (centroid) which is the mean value of the data in the cluster. The initial stage of the KM algorithm is to randomly select the object as a centroid in the data. Then, the distance between the object and centroid is calculated using the Euclidean distance. The KM algorithm iteratively increases the variation of values in each cluster where the next object is placed in the closest group, calculated from the midpoint of the cluster. The new midpoint is determined if all data has been placed in the closest cluster. The process of determining the midpoint and placement of data in clusters is repeated until the midpoint value of all formed clusters does not change anymore. The following description is steps in KM algorithm: [17]
Step 1: Determine how many clusters k from the dataset to be divided.
Step 2: Specify data k to be the center of the beginning of the cluster location.
Step 3: Find the nearest cluster center for each data. Thus it means that each cluster center has a subset of datasets, so that it represents part of the dataset. Therefore, cluster k has been formed: C 1, C 2, C 3, ..., C k.
Step 4: Find the center of the cluster area for each cluster, and update the location of each cluster center to the new value from the center area.
Step 5: Repeat steps 3 and 5 until the data in each cluster becomes centralized or completed.
-
III. Related Work
To date, several studies have investigated and explored KM clustering. KM clustering is applied and developed in many domains, for instance in image segmentation and text. Ref. [21] introduced a grid-based KM algorithm for image segmentation. This algorithm is based on the benchmark dataset by taking advantage of the existing KM algorithm and the index maximizing the gray difference between investigated objective gray and background gray. This study also validates the effectiveness of the index proposed by the image results that are consistent with the visual perception of the dataset.
Ref. [22] offers a system that combines image-based techniques, color analysis, and data mining. The design includes segmentation and grid modules, feature extraction, KM algorithm, and k-nearest neighbor clustering and environment modules. The concept of environmental color analysis is also applied to each side of the image grid. This system is tested on many images and can work well in training. Furthermore, [23] offers the procedure to improve the image segmentation. First, the KM clustering algorithm is applied to the input image. Second, the results of previous step are provided as input for the neutrosophic set by defining the neutrosophic domain. Then, neutrosophy was introduced to image segmentation by calculating the values of truth, falsity and indeterminacy each of pixels in the image. The KM grouping algorithm applies neutrosophic logic, implemented to minimize pixel uncertainty. The resulting cluster is then iteratively improved to create images that are fit for segmentation. The results of the proposed method explain that it can be used to get better results on synthetic images and real images.
Meanwhile [24] introduced a scheme for extracting similar groups of articles based on keyword sets using a Term Frequency-Inverse Document Frequency (TF-IDF). Then it is difficult to apply this scheme to clustering methods such as Hierarchical, KM and Fuzzy C-Means (FCM). As a result, it is proven that FCM grouping is better than hierarchical and KM. The article classification domain is based on the grouping approach that assists improve search efficiency and reduce search time. The text features can be extracted automatically using natural language processing or information extraction tools can be used. Also [25] introduce a rule to match the processing time and the clarification quality of KM cluster algorithms when implemented to cases where the number n of objects is big. The most of the known strategies intended to improve the performance of KM algorithms are linked to the initialization or classification steps. In opposite, the rule applies in the convergence step and they prove with computer simulation to find the threshold value and also found out the quality reduction of this method.
-
IV. Simulation and Results
-
A. Framework and Scenario
The simulations are carried out in accordance with framework and scenario that was previously made. The framework to cluster the destination halal tourism is shown in Fig. 5. The data is collected in five provinces in Indonesia, i.e. DKI Jakarta, West Sumatera, Great Malang, Riau islands, and Aceh. We collect 54 data of destination halal tourism which spread in Sumatera and Java islands. After that, we conduct scoring and gather in format xls and csv (Fig. 6).
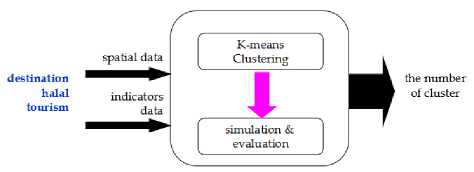
Fig.5. The clustering framework is divided into three parts. First, input side which contains spatial and indictors data. Second, the process part, which apply KM in simulation and analysis the result in evaluation. And the last part, its the outcome i.e. the number of clusters.
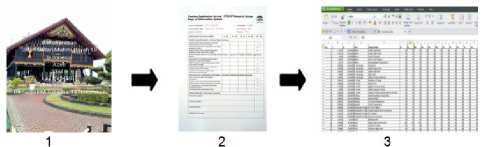
Fig.6. Data collection is conducted in three steps. First, we survey to halal tourism destination which recommended by Ministry of Touris. Second, we score the indicators each destination. Third, we record the data in format xls or csv.
In the simulation, we have two scenarios to visualize the clustering. First, we upload and display the Indonesian map. Then we are mapping the spatial coordinates of each halal tourism destination (Fig. 7). After that we set first the number of clusters equal to 3, then the data for 11 indicators (Table 1) for each of destinations are grouped by the KM method by setting the weight of family-friendly holiday (FF), save travel (SF), and a number of muslim visitor (MV) indicators are 20%, the weight of dining option (DO), ease of prayer access (EO), muslim facilities (MF), and adequate accommodation (AA) are 40%. Also, its the same with ease of communication (EC), reach out (RO), air transportation (AT), and visa requirement (VR) have weight 40%. This part has outcome the clustering based only the distance. The second part, the initial process is similar to the first, then, we continue by displaying each cluster allowing for tourism destinations to be recommended according to the value of their indicators in three level of potentials.
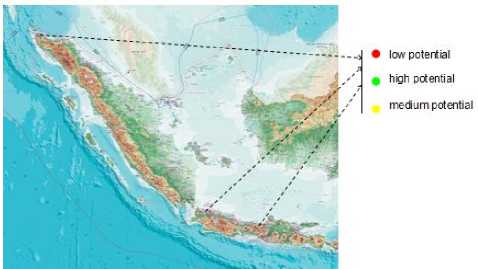
Fig.7. Simulation scenario of halal tourism destination in Sumatera and Jawa islands is to show the potential destination or not in accordance to GMTI indicators. The map shows the high potential in green color, meanwhile the low potential site it shows in red color; and last the medium potential is displayed in yelow color.
Table 1. The Indicators of Halal TourismDestinations (examples)
|
Halal Tourism Destination |
FF |
SF |
MV |
D O |
EO |
MF |
A A |
EC |
RO |
|
Masjid Raya Batam |
90 |
90 |
90 |
90 |
90 |
90 |
90 |
90 |
90 |
|
Makam Raja Jafar |
90 |
90 |
65 |
90 |
90 |
90 |
90 |
90 |
90 |
|
Museum Adityawar-man |
95 |
95 |
95 |
95 |
95 |
95 |
95 |
95 |
95 |
|
Taman Sari Gunongan |
90 |
90 |
90 |
90 |
90 |
90 |
90 |
90 |
90 |
|
Batu Secret Zoo |
10 0 |
95 |
75 |
80 |
80 |
90 |
80 |
95 |
90 |
-
B. Results
We conduct simulation which is divided into 3 parts. First, initial set up include read, display the Sumatera - Jawa map (‘Peta_Sumatera_Jawa.jpg’), and destination halal tourism data. Second, the clustering process which apply KM and weighting calculation. Third, the visualization of clustering results in map. Part of KM algorithm procedures with weighting calculation in the first scenario:
tic;
cluster=3
%clustering based on position
[cidx, ctrs]=kmeans(xy_map,cluster)
data_var=data_wisataFFSF; [bar,kol]=size(data_var);
%determining value of each cluster i.e. indicators 1-
3=20%, 4-7=40%, and 8-11=40% value=[];
for i=1:cluster no_cluster=find(cidx==i);
for j=1:length(no_cluster)
val13=sum(data_var(no_cluster(j),1:3))/3*20 /100;
val47=sum(data_var(no_cluster(j),4:7))/3*40 /100;
val811=sum(data_var(no_cluster(j),8:11))/3* 40/100;
val=val13+val47+val811;
end value=[value;[i val]]; end
%cluster classification based on its value value_rank=sortrows(value,2);
toc;
Part of KM algorithm procedures with weighting calculation in the second scenario:
tic;
%determining value of each destination value=[];
for i=1:bar val13=sum(data_var(i,1:3))/3*20/100;
val47=sum(data_var(i,4:7))/3*40/100;
val811=sum(data_var(i,8:11))/3*40/100; val(i)=val13+val47+val811;
end val=val';
data_eval=[xy_map val];
cluster=3;
[cidx, ctrs]=kmeans(val,cluster) %clustering based on position data_eval2=[data_eval cidx];
toc;
In the second scenario, it is almost the same as the first scenario process, that is, after obtaining 3 clusters, the process is continued with determining the potential of halal tourism destinations in each cluster, where the highest value as the high potential tourism destination. The result is shown in Fig. 9 and 10.
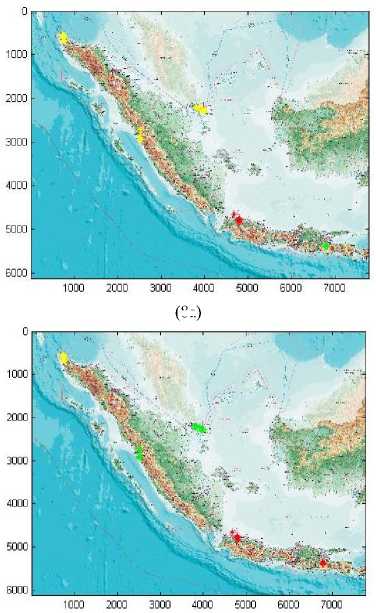
(8a)
(8b)
Fig.8. The map shows the result of halal tourism destination in first scenario. There are 3 clusters that each destination display the color, (a) indicate the first iteration and (b) it displays the second iteration.
The precision and accuracy of the KM clustering applied to halal tourism data in Indonesia are obtained by calculating the coefficient standard error and mean square error. The results of KM performance in scenario 1 can be seen in Table 2.
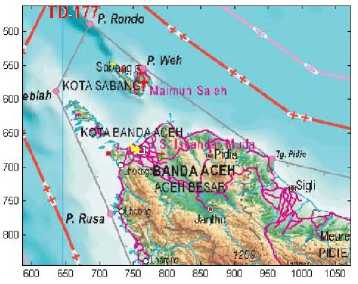
Fig.9. The map shows the result of halal tourism destination in second scenario. There are three classification of halal tourism potential in each cluster which is shown in first scenario, which indicate the potential halal tourism in Aceh province.
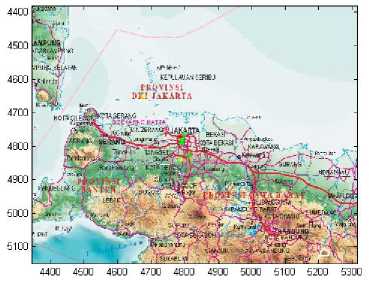
Fig.10. The map shows the result of halal tourism destination in second scenario, which indicate the potential halal tourism in Jakarta province.
Table 2. Cluster Performance with KM
|
Parameter |
Values |
||
|
Number of cluster |
3 |
5 |
7 |
|
Number of instances |
54 |
54 |
54 |
|
Number of attributes |
11 |
11 |
11 |
|
Number of iterations |
6 |
5 |
5 |
|
Time to build model (s) |
0.02 |
0.03 |
0.01 |
|
Cluster sum of squared errors |
17.687 |
15.572 |
14.514 |
|
Clustered Instances |
0 12 (22%) 1 17 (31%) 2 25 (46%) |
0 10 ( 19%) 1 17 ( 31%) 2 15 ( 28%) 3 11 ( 20%) 4 1 ( 2%) |
0 10 ( 19%)
|
|
Coefficient standard error |
0.2121 |
0.1990 |
0.1922 |
|
Mean square error (MSE) |
0.3275 |
0.2884 |
0.2688 |
-
V. Discussion
The results of this study show the potential level of halal tourism destinations in Indonesia, taking into account 11 indicators according to the 2017 GMTI. The level of halal tourism potential includes low, medium and high. The prior study [6] has noted the importance of mapping five tourist destination countries, i.e Cambodia, Hong Kong, Indonesia, the Philippines, and Singapore in the Asia Pacific are grouped by considering tourism and economic indicators for 5 years.
The information collected is divided into two components, namely: (1) tourism expenditure and profitability of tourism activities and (2) tourism development and economic growth using multivariate techniques. The result is a two-dimensional map in three clusters where Hong Kong and Singapore are the most mature markets; Indonesia and the Philippines with a moderate growth rate; and Cambodia, which shows the potential to be further encouraged in terms of growth and tourism development. The similarity of grouping in the current study is the division of 3 clusters with color displays to make it simpler for the public to get information. The advantage of the current study is the implementation of K-mean clustering in two different scenarios. The application of these two scenarios aims to investigate the different forms of distribution of potential levels for each region. Data is obtained from the Indonesian Ministry of Tourism which includes four provinces and one particular city that has promoted itself as a halal tourism destination. The first scenario aims to obtain visualization of 3 clusters for the five regions in low, medium and high potential. While the second scenario aims to map halal tourism areas in three levels of potential in each province, the investigation of the clustering method needs to be done to obtain the performance of each method particularly in spatial information and a reference as to define the best method in clustering.
-
VI. Conclusion
The present study was designed to determine the potential level of each halal tourism destination recommended by the Ministry of Tourism Republic of Indonesia. The author determines the potential level refers to the GMTI 2017 indicator and the KM partition clustering. Simulation is conducted with 3, 5, and 7 clusters. The results show that the more clusters, the better the accuracy and precision. In scenario 1, for three clusters, there are 46% instances in cluster number 2. Likewise in five and seven clusters, the most of instances in clusters number 1 and number 2, 5 respectively. The advantages use of KM in data on halal tourism destinations are general and easy to implement; the time needed for model building is relatively faster and flexible for many application areas. The main weakness of this study was the paucity of the unsupervised method, i.e., an obtained cluster is not optimal, because point k is initialized randomly before the algorithm is executed. Therefore, the grouping of data obtained can vary. If the values obtained randomly for initialization are not good, the obtained groupings are not optimal; (2) the increasing number of attributes the higher the dimensions, therefore the search for the closest distance between points k with other points in the attribute is increasingly more complex. Toward future work, it is necessary to apply the supervised method so that it can compare the results of accuracy and precision to determine the best results. The supervised methods include regression, decision trees, and random forests.
025.04.07.2132.050.514.004.A.521219.
Acknowledgment
We would like to thank Directorate of Higher Education Islamic Religious, Directorate General of Islamic Education, Ministry of Religion Affairs Republic of Indonesia under DIPA Grants:
References Potential halal tourism destinations with applying K-Means clustering
- C. Motik and Indonesian Ocean Council, The Wealth of My Country Maritime Country. Secretariat of Indonesia Ocean Council, Ministry of Marine Affairs and Fisheries Republic of Indonesia, Jakarta, Indonesia, 2010. (in Indonesian)
- World Bank. (2017) Population, total: All Countries and Economies. [Online]. Available: https://data.worldbank.org/indicator/SP.POP.TOTL
- CrescentRating. (2018) Global Muslim Travel Index (GMTI) 2017. [Online]. Available: https://www.crescentrating.com/reports/gmti2017-gmti40.html
- CrescentRating. (2017) Global Muslim Travel Index (GMTI) 2016. [Online]. Available: https://www.crescentrating.com/reports/gmti2016-gmti40.html
- Ministry of Tourism Republic of Indonesia. (2018) Program of Developing Halal Tourism. National Dialogue. (in Indonesian)
- O. Claveria, “Two-dimensional Mapping of Asia Pacific Destinations Combining Tourism and Economic Indicators,” Asia Pacific Journal of Tourism Research, vol. 22, no. 7, pp. 1-15, 2017.
- Ministry of Tourism Republic of Indonesia. (2012) Ministry Promote Indonesia as World Sharia Tourism Destination. [Online]. Available: http://www.kemenpar.go.id: http://www.kemenpar.go.id/asp/detil.asp?c=16&id=2042
- F. Wuryasti. (2013) Halal Tourism, a New Concept Tourism Activities in Indonesia. [Online]. Available: https://travel.detik.com/travel-news/d-2399509/wisata-halal-konsep-baru-kegiatan-wisata-di-indonesia
- L. Munirah and H. N. Ismail. (2012) Muslim Tourists’ Typology in Malaysia: Perspectives and Challenges. In Proc. Tourism and Hospitality International Conference.
- G. Kovjanic, “Islamic Tourism as a Factor of the Middle East,” Turizam, vol. 18, no. 1, pp. 33-43, 2014.
- S. Chookaew, O. Chanin, J. Charatarawat, P. Sriprasert, S. Nimpaya, “Increasing Halal Tourism Potential at Andaman Gulf,” Journal of Economics, Business and Management, vol. III, no. 7, pp. 277-279, 2015.
- P. Moira, D. Mylonopoulos, A. Kontoudaki, “The Management of Tourist’s Alimentary Needs by the Tourism Industry,” International Journal of Culture and Tourism Research, vol. 5, no. 1, pp. 129-140, 2012.
- W. Sahida, S. A. Rahman, K. Awang, and Y. C. Man, “The Implementation of Shariah Compliance Concept Hotel: De Palma,” in Proc. 2nd International Conference on Humanities, Historical and Social Sciences, 2011.
- D. R. Ratman. (2016) Development Tourism Destination Priority 2016-2019. [Online]. Available: http://www.kemenpar.go.id/userfiles/Paparan%20-%20Deputi%20BPDIP.pdf (current October 2018) (in Indonesian)
- CrescentRating. (2016) The 11 Criteria That Make Up The Global Muslim Travel Index 2016. [Online]. Available:: https://www.crescentrating.com/magazine/travel-index-and-rankings/3857/the-11-criteria-that-make-up-the-global-muslim-travel-index-2016.html (current December 2018)
- P. N. Tan, M. Steinbach, and V. Kumar, Introduction to Data Mining. Boston, USA: Pearson Education, 2006.
- J. Han, M. Kamber, J. Pei, Data Mining Concept and Techniques, 3rd ed. Amsterdam, Holland: Morgan Kaufmann-Elsevier, 2012.
- F. Rangkuti, Inventory Management: Application in Business (Indonesian). Jakarta, Indonesia: Grafindo Persada, 2004.
- B. Santosa, Data Mining: Technique of Utilization Data for Business Purposes (Indonesian). Yogyakarta, Indonesia: Graha Ilmu, 2007.
- A. K. Jain, “Data Clustering: 50 Years Beyond K-Means,” Pattern Recognition Letters, vol. 31, no. 8, pp. 651-666, 2010.
- T. Shi, P. Wang, P. Wang, S. Yue, “Application of Grid-based K-means Clustering Algorithm for Optimal Image Processing,” Computer Science and Information Systems, vol. 9, no. 4, pp. 1679-1696, 2012.
- R.-I. Chang, S.-Y. Lin, J.-M. Jo, C.-W. Fann, Y.-C, “A Novel Content Based Image Retrieval System using K-means/KNN with Feature Extraction,” Computer Science and Information Systems, vol. 9, no. 4, pp. 1645-1661, 2012.
- M. N. Qureshi and M. V. Ahamad, “An Improved Method for Image Segmentation Using K-Means Clustering with Neutrosophic Logic,”i in Proc. International Conference on Computational Intelligence and Data Science, 2018.
- S. K. Jayanthi and C. K. Priya, “Clustering Approach for Classification of Research Articles Based on Keyword Search,” International Journal of Advanced Research in Computer Engineering & Technology, vol. 7,no. 1, pp. 86-90, 2018.
- J. Pérez-Ortega, N. N. Almanza-Ortega, and D. Romero, “Balancing effort and benefit of Kmeans clustering algorithms in Big Data realms” PLoS ONE, vol. 13, no. 9, pp. 1-19, 2018.
