Prediction Models for Diabetes Mellitus Incidence

Author: Awoyelu I. O., Ojewande A. O., Kolawole B. A., Awoyelu T. M.
Journal: International Journal of Information Technology and Computer Science @ijitcs
Article in issue: 4 Vol. 12, 2020.
Free access
Diabetes mellitus is an incurable disease with global prevalence and exponentially increasing incidence. It is one of the greatest health hazards of the twenty-first century which poses a great economic threat on many nations. The premise behind effective disease management in healthcare system is to ensure coordinated intervention targeted towards reducing the incidence of such disease. This paper presents an approach to reducing the incidence of diabetes by predicting the risk of diabetes in patients. Diabetes mellitus risk prediction model was developed using supervised machine learning algorithms of Naïve Bayes, Support Vector Machine and J48 Decision Tree. The decision tree was able to give a prediction accuracy of 95.09% using rules of prediction that give acceptable results, that is, the model was approximately 95% accurate. The easy-to-understand rules of prediction got from J48 decision tree make it excellent in developing predictive models.
Diabetes mellitus, supervised machine learning, feature extraction, prediction
Short address: https://sciup.org/15017459
IDR: 15017459 | DOI: 10.5815/ijitcs.2020.04.04
Text of the scientific article Prediction Models for Diabetes Mellitus Incidence
Published Online August 2020 in MECS
Respiratory
- Kussmaul breathing (hyperventilation)
Main symptoms of Diabetes
- Polydipsia
- Polyphagia
- Lethargy
- Stupor
Systemic
- Weight loss
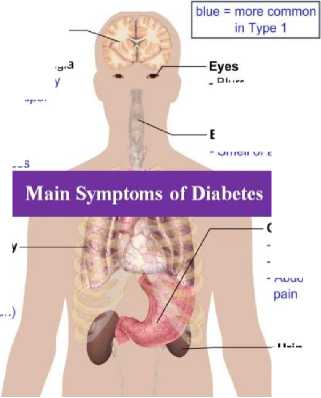
- Urinary
- Polyuria
- Glycosuria
- Blurred vision
Breath
- Smell of acetone
Gastric
- Nausea
- Vomiting
- Abdominal
Fig.1. Symptoms of Diabetes [7]
Data mining is the process of extracting patterns from large data sets with the intent of finding knowledge [8]. It is a useful approach to discovering useful knowledge and inter-relation patterns hidden in existing data. It is the computational process of discovering patterns in large data sets using methods that intersect Artificial Intelligence (AI), Machine Learning (ML) and Statistics. It usually involves the analysis of data from different perspectives and summarizing it to provide useful information [9]. Its process involves sorting through large amounts of data and discovering pattern in the data. In medical practices, data mining has been gaining wide application for knowledge extraction and acquisition, which are being usefully employed in predicting, preventing and treating diseases [10]. It broadly comprises both descriptive and predictive analytics [11] and often involves the processes of clustering, classification, association rule learning and feature extractions.
Data clustering is the unsupervised classification of patterns, observations, data items or features into groups [12]. It is a statistical approach of classifying individuals of a particular population into different groups by making quantitative comparisons of multiple characteristics. It involves the process of grouping related observations together on the basis of having similar values for attributes. Data clustering is done such that similar instances of a dataset are grouped together into clusters with each cluster being a subset of the entire population size. Classification, as clustering, also categorizes records into distinct segments called classes. However, unlike clustering, a classification analysis requires that how classes are defined are known ahead of time. It involves assigning a record to a class based on its similarity with some previously observed records. Classification could be predictive (indicating the propensity to behave in a certain way) or definitive (indicating similarity to objects that are known to be definite members of a class) [13]. Classification can be used to predict new situations [14] and a guide to decision making. Association rule mining aims at finding all the rules in the dataset that satisfy some minimum support and minimum confidence constraints [15] without a predetermined target. It is often aimed at identifying relationships between items in a dataset. Feature extraction involves reducing the amount of resources required to describe a large set of data. This is usually necessary when performing analysis of complex data and usually one of the major problems faced. Feature extraction is usually intended to make a dataset more informative and non-redundant in order to facilitate the subsequent learning and generalization steps, and in some cases to better human interpretations. It can be simply seen as a means to reduce the dimensionality of a dataset. A good feature selection process usually involves a dual process of selecting a search strategy to select the best candidates (features retained) subsets and evaluating an objective function which estimates the degree of ‘goodness’ of the selected candidates.
In diagnosing diabetes, clinicians often embark on routinely tedious medical examination and check-ups. Many cases of diabetes are not diagnosed until symptoms become severe with life-threatening complications. However, many cases of diabetes mellitus could be prevented or delayed if the patient knows his/her risk of developing diabetes and such a patient is medically monitored, even before the manifestation of diabetes symptoms. The aversion or delay of onset of diabetes will considerably improve the quality of life of the concerned patient with positive economic impact. Existing models have been focusing on diagnosis. Previous researches focused on the diagnosis of diabetes and predicting whether or not a person has diabetes. Diagnosis and management have not been sufficient to decline the rate of incidence of diabetes among various populations.
However, there is the need to know a patient’s risk of diabetes even before its symptoms manifest thus necessitating for a model that can predict the risk of patients developing diabetes and aid clinicians in the decision making processes that may relate to diabetes. Hence, the aim of this paper is to predict the risk of diabetes in patients.
2. Related Works
There are several research works published in the domain of machine learning application to healthcare in general and diabetes in particular. Machine learning and data mining approaches are not new to researches in diabetes prediction, diagnosis and management.
[16] worked on diagnosis of diabetes using classification and prediction by neural networks. The Artificial Neural Networks were used to develop both predictive and diagnostic models. Their predictive networks were shown to perform better than their diagnostic networks. The accuracy of diagnosis was also seen to decline on new dataset. [17] developed a diagnostics supporting system for the monitoring and treating of people with diabetes. In their work, they applied Classification and Regression Tree (CART) algorithm. Although the developed system collected several data, only blood test records are focused on to classify patients. Their work showed that although the CART algorithm performs accurately on new data, the developed system predicts diabetes cases less accurately than the non-diabetes cases. It also showed that substantial amount of dataset is required for learning in order to enhance the accuracy of classification.
[8] performed the prediction of diabetes using a duo mining approach of text mining and data mining. Their work was proposed as a tool which can mine data from diabetic type bio-medical databases and documents and convert them into easily understandable knowledge format. In their work, more factors, aside blood sugar concentration, were considered for their information extraction. Although the prediction accuracy was reasonably improved, their system requires more resources for storage and processing. Also, the rules of decisions are ambiguous and the response time is almost intolerable. [18] applied machine learning methods in diagnosing heart diseases in patients with diabetes. In their work, the chances that a patient with diabetes has heart diseases were predicted. They employed Naïve Bayes and Support Vector Machines (SVM) algorithms. Their work showed SVM as a classification technique that gives excellent predictive performance. However, many of the attributes used in the development of the model are not directly related to heart diseases.
[10] proposed an Artificial Neural Networks Rules (ANNR), Artificial Neural Networks preceded by rules extractions, for predicting diabetes. Their work showed an enhancement of the comprehensibility of rules applied in the predictions of diabetes in patients. Their model can work on both discrete and continuous data, generating rules with high comprehensibility. However, the generated rules are with strong generalization and usually include too many redundant rules. The performance evaluation of the study was not presented. [19] used data mining approach for the prediction and treatment of diabetes disease. Analysis of a set of diabetes data was done using Naïve Bayes, Neural Networks, Decision tree (C4.5), KNN, Fuzzy logic and Genetic algorithms. It was shown that the various algorithms have high computational costs, except the C4.5 decision tree algorithm. The C4.5 algorithm was also shown to have a high degree of accuracy. [20] worked on the prognosis of diabetes. Data mining approaches of Fuzzy C-means clustering and Sequential Minimal Optimization (SMO) algorithms were used in the WEKA simulation environment. Their work showed that FCM has higher predictive accuracy than SVM. However, the development of the model was done using datasets from females above 21 years only.
[21] worked on predicting the risk of a pregnant woman developing diabetes during pregnancy period. The Iterative Dichotomiser 3 (ID3), Naïve Bayes, C4.5 decision tree and random forest algorithms were used. Their work showed that random forest algorithm outperforms the other algorithms in terms of accuracy of prediction. [21] used different data mining algorithms in predicting the presence of diabetes in patients. The SVM, KNN, ID3, Naïve Bayes, C4.5, C5.0 and CART algorithms were used and simulated using MATLAB. Comparative evaluation of the algorithms’ individual performances was done. The comparative analysis showed that SVM has the highest degree of accuracy while C5.0 algorithm was shown to be more accurate than ID3, C4.5 and CART algorithms. SVM was also shown to be excellent for binary classification.
3. Methodology3.1. Data Collection and Preprocessing
This section deals with description of the dataset, its pre-processing and the methodology adopted in this study.
The data used for this study were obtained from the health records of patients in the Endocrinology Clinic and General Out-Patient Department (GOPD) of the Obafemi Awolowo University Hospitals Complex (OAUTHC), a leading referral tertiary hospital in Nigeria. The health records of these patients are not available on the Internet because they are life data, they are not made public. Ethical approval was sought for and given before the data could be released for this study. A sample dataset is as shown in Figure 2. A total of 326 records were contained in the collected data and the target classes, ‘HIGH’ and ‘LOW’ assigned to each record to quantify each patient’s measure of risk level of diabetes mellitus. The records in the data contained clinical information of 152 males and 174 females within the ages 30 and 80 years. The dataset contained attributes and symptoms relevant to measuring a patient’s risk of diabetes mellitus and monitored by the medical personnel who attended to them. The variables monitored in each patient included the patient’s age, Body Mass Index (BMI), systolic blood pressure, diastolic blood pressure, fasting plasma glucose (FPG), sex, history, waist circumference, 2HPP, HA1c, alcohol intake and smoking history. Table 1 shows the variables contained in the dataset. The dataset was cleaned by removing the attributes with too many missing values to enhance the accuracy of prediction. To reduce over-generalization, the diastolic blood pressure and systolic blood pressure were discretized into ‘Normal’, ‘Pre-hypertension’, ‘Stage 1 hypertension’ and ‘Stage 2 hypertension’.
^relation diabetes-datas-et
57,M,24.8,120,80,6. 7. YES 50^,28.2,130,90,7. 3, yes 75,M,23.8,150,80,5, 7, NO 60,M,29.3,160,90,6.7,7 45.F,19.6,110,70,5.4,YES 56,F,20.4,140,70,13. 2,?
60 ,M , 2 3. 9,150,80,9.1, NO|
44.^,23.7,120,70,5.3.YE5 40,M,25.1,150,80, 7. 9,YES 39,F,18.3,140,80,10.8.? sn M 71 Q 1?Л 7П S Л VPS
Fig.2. Sample of Diabetes Dataset in . arff format
Table 1. Attributes of the Dataset with their Units of Measurement
|
Attributes |
Unit(s) of measure |
|
Age |
Years (yr) |
|
Body Mass Index |
Kilogramme per square metre(Kg/m2) |
|
Systolic Blood Pressure |
Millimeter of Mercury (mmHg) |
|
Diastolic Blood Pressure |
Millimeter of Mercury (mmHg) |
|
Fasting Plasma Glucose |
milli-mole per Litres (mmol/L) |
|
Sex |
Male (M) or Female (F) |
|
History |
Yes (Y) or No (N) |
|
Risk |
HIGH or LOW |
|
Waist Circumference |
Centimetres (Cm) |
|
2HPP |
milli-mole per Litres (mmol/L) |
|
HA1C |
Percentage above normal (%) |
|
Alcohol intake |
Grammes per day (g/day) |
|
Smoking |
Pack-years |
After the data cleaning process, the variables contained in the dataset included age, sex, BMI, systolic blood pressure, diastolic blood pressure, fasting plasma glucose and history. These are attributes identified to be monitored in patients for diabetes. The experimental process and methodology adopted is as shown in Figure 3. The data used were extracted from patients’ case notes based on features identified as indicators of diabetes risk prediction. The data contain records of both males and females within the age brackets of 30 years and 80 years – 152 males and 174 females.
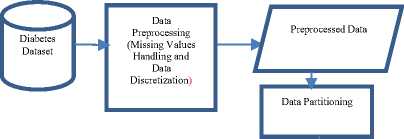
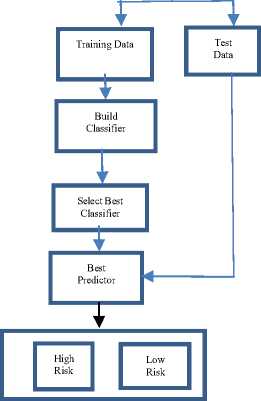
Fig.3. Methodological Framework for Diabetes Risk Prediction
-
3.2. Models Development, Simulation and Validation
The Naïve Bayes, SVM and J48 (WEKA’s C4.5 decision tree) algorithms were trained by the pre-processed dataset, containing only seven attributes, including age, body mass index (BMI), systolic blood pressure, diastolic blood pressure, fasting plasma glucose, sex and history. The models were simulated using the Waikato Environment for Knowledge Analysis developed at the University of Waikato in New Zealand. It is an open source software under the GNU General Public License and freely available at
The k-cross validation was used to validate the developed models. In this validation approach, the whole dataset is divided into a number (k) of partitions with equally (or nearly equally) sized segments. Each partition (fold) was selected for testing with the remaining k – 1 partitions used for training. The cross validation process is then repeated k times (the folds), with each of the k segment used exactly once as test (validation) data. The k results from folds were then averaged to obtain a single estimation. This validation process is advantageous in that all observations are used for training and validation, with each observation used for validation exactly once.
Specifically, the stratified 10-fold cross validation was used to validate the developed model. This involves splitting of the whole dataset into ten partitions. In order to obtain a reliable error estimate, the process of 10-fold cross validation was repeated ten times, implying 100 cross validation experiments. The proposed models were simulated using the Waikato Environment for Knowledge Analysis (WEKA) version 3.7.2. The performance accuracy of the models was evaluated using error rate, sensitivity, specificity and false alarm rate as metrics. Although the process is computationally intensive, it however gives a reliable measure of performance and increased degree of accuracy in prediction.
Prediction accuracy is usually used to measure the classified effectiveness. To determine this, four parameters were identified from the results of predictions made by the classifiers during model testing. The parameters are True Positive (TP), True Negative (TN), False Positive (FP) and False Negative (FN). TP is the correct prediction of positive cases. TN is the correct prediction of negative cases. FP is the number of incorrect prediction of positive cases (negative cases predicted as positives) while False Negative refers to the number of correct prediction of negative cases (positive cases predicted as negative). The values of TP, TN, FP, FN are gotten from a Confusion matrix as shown in Table 2.
Table 2. A Sample of Confusion Matrix
|
Predicted as -- |
^ |
High |
Low |
|
High |
TP |
FP |
|
|
Low |
FN |
TN |
Prediction Accuracy is calculated as in Equation 1.
Accuracy =
TP + TN
TP + TN + FP + FN
4. Results and Discussions
The pre-processed historical dataset containing eight (8) attributes was used to train the Naïve Bayes, SVM and J48 algorithms.
-
4.1. Result of the Classifiers
For each record in the dataset, a target class defining the classification of risk level was also provided. From the dataset of 326 patients’ records with attributes identified to be monitored for diabetes risk, models were obtained from training the algorithms.
-
A. Result of Naïve Bayes Classifier
Table 3 shows the confusion matrix of the classification model of the Naïve Bayes classifier. It shows that a total of 311 (95.39%) instances were correctly classified and 15 (4.61%) were incorrectly classified. The approximate rate at which the Naïve Bayes classifier generated false alarm in its prediction was 0.0296 (2.96%).
Table 3. Confusion Matrix of Naïve Bayes Classifier
|
Predicted as -- |
^ |
High |
Low |
|
High |
180 |
11 |
|
|
Low |
4 |
131 |
-
B. Result of SVM Classifier
This study uses the John Platt’s Sequential Minimal Optimization (SMO) algorithm in the training of the SVM classifier for diabetes risk prediction and implemented in the public domain of the WEKA software. In the WEKA implementation of SMO algorithm, by default, all data are normalized, all nominal attributes are transformed into binary values and all missing values are globally replaced. The SMO works by breaking the large QP problem down into series of smaller 2-dimensional sub-problems.
Using the pre-processed dataset, the SMO algorithm was trained. Table 4 shows that only 171 (89.53%) of the 191 ‘HIGH’ cases were correctly predicted, implying a true- positive- rate (recall) of 89.53. Furthermore, 132 (97.78%) of the 135 ‘LOW’ instances were also correctly predicted, implying a true-negative-rate (specificity) of 97.78. In all, Table 3 shows that the SMO algorithm correctly predicted 303 (92.94%) instances of the total 326 instances. The false alarm rate of the used SVM classifier was 0.0222 (2.22%).
Table 4. Confusion Matrix of SVM Classifier
|
Predicted as - ^ |
High |
Low |
|
High |
171 |
20 |
|
Low |
3 |
132 |
-
C. Result of the Decision Tree Classifier
The result of the J48 classifier is as shown in Table 5. It shows that only 310 instances were correctly predicted while 16 instances were incorrectly predicted. The graphical representation of the decision tree model is as shown in Figure 4. From the tree model, FPG is the most significant factor in predicting the risk of diabetes. The figure also shows that the risk of diabetes is higher in females than in males, and this increases with age. The systolic blood pressure, aside FPG, is also shown to be very significant to predicting the risk of diabetes. Algorithm 1 shows the ‘If-Then’ rules extracted from the predictive tree for diabetes mellitus risk.
Table 5. Confusion Matrix for Decision Tree Model
|
High |
Low |
Predicted as |
|
180 |
11 |
High |
|
5 |
130 |
Low |
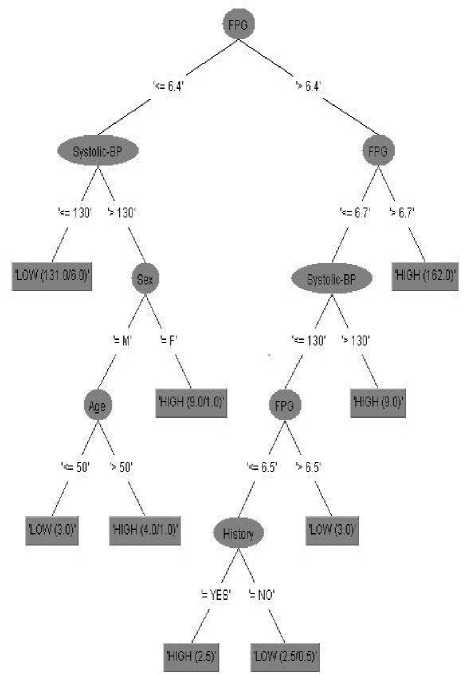
Fig.4. Visualized Decision Tree for Diabetes Risk Prediction
Algorithm 1 Decision Rules for Diabetes Risk Prediction if fpg ≤ 6.4
then if systolic bp ≤ 130
then risk = low else if sex= f then risk = high else if age ≥ 50
then risk = high else risk = low end if;
end if;
else if fpg > 6.7
then Risk = High else if Systolic bp > 130 then risk = High else if History = Yes then Risk = High else
Risk = Low end if;
end if;
end if;
end if;
-
4.2. Performance Evaluation of the Models
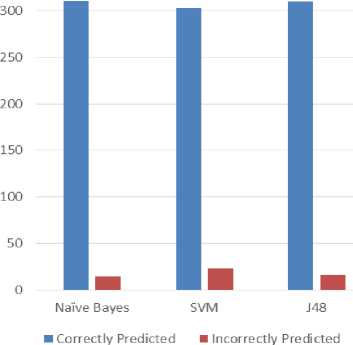
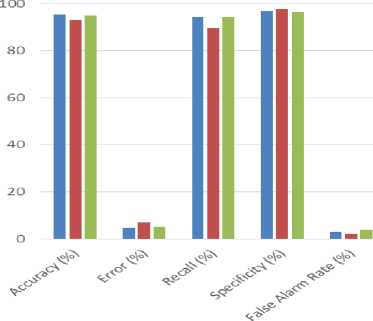
Performance comparison of the models was carried out using accuracy, recall, specificity, error rate and false alarm rate. Table 5 and Figure 5 gives the correctly and the incorrectly instances as predicted by the models. The correctly instances were 311, 303 and 310 as predicted by Naïve Bayes, SVM and J48 respectively and incorrectly instances were 15, 23 and 16 respectively. Table 6 and Figure 6 presents a summarized comparison of the individual performance of the three SML algorithms. Naïve Bayes has prediction accuracy of 95%, SVM has 93% and Decision tree 95% approximately. This shows that Naïve Bayes model is 95% accurate, SVM 93% accurate and decision tree is 95% accurate. The table shows that SVM has the least prediction accuracy, while Naïve Bayes and J48 algorithms have approximately the same performance. These results compared well with others in the field as shown in the level of accuracy of the models used. [23] obtained a prediction accuracy of approximately 81%. [24] obtained prediction accuracy of 66% with SVM, decision tree 70%, Naïve Bayes 76%. From these results, it is implied that the models used in this study have a better performance with higher levels of accuracy.
The J48 algorithm is also shown to have the highest recall rate, implying that it predicts positive cases of risk more accurately than either of the Naïve Bayes and SVM, while SVM has the least recall rate however with the highest specificity (enhanced performance for predicting negative cases accurately). The SVM has the least of false alarm rate while the J48 algorithm has the highest false alarm rate.
Table 5. Correctly and Incorrectly Predicted Instances of the Models
|
Naïve Bayes (NB) |
SVM |
J48 |
|
|
Correctly Predicted Instances |
311 |
303 |
310 |
|
Incorrectly Predicted Instances |
15 |
23 |
16 |
Correctly and Incorrectly Predicted Instances 350
-
Fig.5. Correctly predicted versus Incorrectly Predicted Instances
Performance Evaluation of the Models
NB eSVM ■ J48
-
Fig.6. Performance Comparison of Naïve Bayes, SVM and Decision Tree
5. Conclusions
Table 6. Performance Comparison of Naïve Bayes, SVM and J48 Decision Tree
|
NB |
SVM |
J48 |
|
|
Accuracy (%) |
95.39 |
92.94 |
95.09 |
|
Error (%) |
4.61 |
7.06 |
4.91 |
|
Recall (%) |
94.24 |
89.53 |
94.24 |
|
Specificity (%) |
97.04 |
97.78 |
96.3 |
|
False Alarm Rate (%) |
2.96 |
2.22 |
3.7 |
The prediction of diabetes mellitus risk has been modeled in this study using the classification algorithms of Naïve Bayes, Support Vector Machine and J48 of Weka C4.5 decision tree. The diabetes dataset containing attributes identified to be relevant to the risk prediction was used to develop the model which was simulated and validated using the Waikato Environment for Knowledge Analysis (WEKA). Following the use of the supervised machine learning algorithms, the obtained results show that the blood sugar is the most important factor that can be used to measure a person’s risk level or chances of developing diabetes, as established in the existing body of knowledge on diabetes. The results also show that the systolic blood pressure, family history of diabetes, age and sex of the patient have strong correlation with the risk of diabetes. The variables identified by the prediction model and the tree constructed from the decision tree using the variables can help provide insight into the relationships that exist between the variables with respect to the prediction of diabetes risk in people. The rules of prediction by the decision tree can also be helpful in building a rule-based system for diabetes prediction, diagnosis, management and control. The predictive tree obtained and the extracted ‘IF-THEN’ rules gave acceptable results when compared with conventional diagnosis process in medical practice. Future work could be done by collecting more data samples from more than one race. The data could include more attributes, apart from the clinically monitored attributes used in this study. Also, future work can focus on quantifying the risk of diabetes and predicting how soon or late a patient will develop diabetes.
References Prediction Models for Diabetes Mellitus Incidence
- Sen, S. K., and Dash, S. Application of Meta Learning Algorithms for the Prediction of Diabetes Disease. International Journal of Advance in Research in Computer Science and Management Studies, 2014, 2(12): 396-401.
- Visalatchi, G., Gnanasoundhari, S. J. and Balamurugan, M. A survey on Data Mining Methods and Techniques for Diabetes Mellitus. International Journal of Computer Science and Mobile Applications. 2014. 2(2): 100-105.
- Rother, K. I. Diabetes Treatment - Bridging the Divide. The New England Journal of Medicine, 2007, 356(15): 1499-1501.
- Agarwal M.M., Ghatt G.S., Punnose J. and Zayed R. Gestational Diabetes: Fasting and Postprandial Glucose as First Prenatal Screening Tests in a High-Risk Population. The Journal of Reproductive Medicine, 2007, 52(4): 299-305.
- WHO (World Health Organisation). Diabetes. 2016. Available at: http://www.who.int/mediacentre/factsheets/fs312/en Retrieved August 21, 2019.
- Cooke D.W. and Plotnick L. Type 1 Diabetes Mellitus in Pediatrics. Pediatrics in Review, 2008, 29 (11): 374-384.
- Medical eStudy (2019). Main Symptoms of Diabetes. Available at: http://www.medicalestudy.com/main-symptoms-diabetes/ Accessed: 19th December, 2019.
- KKrishnaiah, V. J. R., Sekhar, D. C., Rao, D. K. R. H. and Prasad, D. R. S. Predicting the Diabetes using Duo Mining Approach. International Journal of Advanced Research in Computer and Communication Engineering, 2012, 1(6): 423- 431.
- Kumar, V. and Velide, L. A Data Mining Approach for Prediction and Treatment of Diabetes Disease. International Journal of Science Inventions Today, 2014, 3(1): 073-079.
- Shinde P. Data Mining using Artificial Neural Network Rules. International Journal of Innovations in Engineering and Technology, 2013, 3(1): 157-162.
- Elkan C. Predictive Analytics and Data Mining. 2013. Available at: http://www.cseweb.ucsd.edu/~elkan/255/dm.pdf/. Accessed: June 21, 2018.
- Jain A.K, Murty M.N. and Flynn P.J. Data Clustering: A Review. ACM Computing Surveys (CSUR), 1999, 31(3): 264-323.
- Swingler K. Data Mining Classification. 2016. Available at: http://quarter.cs.stir.ac.uk/courses/ITNPBD6/lectures/Analytics/6%20-%20Classification.pdf Retrieved on February 7, 2019.
- Nejad, S. K., Seifi, F., Ahmadi, H. and Seifi, N. Applying Data Mining in Prediction and Classification of Urban Traffic. In IEEE Computer Science and Information Engineering, 2009, Vol. 3, pp. 674-678.
- Liu, B., Hsu, W. and Ma, Y. Integrating Classification and Association Rule Mining: A concept Lattice Framework. In International Workshop on Rough Sets, Fuzzy Sets, Data Mining, and Granular-Soft Computing. Springer Berlin Heidelberg. 1999, pp. 443-447.
- Adeyemo, A. B. and Akinwonmi, A. E. On the Diagnosis of Diabetes Mellitus Using Artificial Neural Network Models. African Journal of Computing and ICT, 2011, 4(1): 1-8.
- Kavitha, K. and Sarojamma, R. M. Monitoring of Diabetes with Data Mining via CART Method. International Journal of Emerging Technology and Advanced Engineering, 2012, 2(11): 157-162.
- Parthiban, G., and Srivatsa, S. K. Applying Machine Learning Methods in Diagnosing Heart Disease for Diabetic Patients. International Journal of Applied Information Systems, 2012, 3: 2249-0868.
- Kumar, V. and Velide, L. A Data Mining Approach for Prediction and Treatment of Diabetes Disease. International Journal of Science Inventions Today, 2014, 3(1): 073-079.
- Sanakal, R. and Jayakumari, T. Prognosis of Diabetes using Data Mining Approach-Fuzzy C Means Clustering and Support Vector Machine. International Journal of Computer Trends and Technology, 2014, 11(2), 94-98.
- Nagarajan, S., Chandrasekaran, R. M. and Ramasubramanian, P. Data Mining Techniques for Performance Evaluation of Diagnosis in Gestational Diabetes. International Journal of Current Research and Academic Review, 2015, 2(10): 91-98.
- Farahmandian, M., Lotfi, Y. and Maleki, I. Data Mining Algorithms Application in Diabetes Diseases Diagnosis: A Case Study. MAGNT Research Report. 2015, 3(1), pp. 989-997.
- Zou Q. Qu K, Luo Y., Yin D and Tang H. Predicting Diabetes Mellitus with Machine Learning Techniques. Front Genet, 2018, 9:515. Available at https://doi.org/10.3389/fgene.2018.00515 Accessed: 14th February, 2020.
- Aishwarya J.and Vakula R. J. Performance Evaluation of Machine Learning Models for Diabetes Prediction. International Journal of Innovative Technology and Exploring Engineering (IJITEE), 2019, 8(11): 1976 -1980.
