Prediction of Academic Success Based on Teaching Quality Using Fuzzy Logic

Author: Marija Mojsilović, Muzafer Saračević, Selver Pepić, Suad Bećirović, Milica Tufegdžić
Journal: International Journal of Cognitive Research in Science, Engineering and Education @ijcrsee
Section: Original research
Article in issue: 3 vol.13, 2025.
Free access
This research aims to examine the impact of the quality of teaching on the success of vocational students, focusing on professional-applicative subjects in the field of information technology, as well as on general education subjects. The quality of teaching was analyzed through six factors: comprehensibility of the teaching content, applicability of the material, quality of the teaching material, teacher’s commitment, working atmosphere and objectivity of assessment. The academic success of students is represented by the course grade. An adaptive neuro-fuzzy system, ANFIS, was used to model the relationship between the aforementioned factors and academic achievement, which combines the advantages of fuzzy logic and neural networks. Data were collected through a structured questionnaire with a Likert scale, and the model was trained and evaluated using soft computing techniques. The results show that the quality of the teaching material, the dedication of teachers and the working atmosphere have the greatest influence on the success of students. These factors were singled out as the most significant predictors of success within the ANFIS model. The findings indicate the need for a systematic approach to improving the quality of teaching in professional studies and confirm the usefulness of artificial intelligence in the analysis of educational data.
Teaching quality, Professional studies, Fuzzy logic, Anfis, Soft computing
Short address: https://sciup.org/170211403
IDR: 170211403 | UDC: 159.953.5.072-057.875; 37.091.322.7-057.875 | DOI: 10.23947/2334-8496-2025-13-3-603-623
Text of the scientific article Prediction of Academic Success Based on Teaching Quality Using Fuzzy Logic
Academic success is one of the key indicators of the effectiveness of the educational process and is most often measured by achieved grades, passing or achievement on standardized tests. In the literature, academic success is defined as the degree to which the student has adopted the intended learning outcomes ( Villar, A., and de Andrade, C. R. V. 2024 ). It is influenced by several factors: individual characteristics of students (prior knowledge, motivation, learning styles), contextual factors (financial support, family support), but also factors related to the teaching process itself, such as the quality of teaching, the approach of teachers and the availability of teaching resources ( Ligia, E. et al. 2024 ). Research shows that the quality of teaching is one of the most important predictors of academic achievement, especially in vocational education.
Teaching quality is a complex category that includes several aspects of the teaching process. In this research, the quality of teaching is conceptualized through six basic factors: comprehensibility of the teaching content, applicability of the material in practice, quality of the teaching material, teacher’s commitment, working atmosphere during the lesson and objectivity of assessment. These factors reflect students’ perception of the effectiveness of the teaching process and are often used as indicators in the evaluation of teaching quality in higher education ( Zhao, H., and Zhang, F. 2025 ). Each of the above features has a specific role in creating an educational environment that encourages academic success.
The use of artificial intelligence and soft computing methods in the analysis of educational data is becoming increasingly common in modern research. These techniques enable the analysis of complex

and ill-defined relationships between educational variables, taking into account uncertainty and subjectivity in data derived from surveys or other sources ( Zogopoulos, K. et al. 2025 ). Soft computing approaches, such as neural networks, genetic algorithms and fuzzy logic, enable the construction of models that provide a better understanding of educational processes, as well as the prediction of learning outcomes. The application of these techniques in the analysis of teaching quality enables obtaining valuable insights that can be used to make strategic educational decisions.
Fuzzy logic represents a mathematical approach to modeling uncertainty and imprecision that allows describing complex systems using linguistic variables and degrees of belonging. Unlike traditional binary logic, fuzzy logic allows values to belong to multiple categories at the same time, which is particularly useful in the analysis of subjective assessments such as the perception of teaching quality. The basic elements of a fuzzy system include input fuzzification, rule set definition, inference mechanism and output defuzzification ( Celikyilmaz, A., and Türksen, I. B. 2009 ). In this research, fuzzy logic was applied within the ANFIS model in order to obtain a prediction of academic success based on several input factors that describe the quality of teaching.
Numerous studies point to the importance of the quality of teaching as one of the key factors in the academic success of students. Studies in the field of educational psychology and pedagogy point to a positive correlation between the comprehensibility of lectures, the motivation of teachers and the achieved grades of students. On the other hand, research in the field of educational analytics increasingly includes the application of soft computing techniques, such as fuzzy logic and ANFIS models, in the analysis of educational processes ( Mojsilović, M. et al. 2025 ). In the literature, there are works that apply these methods for predicting success, identifying at-risk groups of students and optimizing teaching strategies. However, there is a limited number of researches that are specifically focused on professional studies and professional-applicative subjects in the field of information technologies, which indicates the existing research gap that this paper seeks to fill.
Modern education systems face challenges in how to improve the quality of teaching and improve student success. Especially in the context of vocational studies in the field of information technology, the quality of teaching is a key factor that can affect the level of acquired knowledge and acquired competencies. Effective recognition and quantification of teaching quality factors that contribute the most to students’ academic achievements is extremely important for planning and improving educational processes.
Traditional methods of educational data analysis are often not sufficient for accurate modeling of complex and interdependent relationships between various factors of the educational process ( Baker, R. S. et al. 2016 ). In this context, the application of soft computing techniques, and especially fuzzy logic, provides an opportunity for a better understanding of the uncertainty and subjectivity that is present in teaching quality assessments.
The goal of this research is to develop a model for predicting the academic success of students based on their perception of the quality of teaching, using a fuzzy logic approach. The research is focused on professional-applied courses in professional studies of information technologies, because these courses represent the key link between theoretical knowledge and its practical application, as well as on general education courses.
The paper includes an analysis of six teaching quality factors: comprehensibility of the teaching content, applicability of the material, quality of the teaching material, teacher’s commitment, working atmosphere and objectivity of assessment. As an output variable, the academic success expressed through the course grade was taken. The model based on fuzzy logic enables the prediction of success based on the input parameters that represent the student’s perception of various aspects of teaching quality.
Through this research-problem orientation, the work aims to contribute to the improvement of teaching practices and the process of making pedagogical decisions in professional studies.
Previous research in the field of education has most often focused on the analysis of individual factors that influence academic success, while there is a noticeable lack of studies that holistically observe the quality of teaching, especially in the context of vocational studies in information technology ( Mojsilović, M. et al. 2023 ). Also, the application of advanced soft computing techniques, such as fuzzy logic and adaptive neuro-fuzzy inference systems (ANFIS), is still insufficiently represented in educational analytics.
The original contribution of this research is reflected in the development of a predictive model that integrates student perception of teaching quality with artificial intelligence techniques in order to assess academic success. The results of the work can serve as a basis for making decisions aimed at improving educational practices, especially in the segment of professional education.
Materials and Methods
The research was conducted at the Academy of Vocational Studies in Šumadija - Trstenik Department. The sample included a total of 155 vocational students attending various study programs in the field of information technologies. Special attention is paid to the inclusion of students who attend general education subjects, such as English and Mathematics, but also those who attend professional-applied subjects, in accordance with their teaching curricula.
Within the group of students attending professional-applicative subjects, students from different modules and study programs were surveyed, which enabled us to gain insight into the perception of the quality of teaching at different levels and areas of professional education.
For the purposes of data collection, a structured questionnaire consisting of six questions was used, each of which was aimed at one of the key factors presented in Table 1. Students rated their experiences using a ten-point Likert scale, where the value 1 indicated complete disagreement and 10 complete agreement with the given statements.
The survey was completed by students from different years of study and different modules, which additionally contributed to the diversity of the sample and enabled a broader analysis of the perception of teaching quality in the context of different types of subjects and educational experiences.
In order to examine in detail the impact of teaching quality on student achievement, key input factors that reflect different aspects of the teaching process have been identified. The selection of these factors is based on theoretical foundations and previous research in the field of educational pedagogy and educational analytics. Special emphasis is placed on the specifics of professional-applied and general education subjects in vocational studies, in order to ensure the relevance and reliability of the analysis in relation to different educational contexts. The presented factors represent the basis for further analysis and modeling, with the aim of verifying their connection with the academic achievements of students. Table 1, which follows, shows all the input factors that were included in the research and used in the construction of the predictive ANFIS model.
In this research, the quality of teaching was evaluated based on six key factors that, according to the relevant literature, have a significant impact on the academic achievement of students. The first factor, the comprehensibility of the teaching content, refers to the clarity and precision in the presentation of the material, which directly affects the acquisition of knowledge, especially in general education subjects. The applicability of the material represents the ability of students to connect what they have learned with practical situations and real problems, which is especially important in professional-applied courses. The quality of the teaching material includes the availability, up-to-dateness and adaptability of the material to the needs of students, which facilitates the learning process and increases academic success. The commitment of teachers reflects the level of engagement in planning and implementation of teaching, as well as the willingness to provide additional support to students, which positively affects their motivation and results. The working atmosphere during classes includes mutual interaction and communication between students and teachers, creating a stimulating environment for learning. Finally, the objectivity of assessment refers to fairness and transparency in the evaluation of knowledge, which encourages students to feel fair and additional motivation to achieve better results. These factors were integrated into a predictive model with the aim of examining their overall and individual impact on the achievement of vocational students.
Table 1. Input and output parameters
|
Input and output |
Parameters |
Scope |
|
Input 1 |
Understandability |
1-10 |
|
Input 2 |
Applicability |
1-10 |
|
Input 3 |
Quality of teaching and teaching materials |
1-10 |
|
Input 4 |
Teacher commitment |
1-10 |
|
Input 5 |
Working atmosphere |
1-10 |
|
Input 6 |
Objectivity of assessment |
1-10 |
|
Output |
Student achievement (grade) |
5-10 |
Adaptive neuro fuzzy network – ANFIS
Artificial neural networks represent one of the most important models in the field of artificial intelligence, developed with the aim of imitating the process of information processing in the human brain ( Shanmuganathan, S. 2016 ). They consist of interconnected nodes, known as artificial neurons, with each neuron functioning as a basic processing unit with its own local memory for storing and processing data. Communication between neurons takes place through connections that transmit numerical values, which enables the flow and transformation of information through the network. Mathematically speaking, neural networks are based on models that imitate the functional characteristics of biological neurons ( Abdi, H. et al. 1999 , Buchaniec, S. et al. 2021 ). In a biological system, a neuron consists of a body, dendrites and an axon - where the dendrites serve to receive information, the body to process them, and the axon to transmit signals to other neurons ( Stevens, C. F. 1979 ). In the analog model of an artificial neural network, this process is realized through a perceptron - a logical unit that receives input values, processes them and generates an output signal. Such an architecture allows neural networks to be widely used in solving complex tasks of analysis, classification and prediction in various fields, including education ( Mehrotra, K. 1997 ).
The artificial neuron model represents a simple processing unit consisting of three basic levels: input, hidden and output. The input level adjusts the data for processing, the hidden level ensures the nonlinearity of the system, while the output level generates and interprets the final results, Figure 1. Information processing is performed by applying a suitable mathematical function to the input data, which enables the generation of an output signal ( Shanmuganathan, S. 2016 ).
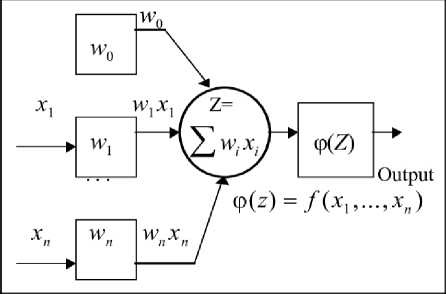
Figure 1. Mathematical model of an artificial neuron (Fountas, Z. 2011)
-
Figure 1 shows the mathematical model of an artificial neuron, where:
-
x1...n – input data, through which the neuron receives the signal,
-
n – the total number of those values,
-
w1...n – weighting coefficients and
φ( ) – activation function.
The input signals are multiplied by the corresponding weighting coefficients, whereby each signal xi is multiplied by its weighting factor wi. After that, all the products are combined in an adder that generates the total input signal of the network.
n x1w1 + x2w2 +... + xnwn = 2 xiwi net = /, xiwi
The resulting value, known as the weighted sum or total excitation of the neuron, does not represent the final output of the neuron. To form the output signal, this value is passed through the activation function, which is responsible for transforming it into the output value labeled “out”. The activation function determines the response of the neuron to the input signal and is usually denoted by the symbol φ(net). Depending on the type of neural network, different types of activation functions are used. In the simplest case, when the weighted sum exceeds the defined activation threshold θ, the output value of the neuron goes into the active state, usually with a value of 1, which indicates the activation of the neuron (Haykin, S. 1998).
out = φ (net - θ)
In artificial neural networks, activation functions convert a weighted sum of inputs into a corresponding output signal and are most often non-linear, which enables the network to solve complex problems. Sigmoid functions such as logarithmic, arctangent or Gaussian functions are most commonly used, especially when the output values are limited. The weight coefficients are adjusted during the learning process through repeated iterations, where the network compares the output values with the expected results and corrects the weights to minimize the error. This procedure allows the network to gradually improve the accuracy of its predictions and achieve the desired behavior ( Anđelković B. 2006 ).
Law of learning
The law of learning is a mathematical model that defines the way of adjusting the weighting coefficients, w ij , between neurons in the network ( Adamović, V. M. 2018 ), where the weight reflects the strength of the interconnectedness of the neurons. The process of updating the weights takes place in accordance with the defined learning rules, among which one of the most commonly applied is the Delta rule, defined by the appropriate formula.
Δω ji = η * γ cj * ε i
Where is it Δωji connection weight adjustment value from the neuron j to neurons i, calculated according to:
Δω ji = ω ji nova - ω ji stara
Where is it:
η is the learning coefficient,
γcj value of the output calculated in the neuron j, εi is the raw error calculated according to, εi = γci - γdi , where is it γdi – the actual output used to calculate the error.
The delta rule, also known as the least mean square rule, aims to minimize the total network error by adjusting the weighting coefficients ( Razeghi, S. A. 2022 ). The key learning parameters are the learning coefficient and the inertia factor, momentum. The learning coefficient determines how much the weights change at each learning step - higher values speed up the process, but may cause instability. Momentum contributes to learning stability by preventing sudden changes in weights, reducing error oscillations, and helping to overcome local minima ( Chong, D. J. S. et al. 2023 ).
The rule base of the ANFIS network consists of if-then rules. A system with two inputs and one output is used to describe these rules:
The rule 1: IF ((x is A1) and (y is B1)) THEN (z is f1)
The rule 2: IF ((x is A2) and (y is B2)) THEN (z is f2)
The following notation is used to define these rules:
-
x, y – input sizes,
z – output size,
Ai, Bi (i=1,2) – fuzzy sets (linguistic variables) and fi (i=1,2) – exits the inference system.
The first layer receives input quantities and transforms them into fuzzy values according to membership functions ( Chong, D. J. S. et al. 2023 ).
Q 1,i = μAi(x) i = 1,2, ... n
Q 1,i = μBi(x) i = 1,2, ... n
Where: x, y – input sizes; Ai , Bi (i=1,2) – fuzzy sets (linguistic variables); μAi , μVi – membership functions.
There are several types of membership functions. In this research, the bell-shaped membership function was used because this function has the greatest ability to regress non-linear data. A bell-shaped membership function, the Bell function is defined as follows:
μ(x) = bell(x; ai, bi , ci) =
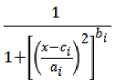
where x is the input quantity, while ai,bi,ci are the given parameters.
The second layer multiplies the phase signals from the first layer and, as a rule, gives the activation power – wi.
Q 2,i = wi = μAi(x) * μBi(x) i = 1,2
The third layer is the rule layers where all signals from the second layer are normalized:
Q 3,i = W£ i = 1,2
The fourth layer is adaptive and provides rule inference and all signals are converted to correct values. Q 4,i = w£ * fi i = 1,2
Functions f1 and f2 are functions from the rule base IF – THEN:
The rule 1: IF ((x is A1) and (y is B1)) THEN (f1=p1x+q1 +r1)
The rule 2: IF ((x is A2) and (y is B2)) THEN (f2=p2x+q2yy +r2), where are they pi , qi , ri (i=1,2) – rule conclusion parameters (consequential parameters).
The fifth layer is fixed and it sums all the signals and displays a fixed output value:
Qs,i f out i W£ * f i
The final output can also be presented in the following way:
Tout = Wi * f I + w2* J 2 — ------- * /1 + ------- * t? =
10111 171 Wi + w2 wr + w2 72
= (wr * x) * pi + (w± * y) * Qi + (iv1)r1 + (iv2 * x) * p2 + {w2 * y) * Q2 + (^2)r2
Modeling of the fuzzy inference system using neural networks enables automatic determination of membership function parameters based on input-output data ( Buragohain, M. et al. 2008 ). The ANFIS network in the first forward pass uses the least squares method to calculate the consequent parameters, while in the backward pass the assumption parameters are updated using the gradient descent method. Training and testing of the ANFIS model were carried out in the Matlab software environment, using the collected experimental data. The accuracy of the model was assessed using the root mean square error, RMSE, which serves as the basic criterion for predictions.
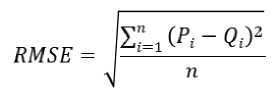
Where are they Pi and Qi experimental and calculated data, respectively, and n is the total number of data.
As part of this research, the processing of the collected data was realized using the software package Matlab, using tools for neuro-fuzzy logic. Before starting the process of processing and training the model, it was necessary to perform several preparatory steps. The first step involved loading a data set containing the values of all input factors and output variables, with the output being in the last column. Then, the initial structure of the model was defined, where the FIS (Fuzzy Inference System) of the Sugeno type with one output was applied, within the framework of the ANFIS architecture (Bakri, R. et al. 2020). For the optimization of membership function parameters, a hybrid method was chosen, which combines the least squares method for determining the consequent parameters and the gradient descent method for setting the assumptions. The learning process parameters involved setting the number of epochs and specifying an acceptable error margin, with training being terminated once either condition was met. Following the training phase, model validation was carried out using an independent test dataset, excluded from training, to evaluate the model’s generalization ability. Furthermore, a comprehensive analysis of the complete dataset was conducted. The outcomes of the modeling are illustrated graphically and explained in detail in the subsequent sections of the paper. For each individual input, the model was trained separately, and the performance assessment was performed through the calculation of several statistical indicators: mean error value, SV, mean deviation, SD, mean square error, MSE, root mean square error, RMSE and Pearson’s linear correlation coefficient, R. Special attention was paid to the RMSE and R values as the main indicators of model accuracy and reliability. A low RMSE and a high value of the R coefficient (over 0.8) were considered indicators of a good predictive ability of the model. The influence of individual input factors was evaluated based on the RMSE value, with the factor with the smallest error during training identified as the most relevant for the prediction of the output size (Ćalasan, M. et al. 2020). Monitoring the RMSE value through the training and testing phases enabled the detection of potential overfitting, while the value of the coefficient R served to check the degree of linear association between the actual and predicted output results (J.-S. R. Jang 1993).
Results
As part of this research, the influence of the quality of teaching on student achievement, expressed through achieved grades in courses, was analyzed. Special attention was focused on the examination of differences in the influence of individual teaching quality factors on the achievement of students attending professional-applied and general education subjects at vocational studies. The collected data were processed using statistical methods and the adaptive neuro-fuzzy system, ANFIS, which enabled a precise analysis of the relationship between the investigated factors.
Results of the model for professional-applicative subjects in professional studies
The research results shown in Table 2 refer to the performance of the ANFIS model during the process of training, testing and overall analysis of all data. By analyzing the value of the root of the mean square error for each of the input factors, it was determined which factor has the greatest influence on the achievement of students in professionally applied subjects. The obtained results show that input factor number 4 - teacher’s commitment - achieved the lowest value of RMSE through all stages of modeling, which indicates that this factor has the most significant predictive influence on the achievement of students in professional studies. This result confirms the assumption that the engagement and commitment of teachers play a key role in achieving better educational outcomes.
Table 2. The influence of one entry on the exit for professionally applied subjects in vocational studies
Input no. 4
TRAINING ERROR
SV = 0.000000 SD = 0.326350 MSE = 0.105795 RMSE= 0.325261
TEST ERROR
SV = 0.097173 SD = 0.251535 MSE= 0.070369 RMSE = 0.265272
ALL DATA
SV = 0.014823 SD = 0.3174 MSE = 0.10039 RMSE = 0.31684
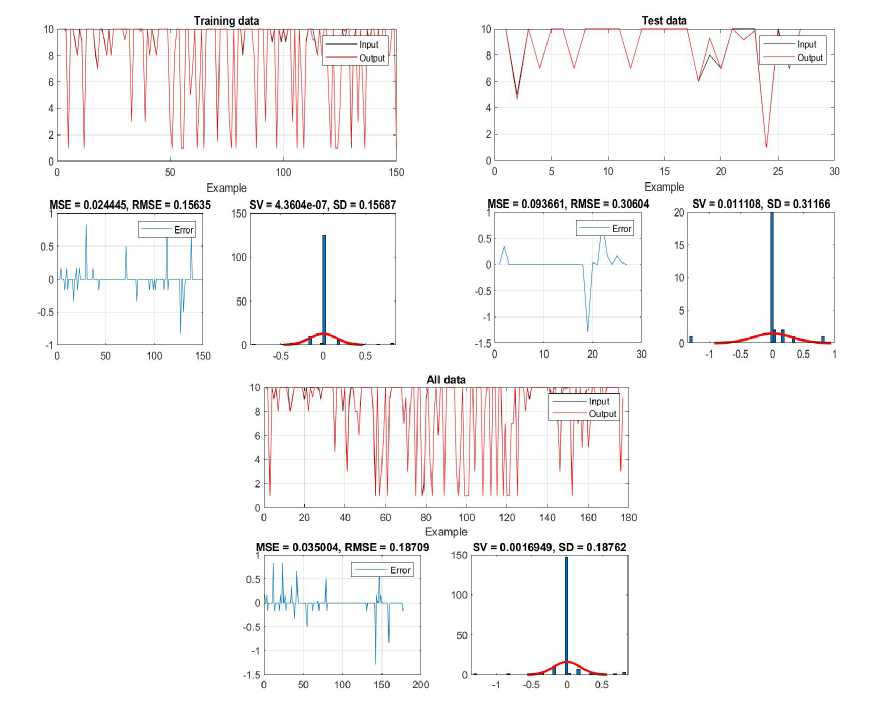
Figure 2 shows the results of error analysis in the stages of training, testing and processing of the entire data set, obtained by applying the ANFIS model. The graphs shown allow detailed monitoring of the model’s behavior and its ability to accurately predict students’ academic achievements at different stages.
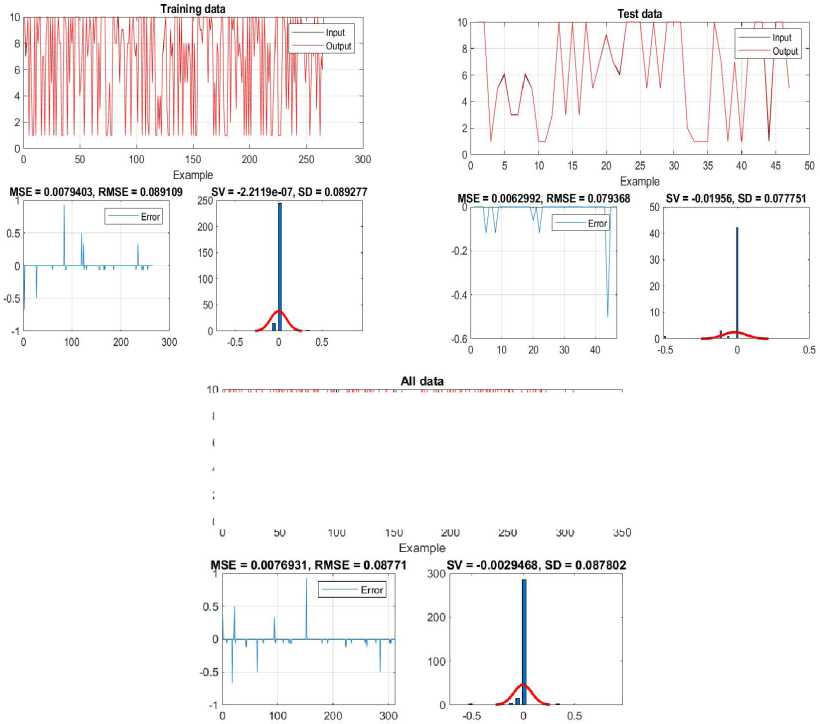
Based on the displayed results from the picture, key statistical indicators were calculated for the purpose of analyzing the performance of the ANFIS model. The values of these parameters are presented individually for the training, testing, and overall dataset. Such a multi-level evaluation enables a thorough examination of the model’s accuracy and reliability across different phases of the analysis. Graphical representations in the figure illustrate the difference between input and output values, the distribution of errors and variations during all analyzed examples, thus confirming the stability and consistency of the developed ANFIS system in predicting the academic achievement of students.
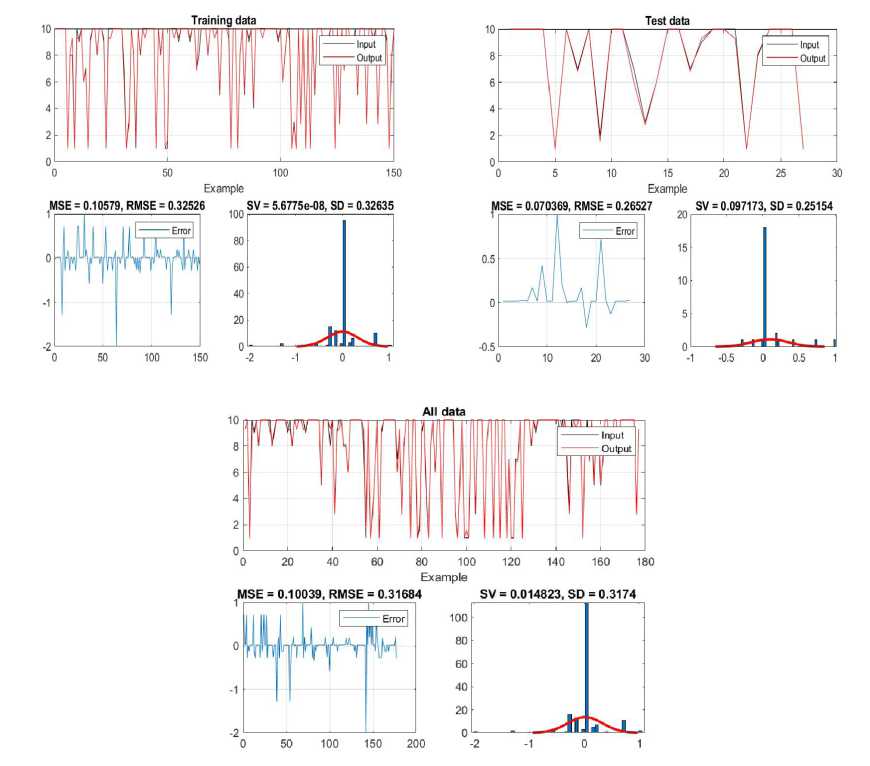
Figure 2. Impact of a single input on achievement - results of training, testing and aggregate data of the ANFIS network
Figure 3 shows the regression analysis that assessed the accuracy and reliability of the developed ANFIS model. This analysis shows the degree of agreement between predicted and actual values. High values of the linear correlation coefficient for training R=0.99438, testing R=0.99721 and all data together R=0.99477 indicate high accuracy of the model. Figure 4 shows a graphic representation of the results for the training data set, where the real values are marked with red stars, and the ANFIS model output with blue dots. A clear match between these values confirms the success of the training process and the ability of the model to accurately predict the output results. These visual representations further facilitate the observation of potential deviations and contribute to a better interpretation of the model’s performance.
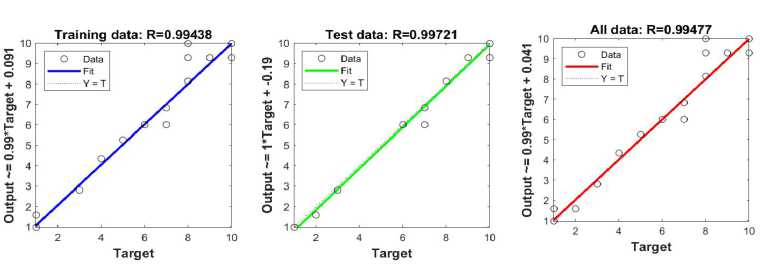
Figure 3. Linear regression of training, test and all data - influence of one input
The high correlation coefficients reported in the regression analysis (R values close to 1) demonstrate a very strong linear relationship between the predicted and actual values. This means that the ANFIS model is able to accurately capture the underlying patterns in the data with minimal error. Since the values for training, testing, and all data are consistently high, it indicates not only that the model has learned effectively during training, but also that it generalizes well to unseen data. Therefore, these results strongly support the reliability and accuracy of the ANFIS model in predicting student success.
-
Figure 4. Graphical interpretation of training data - impact of a single input
By analyzing the results obtained using the ANFIS model, it was determined that the combination of the factors quality of teaching material and teacher’s commitment has the greatest impact on the achievement of students in professional studies, shown in table 3. These two factors together showed the lowest value of the root mean square error RMSE during the modeling process, which indicates their key predictive value in relation to the other analyzed input variables. The obtained results confirm the importance of adequately prepared and relevant teaching content, as well as the high level of teacher engagement in the education process. Their joint influence on students’ achievements is especially evident in professional-applied subjects, where well-designed materials and a dedicated approach to teaching and mentoring have a direct effect on student success. These findings provide important guidelines for improving the teaching process through continuous investment in the development of educational materials and encouraging greater professional engagement of teaching staff.
Table 3. The impact of two inputs on the output for professionally applied subjects in vocational studies
Input no. 3 - 4
TRAINING ERROR
SV = 0.000000 SD = 0.156873 MSE = 0.024445 RMSE= 0.156350
TSEVS=T0E.0R1R11O0R8 SD = 0.311665 MSE = 0.093661 RMSE= 0.306041
ALL DATA
SV = 0.0016949 SD = 0.18762 MSE = 0.035004 RMSE = 0.18709
Figure 5 gives a detailed view of the errors made during the different stages of modeling, with special emphasis on the influence of two combined factors. This comprehensive analysis allows a better understanding of how errors manifest themselves in different conditions and phases of the process, which is important for evaluating the stability and reliability of the model.
-
Figure 5. Effect of two inputs on achievement - results of training, testing and aggregate data of the ANFIS network
Figure 6 shows the regression analysis for the different stages of the ANFIS model: training set, test set and total data set. Each graph shows the relationship between actual (Target) and predicted (Output) values.
For the training data, an extremely high value of the linear correlation coefficient R=0.99882 was obtained, which indicates an almost ideal agreement between the real and modeled values. The graph shows that the adjustment line, the blue line, very precisely follows the ideal diagonal (the Y=T line), which confirms the high level of accuracy during model training.
With the test data, the value of the correlation coefficient is R=0.98997, which also shows a very good predictive ability of the model even on data that was not used in the training phase. The green fitting line shows minimal deviations from the ideal line.
For the total data, the correlation coefficient is R=0.99817, which confirms the general reliability and stability of the model when processing the entire data set.
All three analyzes together indicate that the developed ANFIS model shows a high degree of accu- racy, with very small deviations between predicted and actual values throughout all stages of evaluation.
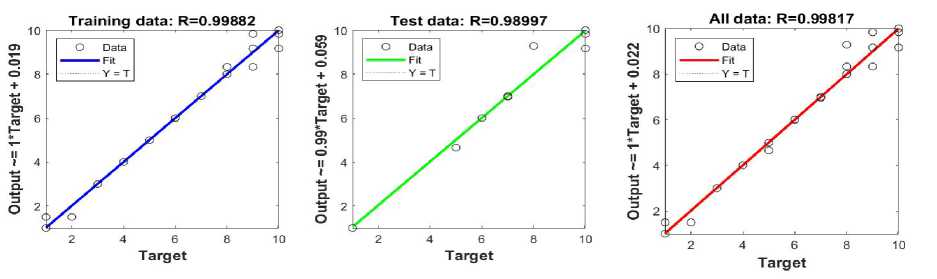
Figure 6. Linear regression of training, test and all data - influence of two inputs
In Figure 7, a 3D surface graphic is presented that illustrates the dependence of the output value, output, on two input parameters, input1 and input2, within the framework of the developed ANFIS model.
This visualization enables an overview of how different combinations of input factor values affect the output result, i.e. student achievement. Areas with different intensities of output values are clearly visible, while the colors on the surface are an indicator of output strength - from lower, blue shades, to higher values, yellow shades.
The surface form of the graph shows a non-linear and complex relationship between the input variables and the output, which confirms the justification of the application of soft computing techniques, such as ANFIS, for modeling such systems. Areas with pronounced increases in output indicate combinations of input factors that contribute most to achievement, while flat or sloping surfaces indicate lower influence.
This three-dimensional representation provides additional insight into the behavior of the model and facilitates the interpretation of the interdependence between the analyzed teaching quality factors.
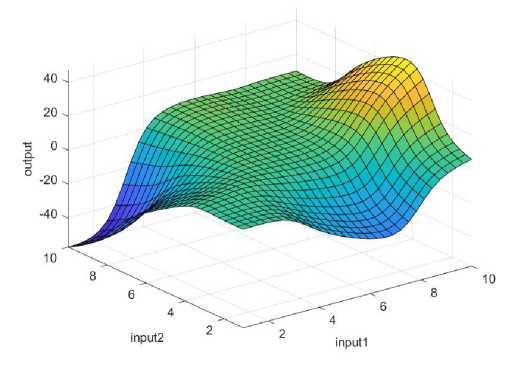
Figure 7. Graphical interpretation of training data - impact of two inputs
Table 4 shows the results of the analysis of the impact of the three most important factors of teaching quality on the academic achievement of students in professional studies. The results clearly indicate that the quality of the teaching material, the dedication of the teachers and the working atmosphere during classes showed the greatest degree of influence on the students’ grades, compared to the other examined factors. The obtained results indicate that the positive perception of students about the clarity and quality of teaching materials, the engagement and motivation of teachers, as well as the creation of a stimulating working atmosphere significantly contributes to their success in professional and applied subjects. These findings provide important guidelines for improving the teaching process and can serve as a basis for further pedagogical guidelines to raise the level of academic success.
Table 4. The impact of three inputs on the output for professionally applied subjects in vocational studies
Input no. 3 - 4 - 5
TRAINING ERROR
SV = 0.000000 SD = 0.057928 MSE = 0.003333 RMSE = 0.057735
TEST ERROR
SV = 0.117917 SD = 0.560167 MSE = 0.316069 RMSE = 0.562200
ALL DATA
SV = 0.017987 SD = 0.22584 MSE = 0.051039 RMSE = 0.22592
Figure 8 shows the result of the analysis of errors obtained during the training, testing and processing of the entire data set. The presented data enable the evaluation of the behavior of the model in different stages of processing, with a focus on the accuracy and stability of the prediction of the academic achievement of students. By analyzing error values, such as RMSE and MSE, it is possible to see the consistency of the model and its ability to generalize to new data. The obtained results provide a basis for assessing the reliability of the applied model and its applicability in predicting educational outcomes.
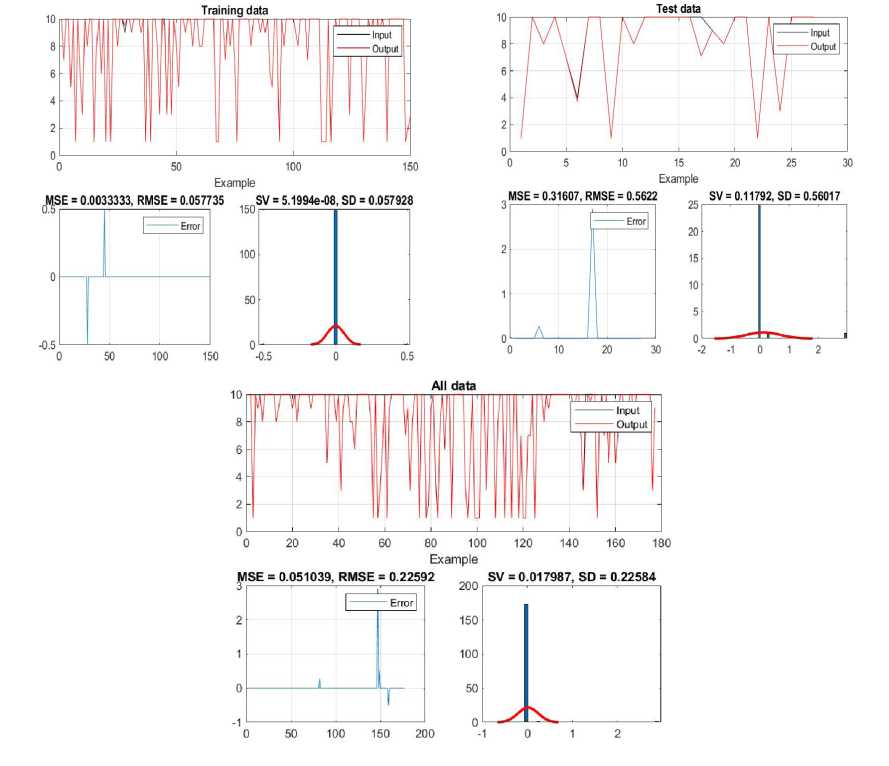
Figure 8. Impact of three inputs on achievement - results of training, testing and overall ANFIS network data
Linear regression analysis was used to assess the degree of association between actual student achievement values and output values generated by the ANFIS model. The linear correlation coefficients obtained during training R=0.99983, testing R=0.98414 and for the entire data set R=0.99735 indicate the high reliability and precision of the ANFIS model in predicting academic success, shown in Figure 9.
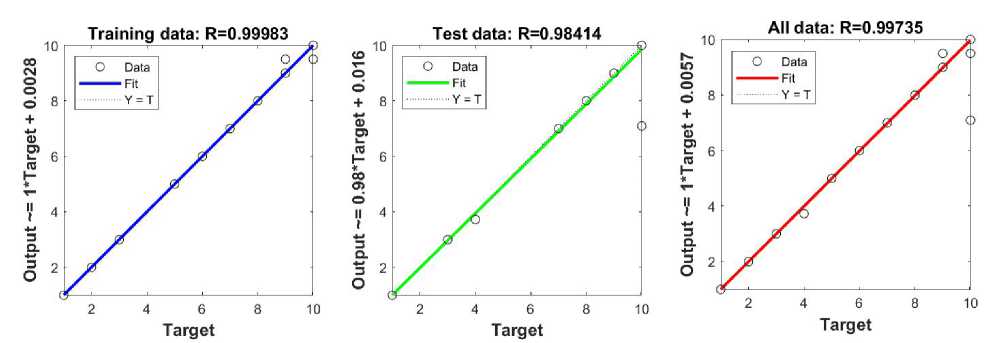
Figure 9. Linear regression of training, test and all data - influence of three inputs
The high linear correlation coefficients (R values close to 1) suggest that the ANFIS model has a strong ability to predict academic success with high reliability and precision. They indicate that the model’s predicted values are very closely aligned with the actual student achievement values, confirming both its accuracy and its effectiveness in generalizing to new data. The graphical interpretation of the training data for the three input factors is shown through a three-dimensional (3D) diagram illustrating the interdependence between the input variables and the output value of the model, shown in Figure 10. The horizontal axes show the values of the two input factors (the quality of the teaching material and the teacher’s commitment), while the vertical axis shows the output - the prediction of student achievement. The graph surface clearly shows how changing the input factors affects the output variable, allowing a visual insight into the complex non-linear relationships that the model successfully detected during the training process.
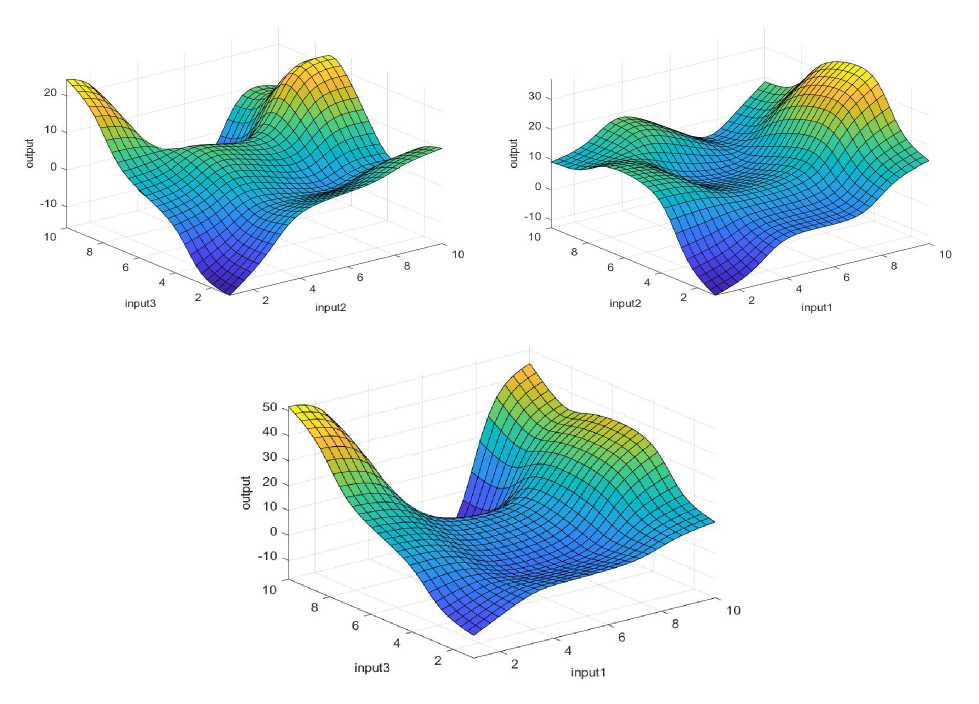
Figure 10. Graphical interpretation of training data - impact of three inputs
Model results for general education subjects in vocational studies
When analyzing the most influential factor for the achievement of students in general education subjects, the results shown in Table 5 clearly indicate that the comprehensibility of the teaching content has the greatest influence. This factor produced the lowest error value during training, highlighting its crucial role in influencing students’ achievement in these subjects. The findings emphasize the significance of clear and accurate knowledge transfer for improving educational outcomes in general education courses.
Table 5. The i mpact of one entrance on the exit for general education subjects in voca tional studies
Input no. 1
TRAINING ERROR
SV = 0.000000 SD = 0.135392 MSE= 0.018262 RMSE= 0.135136
TEST ERROR
SV = -0.045601 SD = 0.199284 MSE= 0.040949 RMSE= 0.202358
ALL DATA
SV = -0.0068693 SD = 0.14732 MSE = 0.021679 RMSE = 0.14724
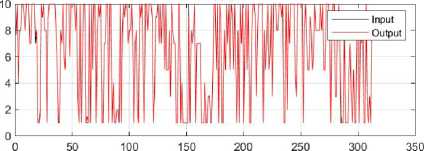
Figure 11 shows a detailed analysis of errors in different stages of the process, with special emphasis on the influence of one factor in general education subjects. Error analysis across training, testing, and the entire data set demonstrates the model’s satisfactory ability to recognize patterns and trends, providing valuable insights into examinee performance in the context of observed factors.
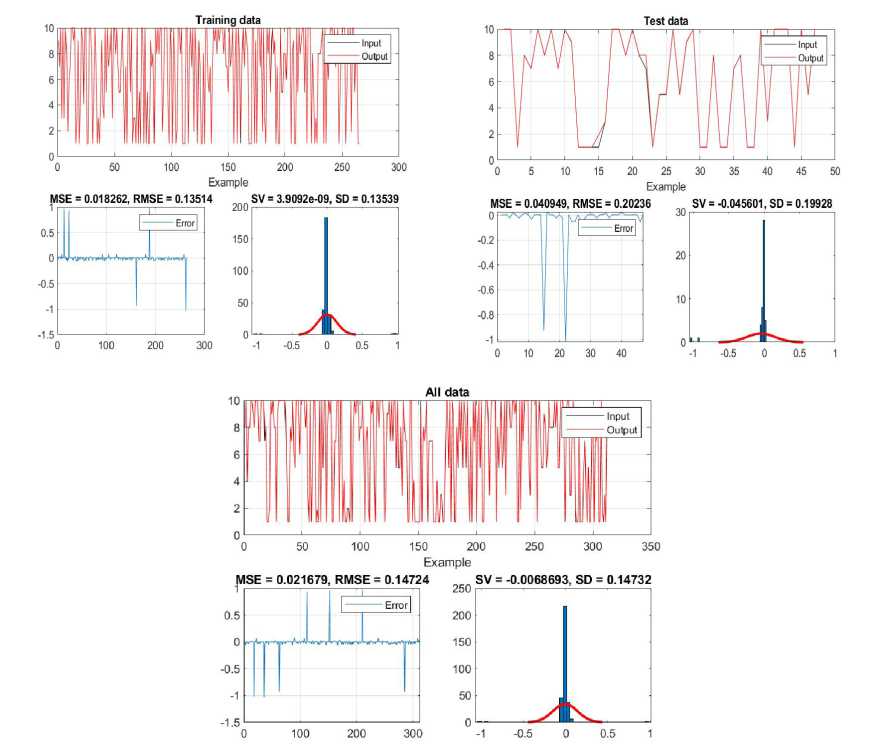
Figure 11. Impact of a single input on achievement - results of training, testing and aggregate data of the ANFIS network
Figure 12 shows the results of the regression analysis and the reliability of the model with the influence of one factor on general education subjects, which helps to assess its accuracy in predicting the target size. The linear correlation coefficient for the training data is R=0.99927, for the test R=0.99859, and for all data R=0.99915. Figure 13 graphically shows the training data and outputs of the ANFIS model, showing good matching and successful model training with this model as well.
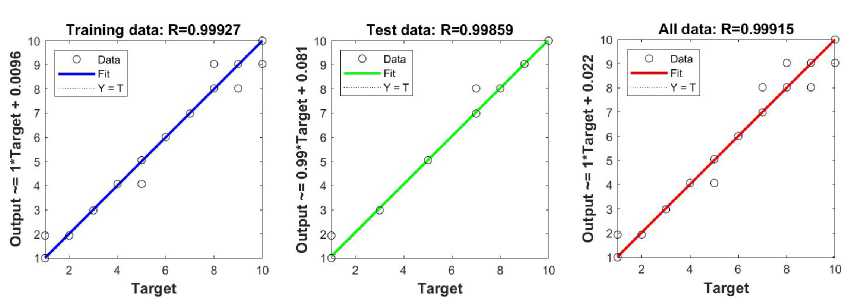
Figure 12. Linear regression of training, test and all data - influence of one input
The correlation coefficients can be influenced by several factors, including the size and diversity of the training and testing datasets, the presence of noise or outliers in the data, and the model’s ability to capture underlying patterns without overfitting. Slight differences between training, test, and full dataset R values may reflect how well the model generalizes to unseen data. If the test R value is close to the training R value, as in this case, it suggests that the model has strong predictive power and generalizability. Larger discrepancies, however, would indicate possible overfitting or insufficient representation of variability in the training set.
-
Figure 13. Graphical interpretation of training data - impact of a single input
The analysis of the influence of combined factors on the achievement of students in general education subjects, shown in Table 6, showed that the combination of the comprehensibility of the teaching content and the commitment of the teacher has the greatest impact on academic success. These two factors, considered together, gave the lowest error value during modeling, which indicates their synergistic role in the learning process. The results confirm that clarity in the transfer of knowledge, combined with the engagement and motivation of teachers, significantly contributes to achieving better educational results for students in general education subjects.
Table 6. The i mpact of two entrances on the exit for general education subjects in voc ational studies
Input no. 1 - 4
TRAINING ERROR
SV = -0.000000 SD = 0.089277 MSE= 0.007940 RMSE= 0.089109
TEST ERROR
SV = -0.019560 SD = 0.077751 MSE= 0.006299 RMSE= 0.079368
ALL DATA
SV = -0.0029468 SD = 0.087802 MSE = 0.0076931 RMSE = 0.08771
Figure 14 provides a representation of errors through all stages of modeling, indicating a satisfactory ability of the model to identify patterns and trends resulting from the interaction of two combined factors, which allows for a deeper understanding of their impact on achievement.
-
Figure 14. Effect of two inputs on achievement - results of training, testing and aggregate data of the ANFIS network
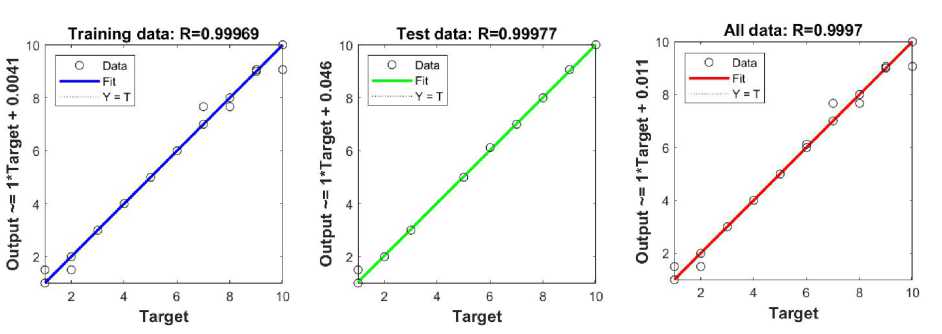
Figure 15 shows the regression analysis and reliability of the model for the two combined factors, which is important for assessing the accuracy of the predictions. Linear correlation coefficients are R=0.99969 for training, R=0.99977 for test and R=0.9997 for all data. Figure 16 shows a 3D graph illustrating the dependence of motivation on two inputs (input1 and input2), randomly selected to identify the most influential factors. The colors on the graph indicate the levels of motivation: blue - low, green - medium, yellow - high. This visual representation enables the quick identification of areas with different levels of motivation and contributes to a better understanding of the influence of the analyzed factors, in this case inputs 1 and 4.
-
Figure 15. Linear regression of training, test and all data - influence of two inputs
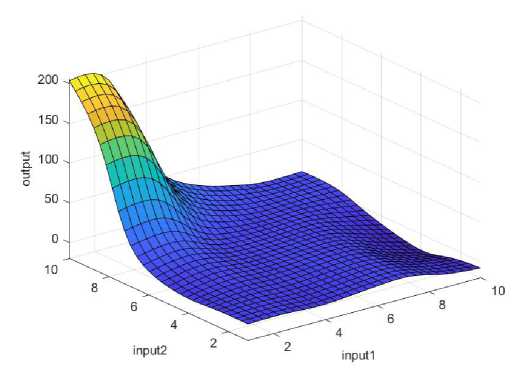
Figure 16. Graphical interpretation of training data - impact of two inputs
When examining the impact of the three combined factors - comprehensibility, applicability and teacher commitment - on student achievement, shown in Table 7, it is noted that these factors together have the smallest model error, which indicates their greatest joint impact on achievement. This combination of factors makes a notable contribution to explaining the variability in student achievement, reaffirming the importance of presentation clarity, the relevance of teaching content, and teacher engagement in the learning process.
Table 7. The im pact of three inputs on output for general education subjects in vo cational studies Input no. 1 - 2 - 4
TRAINING ERROR
SV = -0.000000 SD = 0.061570 MSE= 0.003777 RMSE= 0.061454
TEST ERROR
SV = -0.048832 SD = 0.198678 MSE= 0.041017 RMSE= 0.202528
ALL DATA
SV = -0.0073562 SD = 0.09676 MSE = 0.0093866 RMSE = 0.096884
Figure 17 shows the influence of the three combined factors on the accuracy of the model through the analysis of errors during training, testing and on the entire data set. This kind of analysis makes it possible to see how the joint action of these factors affects the precision of predictions and the overall reliability of the model in different phases of work. And with this model, all errors are satisfactory.
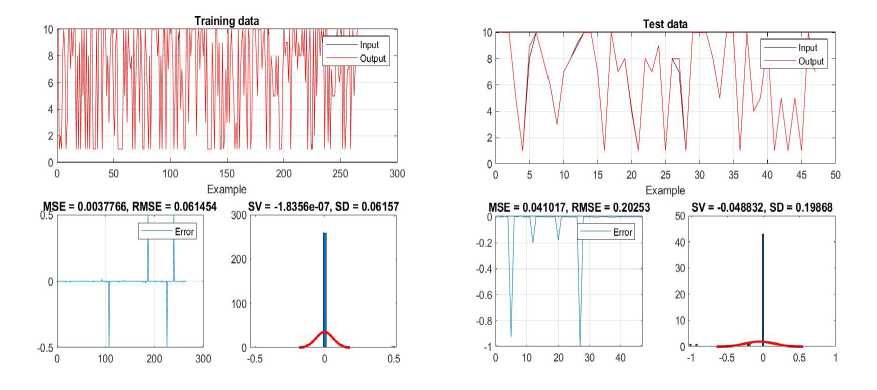
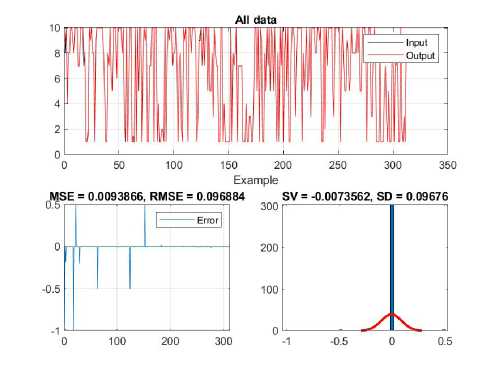
Figure 17. Impact of three inputs on achievement - results of training, testing and overall ANFIS network data
The linear correlation coefficient, Figure 18, for the training set is R=0.99985, for the test set R=0.99822, while for the entire data set it is R=0.99963, which indicates the high accuracy of the model. Figure 19 shows a graphical interpretation of the training data for combinations of inputs 1 and 2, 1 and 4, as well as 2 and 4. The display illustrates how different randomly selected combinations of input parameters affect the output value. The color distribution on the graph indicates the output level – blue for low values, green for medium and yellow for high. This visualization enables the clear recognition of areas with significant output changes, providing insight into the impact of each individual combination of the three most important factors on the final result.
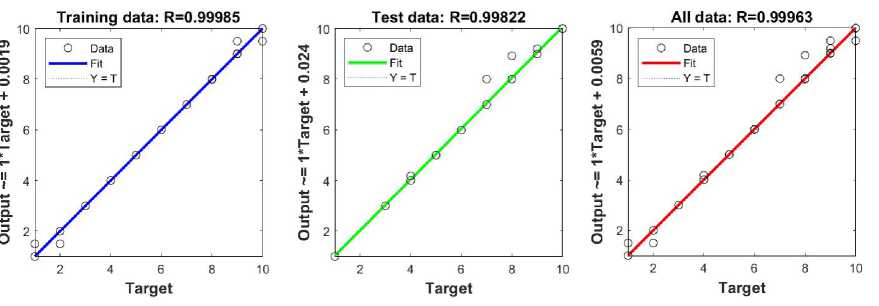
Figure 18. Linear regression of training, test and all data - influence of three inputs
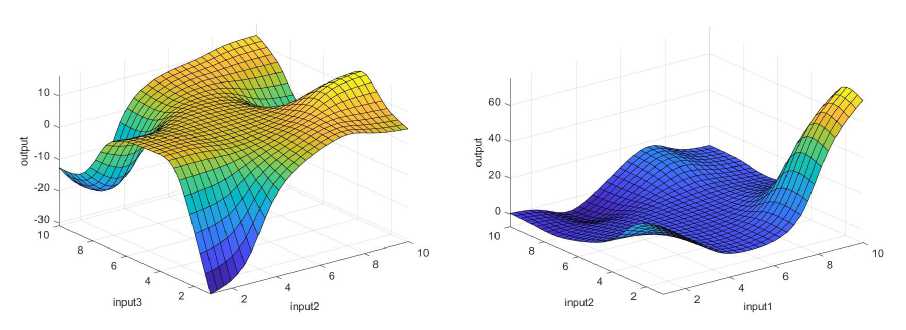
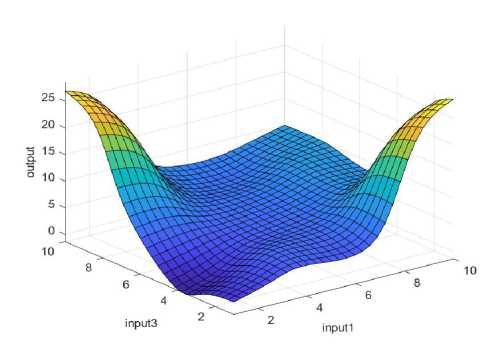
Figure 19. Graphical interpretation of training data - impact of three inputs
Discussions
As part of this research, a comparative analysis of the influence of various factors on the achievement of respondents in vocational studies was carried out, whereby two groups of subjects were observed -professional-applicative and general education. The analysis enabled a deeper insight into the specificities that characterize each of these groups, both in terms of individual factors and their mutual combinations.
In professional-applied subjects, the results showed that the teacher’s commitment is the single most important factor that affects the achievement of the examinees. When the combined factors were analyzed, the most pronounced impact was recorded in the combination of the quality of teaching and teaching materials together with the commitment of the teacher, while in the analysis of three factors it was shown that the additional inclusion of the working atmosphere in the class additionally contributes to the accuracy of the prediction and the explanation of the variance in achievements.
On the other hand, the results obtained for general education subjects indicate a somewhat different pattern of influence. At the level of individual factors, comprehensibility of the material stood out as the most influential factor. In the case of the combination of two factors, the greatest impact on the achievement of the respondents was the connection between comprehensibility and commitment of the teacher, while in the model with three combined factors, the most significant effect was achieved by combining comprehensibility, applicability of the material and commitment of the teacher.
Such results indicate that there are specific differences in the factors that contribute the most to academic achievement depending on the type of subject. In vocational and applied subjects, the primary contribution comes from factors associated with the quality of practical teaching implementation and teacher involvement, whereas in general education subjects, the clarity and relevance of the content take precedence, with the teacher’s dedication remaining a consistently significant factor.
This analysis confirms that in order to improve the educational process, it is necessary to adapt approaches and work methods to the specifics of each group of subjects, with a special focus on the most influential factors identified by this research. The obtained results can serve as guidelines for the further development of teaching strategies and improvement of the quality of teaching at professional studies.
Conclusions
This research aimed to identify and analyze the key factors that influence the achievement of respondents in vocational studies, through the application of soft computing approaches, specifically the ANFIS model. Through the comparative analysis of two groups of subjects - professional-applicative and general education - significant insights into different patterns of influence of individual and combined factors were obtained.
The results showed that in vocational-applied subjects, the most significant single factor relates to the teacher’s commitment, while the most influential combined factors included the quality of teaching, the quality of teaching materials and the working atmosphere in the class. On the other hand, in the case of general education subjects, the most prominent single factor was the comprehensibility of the material, while in combinations the key influence was the comprehensibility, applicability and dedication of the teacher.
The application of the ANFIS model proved to be an effective method for analyzing the influence of several factors simultaneously, with satisfactory error values and a high degree of accuracy in predicting achievement. This methodology enabled accurate modeling of complex patterns of interdependence between factors and target size.
Bearing in mind the specificity of the identified factors depending on the type of subject, the results of this research can serve as a basis for improving teaching methods and strategies in higher education. By applying the findings in practice, educational institutions can develop targeted interventions aimed at improving key aspects of teaching.
As a direction for future research, it is recommended to expand the sample to other educational levels and different study programs, as well as to include additional factors that could have a significant impact on academic achievements, such as motivation, learning approaches and forms of knowledge evaluation. Also, it would be useful to apply other methods of artificial intelligence and soft computing approaches, in order to additionally check the reliability and generalization of the obtained results. Additional longitudinal research could provide deeper insight into the long-term impact of the identified factors on academic success.
Acknowledgements
The authors thank all respondents and the academic community of the Academy of Vocational Studies in Šumadija for supporting the research conducted at the Trstenik Department on a sample of vocational students from various information technology programs.
Funding
This research did not receive any specific grant from funding agencies in the public, commercial, or not-for-profit sectors.
Conflict of interests
The authors declare no conflict of interest.
Data availability statement
The original contributions presented in the study are included in the article, further inquiries can be directed to the corresponding author.
Institutional Review Board Statement
Not applicable.
Author Contributions
Conceptualization, M.M., M.S. and S.P; methodology, M.M., M.S. and S.P; software, S.P. and S.B..; formal analysis, M.M. and M.T.; writing—original draft preparation, M.M. and M.S.; writing—review and editing, S.B. and M.T. All authors have read and agreed to the published version of the manuscript.
