Prediction of Defect Prone Software Modules using MLP based Ensemble Techniques

Author: Ahmed Iqbal, Shabib Aftab
Journal: International Journal of Information Technology and Computer Science @ijitcs
Article in issue: 3 Vol. 12, 2020.
Free access
Prediction of defect prone software modules is now considered as an important activity of software quality assurance. This approach uses the software metrics to predict whether the developed module is defective or not. This research presents MLP based ensemble classification framework to predict the defect prone software modules. The framework predicts the defective modules by using three dimensions: 1) Tuned MLP, 2) Tuned MLP with Bagging 3) Tuned MLP with Boosting. In first dimension only the MLP is used for the classification after optimization. In second dimension, the optimized MLP is integrated with bagging technique. In third dimension, the optimized MLP is integrated with boosting technique. Four publically available cleaned NASA MDP datasets are used for the implementation of proposed framework and the performance is evaluated by using F-measure, Accuracy, Roc Area and MCC. The performance of the proposed framework is compared with ten widely used supervised classification techniques by using Scott-Knott ESD test and the results reflects the high performance of the proposed framework.
Software Defect Prediction, MLP, Ensemble Classification techniques, Software Metrics
Short address: https://sciup.org/15017452
IDR: 15017452 | DOI: 10.5815/ijitcs.2020.03.04
Text of the scientific article Prediction of Defect Prone Software Modules using MLP based Ensemble Techniques
Published Online June 2020 in MECS
Testing is one of the important activities of Software Development Life Cycle which ensures the delivery of high quality product. However, it has been reported that software testing is also considered as one of the expensive activities of development lifecycle as it consumes more resources as compare to any other activities [8,9,10]. To produce high quality product, all the modules of developing software should be thoroughly tested [7,10] and that is why testing require more resources. Testing cost can be reduced if the defect prone software modules are predicted at early stage of development (before testing) [11,12,13]. With this approach the quality of end product would not be affected as only those modules will be thoroughly tested which would be predicted as defective. This prediction belongs to the class of binary classification problem. Many researchers have solved the binary classification problems by using machine learning techniques such as sentiment analysis/classification [14,15,16,17,18,19], rainfall prediction [20,21], detection of DoS attacks [22,23] and software defect prediction [1,2,3], [25,26,27]. Machine learning techniques are categorized into three types: 1) supervised, 2) unsupervised, and 3) hybrid. Supervised machine learning techniques use the pre-labeled/classified data (training data) for training, in which classification rules are developed which are later used to classify the unseen data (test data). In unsupervised machine learning techniques classes are not known in advance so the special algorithms are used to identify the structure/group of data. Finally the hybrid is the integration of both (supervised and unsupervised). Various frameworks and techniques have been proposed by the researchers to predict the defect prone software modules however most of the researchers have used different datasets. This research proposes MLP based ensemble classification framework to predict the defect prone software modules. The framework uses three dimensions to predict the defective modules. In fist dimension, Multi-Layer Perceptron, a well-known Artificial Neural Network is optimized by tuning its parameters. In second dimension, the tuned MLP (tuned in first dimension) is ensemble with bagging technique. In third dimension, the tuned MLP (tuned in first dimension) is ensemble with boosting technique. To validate the proposed framework, four widely used NASA MDP cleaned datasets are used and the performance is evaluated by using: F-measure, Accuracy, Roc Area and MCC. The results of the proposed framework including all three dimensions are compared with the results of a published research [1], in which ten well known supervised base classifiers were used for the prediction of defect prone software modules by using the same datasets which are used in this research (NASA MDP cleaned). The classification techniques with which the proposed framework is compared are: “Naïve Bayes (NB), Multi-Layer Perceptron (MLP), Radial Basis Function (RBF), Support Vector Machine (SVM), K Nearest Neighbor (KNN), kStar (K*), One Rule (OneR), PART, Decision Tree (DT), and Random Forest (RF)”. The comparison is performed by using Scott-Knott ESD test which showed the higher performance of our proposed framework.
II. Related Work
Many researchers have used machine learning techniques to predict the software defects at early stage of SDLC. Some of the related studies are discussed here. In [1], the researchers predicted the defect prone software modules by using various supervised classification techniques including “Naïve Bayes (NB), Multi-Layer Perceptron (MLP). Radial Basis Function (RBF), Support Vector Machine (SVM), K Nearest Neighbor (KNN), kStar (K*), One Rule (OneR), PART, Decision Tree (DT), and Random Forest (RF)”. The researchers performed the experiments by using twelve widely used NASA MDP datasets and evaluated the performance by using: Precision, Recall, F-Measure, Accuracy, MCC, and ROC Area.
According to researchers the provided results in this study can be used as a baseline for other researchers so that any claim of improvement in prediction with new proposed technique can be verified so, we have compared the performance of our proposed framework with [1]. Researchers in [2] presented a classification framework to predict defect prone software modules. The framework is implemented with two dimensions, 1) with the feature selection, 2) without feature selection. Experiments are performed on cleaned NASA MDP datasets and performance analysis is performed by using: “Precision, Recall, F-measure, Accuracy, MCC and ROC”.
Performance of the proposed framework including both dimensions is compared with other supervised classification techniques from research [1]. According to results, the proposed framework outperformed other techniques in some datasets. Researchers in [3] analyzed the performance of three well known resampling techniques while predicting the defect prone software modules using same classification techniques which were used in [1]. The used resampling techniques are: “Random Under Sampling”, “Random Over Sampling” and “Synthetic Minority Oversampling Technique (SMOTE)”. NASA cleaned MDP datasets were used for experiments and the performance is analyzed by using: F-measure, Accuracy, MCC and ROC. The performance of all three resampling techniques are compared with the supervised classification techniques used in [1] where no technique was used to remove the class imbalance issue. The results reflected that “Random Over Sampling” performed well among other techniques. Researchers in [4] presented a feature selection based ensemble classification framework to predict defect prone software modules. The framework is implemented on six publically available Cleaned NASA MDP datasets and the performance is analyzed by using F-measure, Accuracy, MCC and ROC. The performance is compared with 10 supervised classification techniques from [1] and the results showed that the proposed framework outperformed all of other techniques. Researchers in [5], presented an integrated technique by using Hybrid Genetic algorithm and Deep Neural Network. Optimum feature set is selected by Hybrid Genetic algorithm whereas Deep Neural Network is used to predict the software defects. The proposed technique is implemented on various datasets obtained from PROMISE repository and results showed the higher performance of proposed technique when compared to other methods.
III. Materials and Methods
This research proposes MLP based ensemble classification framework for software defect prediction which consists of three stages: 1) Dataset selection, 2) Classification and 3) Reflection of results. The proposed framework provides the results with three different dimensions: 1) Optimized MLP, 2) Bagging- Optimized MLP, and 3) Boosting- Optimized MLP.
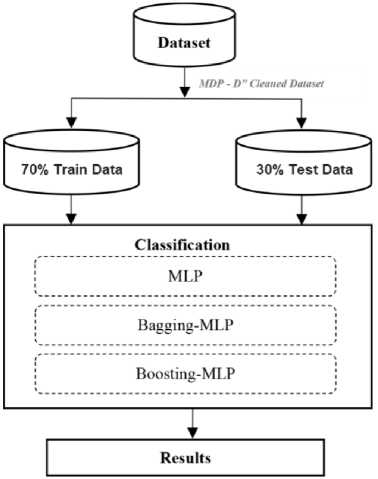
Fig.1. Proposed Framework
First stage of the proposed framework deals with the selection of relevant dataset. Any software defect dataset can be used with the proposed framework however we have used four cleaned versions of NASA MDP benchmark datasets including: KC1, MW1, PC4 and PC5 (Table I). Each of the used dataset consists of various features/attributes including the target class. The target class which is also known as dependent attribute is the one which is going to be predicted. This attribute consists of either of the following two values: ‘y’ and ‘N’. ‘Y’ reflects the defect(s) in the modules and ‘N’ reflects that the particular module is clean. Other attributes in the datasets are known as independent attributes and are used to predict the output class.
The NASA software defect datasets have been widely used by the researchers to validate the defect prediction models as these are publicly available as researchers of this field can verify the claimed accuracy and can work further for improvements. Two cleaned version were provided by [28] of NASA MDP datasets, DS’ and DS’’. We have used D’’ version, currently available at [29]. Many researches have used these datasets [1,2,3], [30,31,32].
Table 1. Used NASA Cleaned Datasets D’’ [28]
|
Dataset |
Attributes |
Modules |
Defective |
Non-Defective |
Defective (%) |
|
KC1 |
22 |
1,162 |
294 |
868 |
25.3 |
|
MW1 |
38 |
250 |
25 |
225 |
10 |
|
PC4 |
38 |
1,270 |
176 |
1094 |
13.8 |
|
PC5 |
39 |
1694 |
458 |
1236 |
27.0 |
The experiments are performed in WEKA, which is considered as one of the widely used data mining tool [24].
Second stage classifies the datasets into defective and non-defective modules by using three dimensions: 1) Optimized MLP, 2) Bagging-Optimized MLP, and 3) Boosting-Optimized MLP. We have used the term ‘optimized’ with MLP because four of its parameters are tuned in WEKA (Table 2) to achieve high performance by following the hit and trial method. The input datasets are given to classification models with the ratio of 70:30 (70 % training data and 30% test data). MLP (Multi-Layer Perceptron) is a type of Artificial Neural Network (ANN) which uses back-propagation technique for learning. An ANN is inspired by biological neural system of human brain. These networks are considered as non-linear supervised classifiers which can model complex relations between inputs and outputs. The structure of MLP consists of three portions 1) input layer, 2) hidden layer(s), 3) output layer (Fig 2). At least one hidden layer should be existed in MLP network (number of hidden layers can also be increased) .
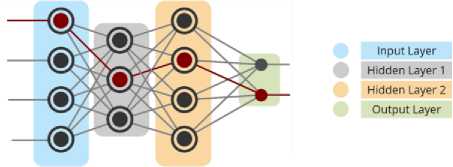
Fig.2. Multi-Layer Perceptron Architecture
Table 2. MLP Configuration
|
Parameter |
Value |
|
Hidden layers |
2 |
|
No of neurons in 1st hidden layer |
20 |
|
No of neurons in 2nd hidden layer |
20 |
|
Learning Rate |
0.1 |
|
momentum |
0.3 |
Ensemble learning technique integrates the multiple classification models (weak learners) under the umbrella of meta-algorithm to solve the one/same problem with higher accuracy. Three meta algorithms are widely used including: bagging, boosting and stacking. In this research we have used bagging and boosting. Bagging focuses on homogeneous weak learners where the classifiers learns in parallel and independent from each other and finally result is combined by following a deterministic averaging process. Boosting on the other hand focuses on homogeneous weak learners where the classifiers learn in a particular sequential order where a base model depends on the previous one and the result is combined by following a deterministic strategy.
Third and final stage of the proposed framework deals with the reflection of results which is discussed in the next section in detail.
IV. Results and Discussion
Performance of the proposed framework including all three dimensions is evaluated with four widely used accuracy measures such as: F-measure, Accuracy, MCC and ROC. All of these performance measures are generated from the parameters of confusion matrix. Fig 3 reflects the confusion matrix for the problem of software defect prediction which consists of following parameters [1,2,3].
True Positive (TP): “Instances which are actually positive and also classified as positive”.
False Positive (FP): “Instances which are actually negative but classified as positive”.
False Negative (FN): “Instances which are actually positive but classified as negative”.
True Negative (TN): “Instances which are actually negative and also classified as negative”.
Actual Values
Defective (Y) Non-defective (N)
|
0) m Defective (Y) ~ Non-defective (N) CL |
TP |
FP |
|
FN |
TN |
Fig.3. Confusion Matrix
The formulas of used performance measures are given below. To calculate the F-measure, we have to calculate two measures first: Precision and Recall as F-measure is the average of these two measures [1,2,3].
TP
Precision =---------- ( TP + FP )
Re call =
TP
(TP + FN )
Precision * Recall * 2
F-measure =-------------------- (3)
(Precision + Recall)
|
TP + TN Accuracy =---------------- TP + TN + FP + FN |
(4) |
|
AUC = 1 + TP - FP r |
(5) |
|
2 |
TN*TP-FN*FP
MCC = , ^ (6)
Д ( FP + TP )( FN + TP)(TN + FP )(TN + FN )
We have compared the results of all three dimensions of the proposed framework with 10 widely used supervised machine learning classifiers in Table 3,4,5,6. The results of the 10 classifiers including: “Naïve Bayes (NB), Multi-Layer Perceptron (MLP), Radial Basis Function (RBF), Support Vector Machine (SVM), K Nearest Neighbor (KNN), kStar (K*), One Rule (OneR), PART, Decision Tree (DT), and Random Forest (RF)” are taken from a published paper [1]. The published paper [1] has used the same datasets and accuracy measures which we have used in this research.
Table 3. KC1 Results
|
Classifier |
F-Measure |
Accuracy |
ROC Area |
MCC |
|
NB |
0.400 |
74.212 |
0.694 |
0.250 |
|
RBF |
0.362 |
78.796 |
0.713 |
0.347 |
|
SVM |
0.085 |
75.358 |
0.521 |
0.151 |
|
kNN |
0.395 |
69.341 |
0.595 |
0.190 |
|
kStar |
0.419 |
72.206 |
0.651 |
0.238 |
|
OneR |
0.256 |
73.352 |
0.551 |
0.147 |
|
PART |
0.255 |
76.504 |
0.636 |
0.239 |
|
DT |
0.430 |
75.644 |
0.606 |
0.291 |
|
RF |
0.454 |
77.937 |
0.751 |
0.346 |
|
MLP |
0.358 |
77.363 |
0.736 |
0.296 |
|
OPT-MLP |
0.497 |
79.083 |
0.721 |
0.389 |
|
Bagging-OPT-MLP |
0.339 |
77.650 |
0.738 |
0.300 |
|
Boosting-OPT-MLP |
0.497 |
79.083 |
0.673 |
0.389 |
It can be seen that OPT-MLP and Boosting-OPT-MLP performed well in F-measure, Accuracy and MCC however in ROC Area RF performed better.
Results of MW1 dataset is shown in Table 4 which reflects that in F-measure MLP and Boosting-OPT-MLP performed well whereas MLP, OPT-MLP, Bagging-OPT-MLP and Boosting-OPT-MLP performed well in Accuracy. In ROC Area, OPT-MLP performed well and in MCC, MLP and Boosting-OPT-MLP both outperformed others.
Results of PC4 datasets are reflected in Table 5 which shows that Bagging-OPT–MLP performed better than others classifiers in F-measures whereas OPT-MLP and Boosting-OPT–MLP performed better in Accuracy and MCC. On the other hand RF performed better in Roc Area.
Table 4. MW1 Results
|
Classifier |
F-Measure |
Accuracy |
ROC Area |
MCC |
|
NB |
0.435 |
82.666 |
0.791 |
0.367 |
|
RBF |
? |
89.333 |
0.808 |
? |
|
SVM |
? |
89.333 |
0.500 |
? |
|
kNN |
0.444 |
86.666 |
0.705 |
0.373 |
|
kStar |
0.133 |
82.666 |
0.543 |
0.038 |
|
OneR |
0.200 |
89.333 |
0.555 |
0.211 |
|
PART |
0.167 |
86.666 |
0.314 |
0.110 |
|
DT |
0.167 |
86.666 |
0.314 |
0.110 |
|
RF |
0.182 |
88.000 |
0.766 |
0.150 |
|
MLP |
0.632 |
90.666 |
0.843 |
0.589 |
|
OPT-MLP |
0.588 |
90.666 |
0.873 |
0.537 |
|
Bagging-OPT-MLP |
0.533 |
90.666 |
0.864 |
0.483 |
|
Boosting-OPT-MLP |
0.632 |
90.666 |
0.852 |
0.589 |
Table 5. PC4 Results
|
Classifier |
F-Measure |
Accuracy |
ROC Area |
MCC |
|
NB |
0.404 |
86.089 |
0.807 |
0.334 |
|
RBF |
0.250 |
87.401 |
0.862 |
0.279 |
|
SVM |
0.286 |
88.189 |
0.583 |
0.342 |
|
kNN |
0.438 |
85.826 |
0.667 |
0.359 |
|
kStar |
0.330 |
81.889 |
0.734 |
0.225 |
|
OneR |
0.361 |
87.926 |
0.614 |
0.352 |
|
PART |
0.481 |
85.301 |
0.776 |
0.396 |
|
DT |
0.583 |
86.876 |
0.834 |
0.514 |
|
RF |
0.532 |
90.288 |
0.945 |
0.516 |
|
MLP |
0.562 |
89.763 |
0.898 |
0.515 |
|
OPT-MLP |
0.634 |
92.126 |
0.892 |
0.622 |
|
Bagging-OPT -MLP |
0.652 |
91.601 |
0.934 |
0.612 |
|
BoostingOPT -MLP |
0.634 |
92.126 |
0.836 |
0.622 |
Table 6. Pc5 Results
|
Classifier |
F-Measure |
Accuracy |
ROC Area |
MCC |
|
NB |
0.269 |
75.393 |
0.725 |
0.245 |
|
RBF |
0.235 |
75.590 |
0.732 |
0.251 |
|
SVM |
0.097 |
74.212 |
0.524 |
0.173 |
|
kNN |
0.498 |
73.031 |
0.657 |
0.314 |
|
kStar |
0.431 |
69.881 |
0.629 |
0.227 |
|
OneR |
0.387 |
71.259 |
0.594 |
0.209 |
|
PART |
0.335 |
75.787 |
0.739 |
0.274 |
|
DT |
0.531 |
75.000 |
0.703 |
0.361 |
|
RF |
0.450 |
75.984 |
0.805 |
0.322 |
|
MLP |
0.299 |
74.212 |
0.751 |
0.216 |
|
OPT-MLP |
0.282 |
75.984 |
0.743 |
0.272 |
|
Bagging-OPT-MLP |
0.408 |
77.165 |
0.778 |
0.333 |
|
Boosting-OPT-MLP |
0.304 |
74.803 |
0.725 |
0.235 |
Table 6 shows the results of PC5 dataset. It can be observed that DT performed better than others in F-measure and MCC, Bagging- OPT-MLP performed better in Accuracy, and RF performed better in ROC Area.

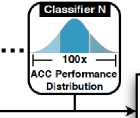
ACC Performance ^ Distribution j
Applying the
Fig.4. Scott-Knott ESD (v2.0) Test
ESD test
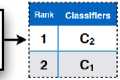
To analyze the effectiveness of proposed framework, we have performed Scott-Knott ESD test (v2.0) [33] (Fig 4). The package of this test is downloaded from [6]. In this test, Accuracy score of all the classification techniques including three dimensions of proposed model and 10 base classifiers from published research [1] is used as input. The test provided the output in the form of sub groups/clusters of classification techniques along with their ranks.
Knott ESD Test
Best Subgroup
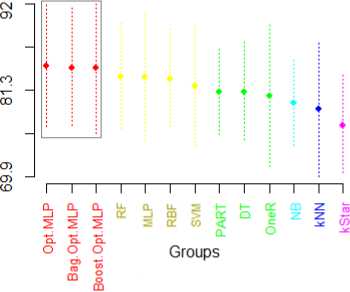
Fig.5. Scott-Knott ESD Test based on Accuracy results
The graphical representation of the Scott-Knott esd test result is given in Fig 5. It can be seen that the whole group of classification techniques is divided into subgroups along with their specific color. The subgroups are created on according on the basis of Y axis. The subgroups are also shown along with their ranks in Table 7. It can be observed that all three dimensions of the proposed framework performed better than other classification techniques.
Table 7. Scott-Knott ESD Ranks
|
Rank |
Techniques Subgroups |
|
1. |
Optimized-MLP, Bagging-Optimized-MLP, Boosting-Optimized-MLP |
|
2. |
Random Forest, MLP, Radial Basis Function, Support Vector Machine |
|
3. |
PART, Decision Tree, One R |
|
4. |
Naive Bayes |
|
5. |
K-Nearest Neighbor |
|
6. |
K-Star |
V. Conclusion
Instead of all the developed software modules, software engineers are now focusing to test only those modules which are likely to be defective so that overall testing cost can be reduced. This goal can be achieved by predicting the defect prone software modules before the testing activity. This research has contributed by proposing a classification framework for predicting the defect prone software modules. The framework uses optimized MLP and ensemble techniques including bagging and boosting. NASA’s cleaned MDP datasets are used for the implementation of proposed framework and to analyze the performance, F-measure, Accuracy, Roc Area and MCC are used. Performance is compared with 10 widely used base classifiers from a published research, moreover Scott-Knott ESD test is performed to effectively compare the accuracy of classification models. According to results the proposed framework including all three dimensions outperformed all other classification techniques. For future work, it is suggested feature selection and class balancing techniques should be introduced in the framework and experiments should be performed by using more datasets other than NASA’s repository.
References Prediction of Defect Prone Software Modules using MLP based Ensemble Techniques
- A. Iqbal, S. Aftab, U. Ali, Z. Nawaz, L. Sana, M. Ahmad, and A. Husen “Performance Analysis of Machine Learning Techniques on Software Defect Prediction using NASA Datasets,” Int. J. Adv. Comput. Sci. Appl., vol. 10, no. 5, 2019.
- A. Iqbal, S. Aftab, I. Ullah, M. S. Bashir, and M. A. Saeed, “A Feature Selection based Ensemble Classification Framework for Software Defect Prediction,” Int. J. Mod. Educ. Comput. Sci., vol. 11, no. 9, pp. 54-64, 2019.
- A. Iqbal, S. Aftab, and F. Matloob, “Performance Analysis of Resampling Techniques on Class Imbalance Issue in Software Defect Prediction,” Int. J. Inf. Technol. Comput. Sci., vol. 11, no. 11, pp. 1-10, 2019.
- F. Matloob, S. Aftab, and A. Iqbal, “A Framework for Software Defect Prediction using Feature Selection and Ensemble Learning Techniques,” Int. J. Mod. Educ. Comput. Sci., vol. 11, no. 12, pp. 14–20, 2019
- C. Manjula and L. Florence, “Deep neural network based hybrid approach for software defect prediction using software metrics,” Cluster Comput., pp. 1–17, 2018.
- “ScottKnottESD (v2.0.3).” [Online]. Available: https://github.com/klainfo/ScottKnottESD. [Accessed: 08-Nov-2019].
- A. Dadwal, H. Washizaki, Y. Fukazawa, T. Iida, M. Mizoguchi, and K. Yoshimura, “Prioritization in automotive software testing: Systematic literature review,” CEUR Workshop Proc., vol. 2273, no. QuASoQ, pp. 52–58, 2018.
- R. M. De Castro Andrade, I. De Sousa Santos, V. Lelli, Ḱathia Marçal De Oliveira, and A. R. Rocha, “Software testing process in a test factory from ad hoc activities to an organizational standard,” ICEIS 2017 - Proc. 19th Int. Conf. Enterp. Inf. Syst., vol. 2, no. Iceis, pp. 132–143, 2017.
- D. Kumar and K. K. Mishra, “The Impacts of Test Automation on Software’s Cost, Quality and Time to Market,” Procedia Comput. Sci., vol. 79, pp. 8–15, 2016.
- A. Bertolino, “Software testing research: Achievements, challenges, dreams,” FoSE 2007 Futur. Softw. Eng., no. September, pp. 85–103, 2007.
- S. Huda et al., “A Framework for Software Defect Prediction and Metric Selection,” IEEE Access, vol. 6, no. c, pp. 2844–2858, 2017.
- E. Erturk and E. Akcapinar, “A comparison of some soft computing methods for software fault prediction,” Expert Syst. Appl., vol. 42, no. 4, pp. 1872–1879, 2015.
- Y. Ma, G. Luo, X. Zeng, and A. Chen, “Transfer learning for cross-company software defect prediction,” Inf. Softw. Technol., vol. 54, no. 3, Mar. 2012.
- M. Ahmad, S. Aftab, I. Ali, and N. Hameed, “Hybrid Tools and Techniques for Sentiment Analysis: A Review,” Int. J. Multidiscip. Sci. Eng., vol. 8, no. 3, 2017.
- M. Ahmad, S. Aftab, S. S. Muhammad, and S. Ahmad, “Machine Learning Techniques for Sentiment Analysis: A Review,” Int. J. Multidiscip. Sci. Eng., vol. 8, no. 3, p. 27, 2017.
- M. Ahmad and S. Aftab, “Analyzing the Performance of SVM for Polarity Detection with Different Datasets,” Int. J. Mod. Educ. Comput. Sci., vol. 9, no. 10, pp. 29–36, 2017.
- M. Ahmad, S. Aftab, and I. Ali, “Sentiment Analysis of Tweets using SVM,” Int. J. Comput. Appl., vol. 177, no. 5, pp. 25–29, 2017.
- M. Ahmad, S. Aftab, M. S. Bashir, and N. Hameed, “Sentiment Analysis using SVM: A Systematic Literature Review,” Int. J. Adv. Comput. Sci. Appl., vol. 9, no. 2, 2018.
- M. Ahmad, S. Aftab, M. S. Bashir, N. Hameed, I. Ali, and Z. Nawaz, “SVM Optimization for Sentiment Analysis,” Int. J. Adv. Comput. Sci. Appl., vol. 9, no. 4, 2018.
- S. Aftab, M. Ahmad, N. Hameed, M. S. Bashir, I. Ali, and Z. Nawaz, “Rainfall Prediction in Lahore City using Data Mining Techniques,” Int. J. Adv. Comput. Sci. Appl., vol. 9, no. 4, 2018.
- S. Aftab, M. Ahmad, N. Hameed, M. S. Bashir, I. Ali, and Z. Nawaz, “Rainfall Prediction using Data Mining Techniques: A Systematic Literature Review,” Int. J. Adv. Comput. Sci. Appl., vol. 9, no. 5, 2018.
- A. Iqbal and S. Aftab, “A Feed-Forward and Pattern Recognition ANN Model for Network Intrusion Detection,” Int. J. Comput. Netw. Inf. Secur., vol. 11, no. 4, pp. 19–25, 2019.
- A. Iqbal, S. Aftab, I. Ullah, M. A. Saeed, and A. Husen, “A Classification Framework to Detect DoS Attacks,” Int. J. Comput. Netw. Inf. Secur., vol. 11, no. 9, pp. 40-47, 2019.
- I. H. Witten, E. Frank, M. A. Hall, and C. J. Pal, Data Mining: Practical machine learning tools and techniques. Morgan Kaufmann, 2016.
- I. Gondra, “Applying machine learning to software fault-proneness prediction,” J. Syst. Softw., vol. 81, no. 2, pp. 186–195, 2008.
- K. O. Elish and M. O. Elish, “Predicting defect-prone software modules using support vector machines,” J. Syst. Softw., vol. 81, no. 5, pp. 649–660, 2008.
- F. Lanubile, A. Lonigro, and G. Visaggio, “Comparing Models for Identifying Fault-Prone Software Components,” Proc. Seventh Int’l Conf. Software Eng. and Knowledge Eng., pp. 312–319, June 1995.
- M. Shepperd, Q. Song, Z. Sun and C. Mair, “Data Quality: Some Comments on the NASA Software Defect Datasets,” IEEE Trans. Softw. Eng., vol. 39, pp. 1208–1215, 2013.
- “NASA Defect Dataset.” [Online]. Available: https://github.com/klainfo/NASADefectDataset. [Accessed: 01-April-2019].
- B. Ghotra, S. McIntosh, and A. E. Hassan, “Revisiting the impact of classification techniques on the performance of defect prediction models,” Proc. - Int. Conf. Softw. Eng., vol. 1, pp. 789–800, 2015.
- G. Czibula, Z. Marian, and I. G. Czibula, “Software defect prediction using relational association rule mining,” Inf. Sci. (Ny)., vol. 264, pp. 260–278, 2014.
- D. Rodriguez, I. Herraiz, R. Harrison, J. Dolado, and J. C. Riquelme, “Preliminary comparison of techniques for dealing with imbalance in software defect prediction,” in Proceedings of the 18th International Conference on Evaluation and Assessment in Software Engineering. ACM, p. 43, 2014.
- C. Tantithamthavorn, S. McIntosh, A. E. Hassan, and K. Matsumoto, “The Impact of Automated Parameter Optimization on Defect Prediction Models,” IEEE Trans. Softw. Eng., vol. 5589, no. 1, 2018.
