Предикторы истинно-положительного результата стресс-эхокардиографии для оптимизации диагностического алгоритма у пациентов низкого/ умеренного риска с острой болью в груди

Автор: Абраменко Е.Е., Рябова Т.Р., Ёлгин И.И., Рябов В.В.
Журнал: Сибирский журнал клинической и экспериментальной медицины @cardiotomsk
Рубрика: Клинические исследования
Статья в выпуске: 3 т.40, 2025 года.
Бесплатный доступ
Обоснование. Клиническое подозрение на нестабильную стенокардию у пациентов с острой болью в груди низкого риска и ранее неверифицированной коронарной болезнью сердца (КБС) имеет ограниченную точность при принятии решения о необходимости инвазивной коронарной ангиографии. Подход к выбору оптимального неинвазивного диагностического теста, основанный на вероятности наличия у пациента обструктивного атеросклероза дает явные клинические преимущества, но точки принятия решения о неинвазивной ангиографии или функциональном тестировании для пациентов с острой болью в груди низкого и умеренного риска с ранее неверифицированной КБС не определены. Цель. Мы провели небольшое поисковое исследование, чтобы найти точки принятия решения в пользу выбора стресс-эхокардиографии (стресс-ЭхоКГ) в качестве предпочтительного стартового теста у пациентов с острой болью в груди низкого и умеренного риска с ранее неверифицированной КБС. Методы. В исследование включено 129 пациентов, возрастом 56 ± 11 лет, мужчин – 83 (64%), 97 (75%) пациентов имели ≥ 3 факторов риска ишемической болезни сердца (ИБС). Им проводилась стресс-ЭхоКГ с физической нагрузкой. С помощью инвазивной или неинвазивной коронарной ангиографии выявлялись истинно-положительные результаты стресс-ЭхоКГ. Высокая вероятность истинно-положительной стресс-ЭхоКГ была определена как аргумент в пользу выбора данной методики в качестве предпочтительного стартового теста. С помощью кластерного анализа все пациенты были разделены на группы на основании различий в сывороточных уровнях триглицеридов (ТГ), общего холестерина (ОХ), холестерина липопротеинов высокой плотности (ХС ЛПВП) и индекса атерогенности (ИА). Оценивались пороговые значения ТГ, ХС не-ЛПВП и ИА для определения принадлежности пациентов к группе, в которой вероятность истинно-положительной стресс-ЭхоКГ была высокой. Результаты. Частота истинно-положительной стресс-ЭхоКГ составила 8%. У пациентов с истинно-положительной стресс-ЭхоКГ были выше уровни ХС не-ЛПВП (p = 0,001) и ИА (p = 0,066) по сравнению с остальными пациентами. По результатам кластеризации среди всех пациентов были выделены 2 группы, объединившие 36% пациентов с наиболее высокими уровнями ХС не-ЛПНП и ИА. Отношение шансов для истинно-положительной стресс-ЭхоКГ в объединенной группе составило 7,2 (1,4–36,6). Уровень ХС не-ЛПНП > 4,42 ммоль/л определял принадлежность к объединенной группе с чувствительностью 0,91, специфичностью 0,88 и площадью под ROC-кривой 0,97. Выводы. У пациентов с острой болью в груди низкого и умеренного риска с ранее неверифицированной КБС уровень ХС не-ЛПВП > 4,42 ммоль/л может рассматриваться в качестве критерия для выполнения стресс-ЭхоКГ в качестве стартового теста.
Боль в груди, острый коронарный синдром, стресс-эхокардиография, холестерин, коронарная болезнь сердца
Короткий адрес: https://sciup.org/149149299
IDR: 149149299 | УДК: 616.712-002-047.44-073.7 | DOI: 10.29001/2073-8552-2025-40-3-105-113
Predictors of a true-positive stress echocardiography result for optimization of diagnostic algorithm in lowto intermediate-risk patients with acute chest pain
Background. Clinical suspicion of unstable angina in patients with previously unverified coronary artery disease (CAD) has limited efficacy in decisions whether invasive coronary angiography is necessary. A likelihood-based approach to selecting the optimal diagnostic test in evaluating chest pain offers distinct clinical benefits, but decision points for noninvasive angiography or functional testing for lowand intermediate-risk acute chest pain patients with previously unverified CAD remain undefined. Aim: To find decision-making point to select stress-echocardiography (SE) as the initial test in lowto intermediate-risk acute chest pain patients with previously unverified CAD. Methods. The study included 129 patients, aged 56 ± 11 years, of whom 83 (64%) were male and 97 (75%) had ≥ 3 risk factors for CAD. They underwent exercise SE. The diagnostic performance of SE was analyzed to identify true positive (TP) SE results; reference methods were invasive or noninvasive coronary angiography. TP SE was the target outcome in favor of SE as the initial test. All patients were clustered into phenogroups based on differences in serum triglycerides (TG), total cholesterol (TC), high-density lipoprotein cholesterol (HDL-C), and atherogenic index (AI). TC, non-HDL-C, and AI were used to determine thresholds for belonging to a phenogroup in which the odds of TP SE were higher. Results. The rate of TP SE was 8%. Patients with TP SE had higher levels of non-HDL-C (p = 0.001) and AI (p = 0.066) compared to the remaining patients. After clustering, 2 phenogroups were identified in the total study population, uniting the 36% of patients with the highest non-HDL-C and AI. The odds ratio for TP SE in this joint group was 7.2 (1.4–36.6). Non-LDL >4.42 mmol/l estimate joint group membership with sensitivity 0.91, specificity 0.88, and area under curve 0.97. Conclusion. Non-HDL-C >4.42 mmol/l may be considered in low to intermediate risk acute chest pain patients with previously unverified CAD as a criterion for using SE as a starting test.
Текст научной статьи Предикторы истинно-положительного результата стресс-эхокардиографии для оптимизации диагностического алгоритма у пациентов низкого/ умеренного риска с острой болью в груди
The management of patients with acute chest pain, nondiagnostic ECG, and normal troponin is a complex and frequent problem worldwide [1]. Non-traumatic chest pain is a primary symptom in acute coronary syndrome (ACS), and is the second most common reason for emergency department visits in adults [2]. Of the approximately 500 000 patients with non-ST-segment elevation ACS hospitalized in Russia annually, half are not in the high-risk category [3]. These are patients in the observation group in whom there remains a high clinical suspicion for ACS despite a negative initial evaluation. Coronary pathology in non-ST-segment elevation ACS can range from structurally normal vessels to severe atherosclerotic disease. [4]. The workup to confirm ACS and to determine the need for invasive coronary angiography (ICA) in these patients may include stress imaging tests or noninvasive cardiac computed tomographic angiography (CCTA) [5, 6].
Now in the guidelines for the management of acute coronary syndromes (ACS), stress echocardiography (SE) among other stress imaging modalities and CCTA despite the difference in diagnostic capabilities are at the same position [5, 6]. The American Societies of Cardiology (AHA/ ACC/ASE/CHEST/SAEM/SCCT/SCMR) guidelines (Gulati M. et al., 2021) for the evaluation and diagnosis of chest pain recommend a coronary artery disease (CAD) likelihoodbased approach to the choosing the right diagnostic test for patients presenting with acute chest pain. Age less/ more than 65 years and less/more obstructive CAD suspected are decision-making points for selecting between CCTA/functional imaging [7]. Clinical and demographic characteristics analysis in support of anatomic or functional testing in stable patients with suspected CAD showed CAD risk factors (high body mass index (BMI), total cholesterol (TC) level, presence of hypertension, diabetes mellitus, male gender, and smoking) to be criteria favoring CCTA [8]. Age demonstrated no pattern of influence on the preferred test, which is inconsistent with the approach of Gulati M et al. For low- and intermediate-risk acute chest pain patients with previously unverified CAD similar studies are lacking. The aim of our study was to find decision-making points to select SE as the initial test in patients with acute chest pain, negative troponin, nondiagnostic ECG, low to intermediate risk score, and with previously unverified CAD.
Methods
We performed a small-scale preliminary study, singlecenter cohort cross-sectional observational study in accordance with the Helsinki Declaration principles (adopted by the 64th WMA General Assembly in October 2013) and the Good Clinical Practice standards. The local ethical committee, Biomedical Ethics Committee of Cardiology Research Institute, Tomsk NRMC, approved the study protocol (protocol № 222 from 21.12.2021). All patients signed written informed consent prior to enrollment.
Study patients
We prospectively enrolled consecutive patients aged ≥18 years, hospitalized from 2022 to 2023 at the Emergency Cardiology Department of the Cardiology Research Institute, Tomsk NRMC with acute chest pain of probable coronary origin, normal or non-diagnostic ECG, normal high-sensitivity troponin I (hs-Tn) levels, low or intermediate GRACE risk, and previously unverified CAD (previous myocardial infarction, revascularization, or stenoses ≥50% on previous coronary angiography). Troponin test was at least twice negative in 3-hour interval. Non-inclusion criteria: poor acoustic window, resting RWMA, reduced (<50%) left ventricular ejection fraction (LVEF), persistent atrial fibrillation, complete atrioventricular block, recent ventricular tachycardia, severe valvular disease, evident inability to exercise, height <150 cm or weight ≥120 kg, contraindications for invasive coronary angiography (ICA) or CCTA.
Evaluation of the serum lipid profile of patients was the Ex post facto analysis performed in this study. Therefore, exclusion criteria were measuring serum lipid levels later than the second day of hospitalization and lack of data on HDL-C.
Stress echocardiography
Exercise SE was performed with a semi-supine cycle ergometer CASE (GE HealthCare, Milwaukee, WI, USA) and Affiniti 70 Ultrasound system (Phillips, Bothell, WA, USA) according to established guidelines [9]. A stepped WHO workload dosing mode was used with steps of 25 W duration of 2 minutes starting at 25 W. Beta-blockers or other heart rate lowering therapy was stopped in 48 hours before the test or was not initiated. Ultrasound contrast was not used. Echocardiographic images in the parasternal long- and short-axis and apical four- and two-chamber views with visual semi-quantitative contractility assessment and blood pressure measurements were obtained at each step and during recovery. ECG monitoring was continuous. Tests termination criteria were: induced regional wall motion abnormalities (RWMA) in ≥2 adjacent segments in a 16-segment left ventricular myocardial model, ST-segment depression ≥2 mm in absence of RWMA, serious arrhythmias (ventricular tachycardia, sustained ventricular allorhythmia or hemodynamically unstable supraventricular tachycardia), excessive blood pressure increase (systolic ≥230 mmHg and/or diastolic ≥120 mmHg) or decrease under load; limiting symptoms (chest pain, dyspnea), muscular fatigue and refusal to continue exercising.
SE result was defined as positive if RWMA were induced, negative in the absence of RWMA and reaching 85% of the maximum heart rate, calculated as 220-age (years), inconclusive in the absence of RWMA in patients who have not reached the submaximal heart rate.
Coronary angiography
Coronary anatomy was assessed by ICA or CCTA during the index hospitalization. To comply with ethical standards and clinical guidelines, the decision to perform ICA was made by the attending cardiologist based on clinical findings, and after obtaining the results of non-invasive imaging tests. CCTA was performed in patients who had no indications for invasive testing. ICA was performed on Coroscop angiograph (Siemens, Germany), CCTA – on 64-slice Discovery NM/CT 570c tomograph (GE HealthCare, USA). Angiography studies were carried according to standard protocols, evaluation of fractional blood flow reserve was not performed. Obstructive CAD was defined as ≥50% luminal diameter stenosis of ≥1 epicardial coronary artery. Gensini score was calculated to assess the severity of CAD [10].
Laboratory measurements
Venous blood samples were taken in the early morning after fasting for ≥10 hours. Serum level of total cholesterol (TC), triglycerides (TG), high-density lipoprotein cholesterol (HDL-C) and fasting blood glucose (FBG) were measured with a semi-automatic biochemical analyzer Clima MC-15 (RAL Tecnica para el Laboratorio, S.A., Spain). Non- high-density lipoprotein cholesterol (non-HDL-C), atherogenic index (AI), atherogenic index of plasma (AIP), triglycerideglucose index (TyG) were calculated by the formulas:
Non — HDL — C (mmol/l) = TC (mmol/1) — HDL — C (mmol/Г)
TC (mmol/1) - HDL - C (mmol/l)
HDL — C (mmol/l)
лтп 1 ^(mmol/l) AIP = lgHDL-C(mmoi/0
TG (mg/dl)
У П FBG (mg/dl)
Statistical analysis
Data were analyzed with STATISTICA 10 program (StatSoft, USA). The Shapiro-Wilk test was used to test the normality hypothesis. Two independent groups of normally distributed quantitative variables were compared using Student's t-test with Levene's test for homogeneity of variances, if the distribution was not normal or the variances were heterogeneous - using Mann-Whitney U-test. Comparison of 3 or more independent groups of quantitative variables – using analysis of variance or the Kraskall-Wallis test. Comparison of two independent groups of qualitative variables – using Fisher's exact test, three or more independent groups of qualitative variables – using Pearson's χ 2 test. Correction for multiple hypothesis testing was performed using the Holm-Bonferroni method. Correlation analysis of quantitative variables was performed using the Spearman method. The strength of association of categorical variables was determined by the odds ratio (OR). Clustering was performed using the K mean method, and the optimal number of clusters was determined using the elbow method. Logistic regression method was used to construct predictive models. Data are presented as mean and standard deviation, M±SD, for normally distributed quantitative variables, median and interquartile range, Me (25th percentile; 75th percentile), if the distribution of quantitative variables differed from normal, absolute number and proportion, N (%), for qualitative variables, OR (95% confidence interval) for OR. The significance threshold for statistical inference is 0.05.
Results
A total of 132 patients were included in the study (Figure 1). In 3 of them, HDL-C data were missing, so they were excluded from further analysis. The final cohort included 129 patients aged 56±11 years, 83 (64%) men. The baseline characteristics of the patients are shown in Table 1.
No patient had major complications (specially, ST-segment elevation, life-threatening arrhythmias, myocardial infarction, and hypotension requiring therapy) during SE. The test was positive in 12 (9%) patients, negative – in 58 (45%) patients, inconclusive – in 59 (46%) patients. The reasons for prematurely terminating the test leading to inconclusive result in 30 patients were inability to continue the load due to muscular fatigue, in 15 – exceeding the upper limit of systolic blood pressure, in 7 – limiting dyspnea, in 3 – ST depression ≥ 2 mm, in 2 – induced arrhythmia, and in the remaining 2 patients – load-induced joint pain and headache.
Invasive or non-invasive coronary angiography was performed in 114 (88%) patients and not performed in 15
(12%) patients. Two of them were allergic to iodine, 2 were unable to perform CCTA due to cardiac arrhythmias, 2 were discharged early due to acute respiratory infections, 2 had massive coronary artery calcinosis but refused ICA, and for 7 patients the decision to not perform angiography was made by the attending cardiologist. CAD with narrowing ≥70% in 14 of 16 cases were verified by ICA, in 2 cases ICA was not done (CCTA revealed diagonal artery occlusion (1) and 70% proximal left anterior descending stenosis (2), and in both cases SE was negative), narrowing 50-69% in 5 of 16 cases were confirmed by ICA. Performance analysis of SE is shown in Table 2.
Nine patients (8%) had a true positive (TP) SE result. Eight of them had proximal coronary stenoses with narrowing ≥85% (including subtotal and total, n = 3 and 3, respectively), only one had a 50% stenosis (all lesions were verified by ICA). GS in patients with TP SE, 40 (31; 48), was higher than in patients with non-diagnostic result in the presence of obstructive CAD, 21 (10; 24) ( p = 0.041) or absence of obstructive CAD, 3 (0; 6) ( p < 0.001).
The following task of searching for decision-making points in preference for SE as a starting non-invasive test in NSTE-ACS rule-in (out) algorithm for low and intermediate risk chest pain patients with previously unverified CAD was related to the finding of predictors for TP SE result. TP SE patients group were compared with the remaining patients (who had FP, FN, TN SE result and inconclusive SE regardless of the presence or absence of obstructive CAD) defined as the “Other” group, patients who did not undergo coronary angiography were counted as the “Undetermined” group. Baseline and biochemical characteristics of the groups are compared in Table 3.
TP SE patients had higher level of non-HDL-C ( p = 0.001) and AI ( p = 0.066) compared to Other group patients. Undetermined group had no differences of this parameters compared to Other group. Based on differences non-HDL-C and AI could be considered as predictors of TP SE result. Nevertheless, the low frequency of positive results led to a pronounced imbalance in the TP SE and Other group sizes (9 vs. 105). In addition, the ranges of non-HDL-C and AI values between groups overlapped significantly or completely.
Next, total of 129 patients was divided into phenogroups based on lipid parameters (listed in Table 3) by K-means clustering. Pairwise correlation analysis was used to eliminate redundant features, and one of the two high correlated variables ( r ≥ 0.7) were filtered out, keeping the most informative. Finally, TG, TC, HDL-C, and IA were selected as phenotypic variables. The values of these variables were of the same order of magnitude, so standardization was not performed. The result of grouping patients into 4 clusters is shown in Table 4 and Figure 2.
All phenogroups were significantly different from each other in AI (all p < 0.001). Phenogroups 1 and 2 were similar in TC ( p = 0.211) and non-HDL-C levels ( p = 0.831). Phenogroups 3 and 4 had different levels of TC ( p < 0.001) and non-HDL-C ( p < 0.001), but did not differ in TG (0.678), HDL-C ( p = 0.107), AIP ( p = 0.602) and TyG (0.252).
Patients in phenogroups 1 and 2 were more likely to have ≥70% coronary artery stenoses and a higher GS ( p = 0.049 for phenogroups 2 and 3, p > 0.050 for the other pairs). TP SE result was more frequent in the joint phenogroup 1+2, in 7 (17%) vs. 2 (3%) cases in joint phenogroup 3+4 ( p = 0.011), the results of assessing the significance of differences using
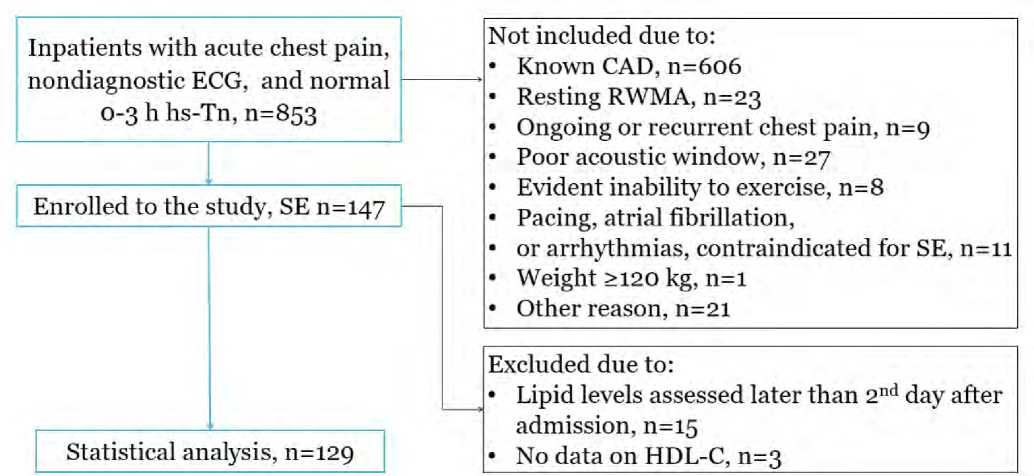
Fig. 1. Study enrollment flowchart
Note: CAD – coronary artery disease; ECG – electrocardiogram; HDL-C – high-density lipoprotein cholesterol; hs-Tn – high-sensitivity troponin; RWMA – regional wall motion abnormalities; SE – stress echocardiography.
Рис. 1. Схема отбора пациентов
Примечание: CAD – коронарная болезнь сердца; ECG – электрокардиограмма; HDL-C – холестерин липопротеинов высокой плотности; hs-Tn – высокочувствительный тропонин; RWMA – нарушение локальной сократимости; SE – стресс-эхокардиография.
Table 1 . Baseline characteristics of the study population
Таблица 1 . Основные характеристики пациентов
|
Variable |
All patients, n = 129 |
|
Age, years |
56±11 |
|
Male, n (%) |
83 (64%) |
|
Risk factors, n (%) |
|
|
Overweight / obesity, n (%) |
58 (45%) / 43 (33%) |
|
Current and former smokers, n (%) |
71 (55%) |
|
Dyslipidaemia, n (%) |
108 (84%) |
|
Statin use, n (%) |
10 (8%) |
|
Diabetes mellitus, n (%) |
12 (9%) |
|
Hypertension, n (%) |
115 (89%) |
|
≥3 risk factors, n (%) |
97 (75%) |
|
Carotid atherosclerosis*, n (%) |
31 (24%) |
|
GRACE score, n (%) |
|
|
≤ 108 |
99 (77%) |
|
109–140 |
30 (23%) |
|
Resting echocardiography |
|
|
End-diastolic volume index, ml/m2 |
50±7 |
|
End-systolic volume index, ml/m2 |
17 (15; 20) |
|
Left ventricular mass index, g/m2 |
85 (73; 98) |
|
Left ventricular ejection fraction, % |
64 (62; 67) |
|
Stress echocardiography |
|
|
Positive, n (%) |
12 (9%) |
|
Negative, n (%) |
58 (45%) |
|
Inconclusive, n (%) |
59 (46%) |
|
Coronary angiography, n (%) |
114 (88%) |
|
ICA / CCTA |
33 (26%) / 81 (62%) |
|
Obstructive CAD, n (%) |
32 (28%) |
|
Gensini score |
5.0 (0; 12.0) |
|
Revascularization, n (%) |
11 (9%) |
Note: * narrowing ≥25%; CAD – coronary artery disease; CCTA – coronary computed tomography angiography; GRACE – Global Registry of Acute Coronary Events; ICA – invasive coronary angiography.
the chi-square criterion was χ 2 = 7.48, df = 1, OR was 7.2 (1.4–36.6), р = 0.006.
Table 2 . Performance analysis of the SE in identifying obstructive coronary artery disease
Таблица 2 . Оценка диагностической точности стресс-ЭхоКГ для выявления обструктивной коронарной болезни сердца
|
Stress echocardiography |
Coronary angiography |
Total |
|
|
≥50% |
0-49% |
||
|
Positive, n (%) |
9 (8%) |
2 (2%) |
11 (10%) |
|
Negative, n (%) |
10 (9%) |
39 (34%) |
49 (43%) |
|
Inconclusive, n (%) |
13 (11%) |
41 (37%) |
54 (47%) |
|
Total, n (%) |
32 (28%) |
82 (72%) |
114 (100%) |
TC, non-LDL and AI levels were used to estimate phenogroup 1+2 membership with univariate logistic regression. Thresholds were determined using Youden's J statistic. Table 5 demonstrates quality metrics of the models. The best quality metrics were determined for the non-HDL-C >4.42 mmol/l, with sensitivity 0.91, specificity 0.88, and area under curve 0.97 (Figure 3).
Discussion
The study cohort was low to intermediate-risk acute chest pain patients with previously unverified CAD hospitalized for observation at the cardiology inpatient unit with the option of percutaneous coronary intervention (PCI center). This cohort is characterized by the high clinical suspicion of CAD despite normal troponin levels, absence of ischemic ECG changes, resting RWMA and non-high risk of mortality if choosing noninvasive treatment strategy according to the GRACE scale. Practically, this is reflected in the high frequency of ICA. As reported by Kuznetsova KV et al. 111 (39%) low and intermediate risk patients, hospitalized in PCI center due to the first episode of acute chest pain were referred for ICA without preliminary noninvasive testing [11]. However, the incidence of obstructive CAD and the associated demand for PCI in these patients is quite low – in different studies 14% and 8%, respectively, during hospitalization [11], and 10 and 5%, respectively, during 2-year follow-up period [12]. In
Table 3 . Comparative characteristics of patients with true positive stress echocardiography
Таблица 3 . Сравнительная характеристика пациентов с истинно-положительным результатом стресс-ЭхоКГ
|
Variable |
TP SE, n = 9 |
Other, n = 105 |
Undetermined, n = 15 |
р |
|
1 |
2 |
3 |
||
|
Baseline characteristics |
||||
|
Age, years |
56±11 |
56±11 |
54±14 |
0.844 |
|
Male, n (%) |
7 (78%) |
67 (64%) |
9 (60%) |
0.656 |
|
BMI, kg/m2 |
27.5±3.8 |
28.4±4.3 |
27.3±3.5 |
0.542 |
|
Current and former* smokers, n (%) |
4 (44%) |
62 (59%) |
5 (33%) |
0.139 |
|
Diabetes mellitus, n (%) |
2 (22%) |
10 (10%) |
0 |
0.190 |
|
Hypertension, n (%) |
7 (78%) |
95 (90%) |
13 (87%) |
0.475 |
|
Carotid atherosclerosis†, n (%) |
4 (44%) |
26 (25%) |
1 (7%) |
0.039 |
|
GRACE score |
86±19 |
87 (69; 108) |
82±20 |
0.694 |
|
Dyslipidaemia, n (%) |
8 (89%) |
89 (86%) |
11 (69%) |
0.485 |
|
Statin use, n (%) |
0 |
9 (9%) |
1 (6%) |
0.623 |
|
Biochemical characteristics |
||||
|
TC, mmol/l |
6.8±1.8 |
5.4±1.2 |
5.5±1.3 |
0.076 |
|
TG, mmol/l |
1.3 (1.1; 2.6) |
1.5 (1.0; 2.3) |
1.5±0.7 |
0.667 |
|
HDL-C, mmol/l |
1.1 (1.0; 1.5) |
1.3 (1.1; 1.5) |
1.4±0.3 |
0.373 |
|
Non-HDL-C, mmol/l |
5.5±1.62 |
4.0±1.11 |
4.1±1.5 |
0.001 |
|
AI |
4.6±1.8 |
3.0 (2.3; 4.0) |
3.1±1.6 |
0.038 |
|
AIP |
0.11±0.42 |
0.07 (-0.18; 0.28) |
-0.04±0.29 |
0.434 |
|
TyG |
0.28±0.57 |
0.24 (-0.19; 0.62) |
0.11±0.55 |
0.741 |
Note: * – stopped smoking less than 5 years ago; † – narrowing ≥25%; AI – atherogenic index; AIP – atherogenic index of plasma; BMI – body mass index; GRACE – Global Registry of Acute Coronary Events; HDL-C – high-density lipoprotein cholesterol; TC – total cholesterol; TG – triglycerides; TyG – triglyceride-glucose index; TP – true positive; SE – stress echocardiography; a the superscript indicates the number of the group against which the difference ( p < 0.05), was observed.
our study the incidence obstructive CAD was 28%, and the frequency of revascularization – 9%.
A comparative randomized controlled trial of CCTA and SE efficacy in this clinical setting showed no differences in the incidence of major adverse cardiovascular events, ICA and PCI at 2-year follow-up, but more often initiated or intensified lipid-lowering therapy in patients in the CCTA group [12, 13]. This could be explained by the likelihood of the patient having obstructive CAD even with a negative stress test result, which, in addition, determines residual ischemic risk in patients after myocardial infarction or unstable angina [14]. The prognostic value of a negative SE result for detecting coronary stenoses ≥50% in our study was 80%; in similar studies including patients with esteblished CAD, it ranged from 52 to 94% [1, 15]. This fact and the low frequency of obstructive CAD in this category of patients in general determine CCTA as a more suitable initial diagnostic modality for this category of patients.
However, for a number of patients, assessment of the functional significance of coronary stenoses and selection of the artery associated with ischemia remain critical. Initiating the diagnostic workup with a SE in patients with a high probability of CAD and subsequent referral for ICA if the test is positive will prevent the excessive radiation exposure associated with prior CCTA and reduce the time spent for initial evaluation. The American Societies of Cardiology guidelines for the evaluation and diagnosis of chest pain identify age >65 years and a high clinical suspicion for CAD as decision-making points for functional imaging [7]. But patients with previously unverified CAD are often younger: in our study, only 25% of patients reached the age of 65 years; the age of patients in the Levsky JM et al. and Heitner JF et al. studies was 55 ± 10 years, and Kuznetsova K.V. et al. 62±9 years [11, 12, 15]. Clinical suspicion of CAD for all patients in our study “equaled” the emergency physician's decision to admit them to the PCI center after initial evaluation and the absence of a history of proven CAD.
We used true positive SE result, associated with higher severity of CAD, as the target outcome to find decisionmaking points in favor of SE as a starting test in these patients. Patients with TP SE had higher levels of non-HDL-C and AI compared with the others. Previously, Geltser BI et al. showed an increase in low-density lipoprotein cholesterol >3.5 mmol/l with an OR 2.1 (1.4–3.1) and AI ≥3.4 with an OR 2.0 (1.3–3.1) as predictors of obstructive CAD without adjusting for the location of stenosis in the coronary bed [16]. In smaller study by Heitner JF et al., only a tendency (p = 0.08) to a decrease in HDL-C, which is used to calculate non-HDL-C and AI, was observed in patients with CAD [15].
We identified and analyzed four profiles of serum lipid changes in patients with low- and intermediate-risk acute chest pain. Two profiles (phenogroup 1 and 2 in our study) were characterized by elevated non-high-density lipoprotein cholesterol and were associated with increased odds of TP SE. They were observed in 46 (36%) patients. These patients also had higher AIP and TyG, both associated with a higher incidence of multivessel CAD and higher SYNTAX CAD complexity in ACS patients with previously unverified CAD [17]. The likelihood of TP SE outcome in the united group was higher than in patients with lower levels of TC, non-LDL, and AI. This suggests that SE as a starting test in low- and intermediate-risk acute chest pain patients with previously unverified CAD is more preferable in patients with higher levels of more atherogenic serum lipid fractions, namely non-HDL-C levels >4.42 mmol/L. The following larger studies are needed to prove this concept.
Limitations
The study has a number of limitations. The low rate of positive SE characteristic for patients with previously unverified CAD limits the statistical power, so validation of the results on a larger sample is required, which was not performed in this study. The GS was based on the results of ICA and CCTA, which were assumed to be equivalent. However, in accordance with the large-scale VERDICT trial, where ICA was a reference method to assess the presence and severity of a luminal obstruction, the CCTA specificity in identifying coronary stenoses ≥50% was 0.72 (0.67–0.77), as determined by the proportion of FP CCTA results [18]. This may be the reason for GS calculated from CCTA data to be overestimated. The study findings are relevant to the screening of patients for SE and may be of limited applicability to other functional imaging modalities that differ in diagnostic performance [19].
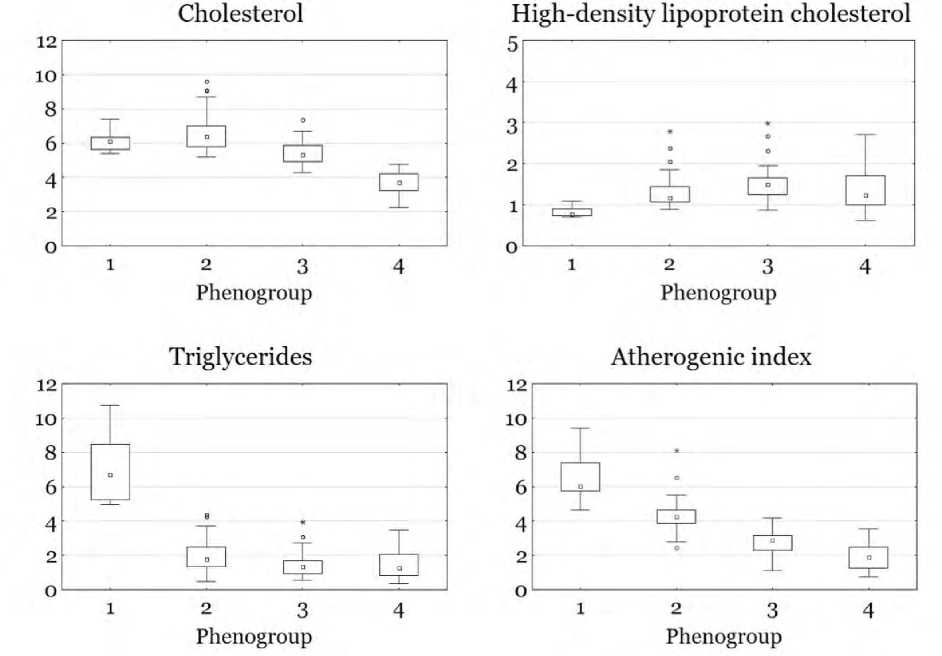
Fig. 2. Values of TC (mmol/l), HDL-C (mmol/l), TG (mmol/l), and AI in the phenogroups of patients allocated by clustering Рис. 2. Значения ТГ, ХС, ХС ЛВП и ИА в группах пациентов, выделенных в результате кластеризации
Table 4 . Characteristics of phenogroups resulting from clustering based on TG, TC, HDL-C, and AI levels
Таблица 4 . Характеристики групп пациентов, полученных в результате кластерного анализа на основании уровней ТГ, ХС, ХС ЛВП и ИА
|
Variable |
Phenogroup 1 ( n = 8) |
Phenogroup 2 ( n = 38) |
Phenogroup 3 ( n = 57) |
Phenogroup 4 ( n = 26) |
p |
|
Biochemical characteristics |
|||||
|
TC, mmol/l |
6.1±0.63,4 |
6.4 (5.8; 7.0)3,4 |
5.4±0.71,2,4 |
3.8±0.61,2,3 |
<0.001 |
|
TG, mmol/l |
7.1±2.12,3,4 |
2.0±1.01,3,4 |
1.3 (1,0; 1,7)1,2 |
1.3 (0.8; 2.1)1,2 |
<0.001 |
|
HDL-C, mmol/l |
0.8±0.12,3,4 |
1.2 (1.1; 1.4)1,3 |
1.5 (1.2; 1.7)1,2 |
1.4±0.51 |
<0.001 |
|
Non-HDL-C, mmol/l |
5.3±0.73,4 |
5.1 (4.7; 5.4)3,4 |
3.8 (3.6; 4.3)1,2,4 |
2.4±0.51,2,3 |
<0.001 |
|
AI |
6.6±1.52,3,4 |
4.2 (3.9; 4.6)1,3,4 |
2.8±0.71,2,4 |
2.0±0.71,2,3 |
<0.001 |
|
AIP |
0.92±0.152,3,4 |
0.18 (0.07; 0.35)1,3 |
-0.06±0.251,2 |
-0.02±0.331 |
<0.001 |
|
TyG |
1.68±0.382,3,4 |
0.36±0.561,4 |
0.13±0.461 |
0.00±0.511,2 |
<0.001 |
|
Statin use, n (%) |
1 (13%) |
1 (3%)4 |
04 |
8 (31%)2,3 |
<0.001 |
|
Baseline characteristics |
|||||
|
Age, years |
47±7 |
56±11 |
56 (47; 66)1 |
57±12 |
0.149 |
|
Male, n (%) |
7 (88%) |
28 (74%) |
34 (60%) |
14 (54%) |
0.164 |
|
BMI, kg/m2 |
30.1±2.6 |
27.9±3.5 |
27.7±4.6 |
29.2±4.5 |
0.252 |
|
Dyslipidaemia, n (%) |
8 (100%) |
38 (100%)4 |
49 (86%)4 |
13 (50%)2,3 |
<0.001 |
|
Current and former* smokers, n (%) |
6 (75%) |
21 (55%) |
29 (51%) |
15 (58%) |
0.623 |
|
Diabetes mellitus, n (%) |
1 (13%) |
3 (8%) |
3 (5%) |
5 (19%) |
0.228 |
|
Hypertension, n (%) |
7 (88%) |
32 (84%) |
50 (88%) |
23 (88%) |
0.338 |
|
Carotid atherosclerosis†, n (%) |
4 (50%) |
10 (26%) |
12 (21%) |
6 (23%) |
0,287 |
|
Stress echocardiography |
|||||
|
True positive |
1 (13%) |
6 (16%)3 |
2 (4%)2 |
0 |
0.049 |
|
Coronary atherosclerosis |
|||||
|
Coronary angiography, n (%) |
8 (100%) |
33 (87%) |
52 (91%) |
20 (77%) |
– |
|
Obstructive CAD, n (%) |
2 (25%) |
12 (36%) |
12 (23%) |
6 (30%) |
0.609 |
|
≥70% stenosis, n (%) |
2 (25%) |
8 (24%) |
4 (8%) |
2 (9%) |
0.029 |
|
GS |
7.8 (1.5; 20.0) |
9.0 (1.0; 18.0)3 |
2.8 (0; 6.0)2 |
2.8 (0; 11.3) |
0.041 |
Note: * – stopped smoking less than 5 years ago; † – narrowing ≥25%; AI – atherogenic index; AIP – atherogenic index of plasma; BMI – body mass index; CAD – coronary artery disease; GRACE – Global Registry of Acute Coronary Events; GS – Gensini score; HDL-C – high-density lipoprotein cholesterol; TC – total cholesterol; TG – triglycerides; TyG – triglyceride-glucose index; TP – true positive; SE – stress echocardiography; a superscript indicates the number of the group with significant differences, p < 0.05.
Table 5 . Evaluation of the predictive performance of univariate logistic regression models for classifying patients into the combined phenogroup 1+2
Таблица 5 . Показатели прогностического качества моделей однофакторной логистической регрессии для отнесения пациентов к объединенной феногруппе 1+2
|
№ |
Model |
Ac |
Se |
Sp |
AUC |
p |
|
1 |
Total cholesterol > 5.61 mmol/l |
0.78 |
0.82 |
0.78 |
0.89 |
<0.001 |
|
2 |
Atherogenic index > 3.43 |
0.88 |
0.88 |
0.87 |
0.95 |
<0.001 |
|
3 |
Non-HDL-C > 4.42 mmol/l |
0.89 |
0.91 |
0.88 |
0.97 |
<0.001 |
Note: Ac – accuracy; AUC – area under curve; HDL-C – high-density lipoprotein cholesterol; Se – sensitivity; Sp – specificity.
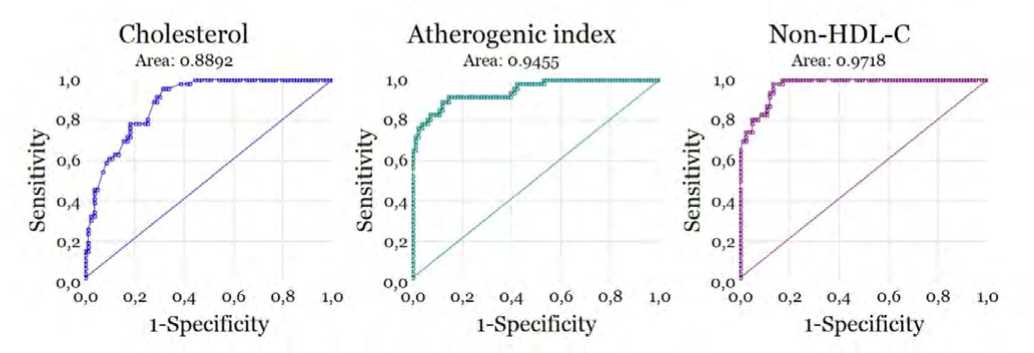
Fig. 3: ROC curves of the diagnostic accuracy of TC, AI, and non-HDL-C to determine phenogroup 1+2 membership Note: HDL-C – high-density lipoprotein cholesterol.
Рис. 3. ROC-кривые моделей, предсказывающих принадлежность к феногруппе 1+2 по ОХ, ХС не ЛПВП и ИА Примечание: HDL-C – холестерол липопротеинов высокой плотности.
Conclusion
The prevalence of true positive SE among low to intermediate-risk acute chest pain patients with previously unverified CAD is 8%. Patients with true positive SE have a higher severity of CAD as assessed by the Gensini score and higher serum non-HDL-C, and AI. Non-HDL-C > 4.42 mmol/l may be considered in this cohort as a criterion for using SE as a starting test.
