Problems of sustainable development of dairy cattle farming in Russian regions under sanctions

Author: Takhumova O.V., Bursa I.A.
Journal: Economic and Social Changes: Facts, Trends, Forecast @volnc-esc-en
Section: Branch-wise economy
Article in issue: 6 т.18, 2025.
Free access
The aim of this study is to assess the differentiated impact of sanctions on the socio-economic development of dairy cattle farming, taking into account its adaptation mechanism at the regional level. A systematization of factors was carried out, identifying seven levels with critical threshold values, an adaptation strategy matrix, and a methodological framework based on factor analysis, verified using Rosstat panel data for 2019–2024 and expert assessments. Due to the varying scales of input parameters and the temporal dynamics of the processes under study, an integral assessment system was employed, utilizing three complementary methodologies. The linear convolution method revealed stable long-term industry development trends based on averaged values of normalized indicators. The geometric convolution method, more sensitive to sharp changes in the industry's structure and development rates, highlighted the specific impact of transformations in the political-economic sphere after 2020. The use of Harrington's desirability function made it possible to interpret the assessment results in terms of the industry's functional sustainability. The modeling results showed that, despite the economic, technological, and logistical shocks of sanctions, there is steady growth in key indicators, and by 2024, signs of systemic stability and economic maturity are emerging. Based on the developed methodology for assessing the sustainability of dairy cattle farming, a rating result is presented, incorporating economic, production, market, and socio-ecological components with justified weights. This approach accounted for regional industry specifics, ensured comparability of results across territories, and reflected the significance of each factor for assessing development sustainability. The results can be used as a decision-making tool in agricultural production and for developing regional support programs. Differentiated recommendations for overcoming the consequences of sanctions have been developed for regions with varying levels of dairy farming sustainability: leaders (index >0.7); average level (0.5–0.7); low level (≤0.5). The research is of interest not only to specialists in the agro-industrial complex but also to a wide audience concerned with the processes of the Russian economy's adaptation to external challenges.
Dairy cattle farming, economic efficiency, sanctions, sustainability index, regional differentiation, modeling, forecast
Short address: https://sciup.org/147252997
IDR: 147252997 | UDC: 338.43:636.2(470+571) | DOI: 10.15838/esc.2025.6.102.7
Text of the scientific article Problems of sustainable development of dairy cattle farming in Russian regions under sanctions
One of the key branches of the agro-industrial complex is dairy cattle breeding, the effective functioning of which makes it possible to create social stability in rural regions and maintain food security at an optimal level. The sanctions imposed by Western countries in 2022 had a significant impact on the functioning of the sector. Sales markets have changed; restrictions on the supply of breeding cattle have led to a break in logistics chains; technological challenges have arisen, manifested in dependence on foreign solutions in the field of genetics and automation. Under the current conditions, assessing the impact of sanctions on the agro-industrial complex becomes critically important for the state in order to timely adjust support measures; it makes it possible to work out predictive models for the development of the industry.
To clarify the impact of restrictive instruments on dairy farming, it is advisable to conduct a timely analysis of the factors determining the sustainability of the industry ( Tab. 1 ).
The advantage of the presented classification is to identify key conditions that reflect logistical connections, market conditions and take into account biological parameters.
In the context of ongoing geopolitical tension and growing sanctions pressure from the United States and a number of Western countries, the issue of food security of the state and the sustainable development of its agro-industrial complex is particularly acute. Due to the high dependence on imports, dairy cattle breeding, as one of the vital food segments of the country’s economy, has found itself in a rather difficult position. An analysis of the impact of sanctions restrictions on dairy farming can help not only identify problems that have arisen in the industry, but also substantiate a set of national and sectoral measures aimed at ensuring its sustainable functioning in a significantly changed economic environment.
The entire sanctions period can be roughly divided into several stages1.
The first stage is 2014. The beginning of sanctions pressure.
The European Union and the United States have restricted the supply of equipment and a number of preparation for dairy cattle breeding, and have practically banned cooperation with
Table 1. Key factors in the development of dairy cattle breeding in the regions
|
Group of factors |
Key factors |
Impact on industry |
Research methodology |
|
Economic |
Sanctions restrictions |
Lower imports of breeding cattle, feed, and equipment; increased logistical costs |
Analysis of the elasticity of demand for import substitution using econometric models |
|
Government support |
Subsidies, preferential loans, compensation for feed costs |
Assessment of the effectiveness of government programs through ROI (return on investment) in different regions |
|
|
Inflation and pricing |
Cost increase → decrease in profitability |
Correlation analysis of feed and milk price dynamics |
|
|
Technological |
Import substitution of machinery |
Dependence on foreign milking machines, feed distributors |
Comparison of the effectiveness of domestic and imported technologies |
|
Farm automation |
Increased productivity, but requires investment |
Case study of the implementation of robotic farms in the context of sanctions |
|
|
Biological |
Genetics and breeding |
Dependence on import of seed and breeding cattle |
Analysis of the growth dynamics of local breeding farms |
|
Feed base |
Protein feed shortage due to sanctions |
Assessment of the transition to alternative feed (insects, silage crops) |
|
|
Logistics |
Supply chains |
Increase in the cost of transport, search for new routes |
GIS-analysis of changes in logistics flows |
|
Market |
Domestic demand |
Stable consumption of dairy products |
Research on changes in consumer preferences (for example, an increase in demand for cheeses) |
|
Export opportunities |
Reorientation from the European Union to Asia and the CIS |
Analysis of new sales markets through gravity trading models |
|
|
Environmental |
Climate change |
Impact of droughts on the food supply |
Forecasting risks using climate indices |
|
Social |
Staffing shortage |
Lack of veterinarians and animal technicians |
Assessment of migration of specialists from the industry |
According to: EU-Russia Agricultural Trade After 2022: Sectoral Analysis (2022). European Commission. Brussels: EC Directorate-General for Agriculture; Kuznetsov P.I. (2023). Digitalization of Dairy Farms: Russian Experience. Kazan: Izd-vo Kazanskogo GAU; Sidorenko V.V. (2021). Economic Sustainability of the Agro-Industrial Complex in the Face of Sanctions. Saint Petersburg: Profi-Inform; Resilience of Agricultural Systems to Geopolitical Shocks (2023). World Bank. Washington, DC.
international organizations in the field of breeding and genetics of cattle (Viking Genetics, ALTA Genetics, ABS, etc.)2.
Russia has imposed retaliatory restrictive measures on the import of products from “unfriendly countries”. The import ban includes breeding cattle, milking parlors, milk feeding and cooling systems, compound feeds, feed additives, amino acids, protein concentrates and premixes, vaccines and hormones for reproductive control. Logistical and genetic chains were disrupted, and dependence on alternative suppliers increased. In addition, a number of Russian banks involved in financing dairy farming have been disconnected from Western capital markets, making it more difficult to purchase imported equipment and technology on credit. In this regard, there is an urgent need to develop state import substitution programs.
The second stage is 2015–2017. Maintaining and expanding sanctions pressure.
At this stage, Russia’s dairy cattle industry was under serious pressure in the context of the ongoing and expanding sanctions regime and retaliatory measures from the Russian Federation.
There were significant problems in completing the milking herd, as up to 70% of highly productive breeding cattle were purchased in the European Union and Canada, and breeding cattle imported from Brazil and Belarus could not compensate for losses in genetic quality3.
DeLaval, GEA and Westfalia milking machines became unavailable, and problems with their maintenance arose, which forced manufacturers to switch massively to Chinese and Russian analogues that were inferior in quality.
The import ban of feed additives and premixes has led to a shortage and an increase in the cost of rations. The shortage of imported drugs has become acute, which has led to difficulties with vaccination and treatment of animal diseases.
There were difficulties in attracting foreign capital and lending to the industry, the cost of milk production increased and, despite partial compensation from government subsidies and subventions, profitability decreased.
As a response, Russia launched the state program “Development of agriculture” 2013–2020, which includes the section “Development of Russian livestock breeding”, allocated subsidies for the purchase of Russian equipment for dairy cattle breeding, provided support for breeding and genetic centers in the Krasnodar Territory and the Republic of Tatarstan, and developed the first national analogues of feed additives and vaccines4.
The third stage is 2018–2021. Development of import substitution processes in dairy cattle breeding.
This period of industry development can be described as a transition from short-term and impulsive reactions to sanctions and restrictions to systemic measures to replace external resources, technologies and breeding material with domestic (or imports from friendly countries). At this stage, the state has not only preserved, but also expanded measures to support dairy cattle breeding within the framework of the national programs “Agricultural development” and “Integrated rural development”. State programs to support dairy cattle breeding have been activated, production of equipment has been localized, and the development of breeding and feed supply has been strengthened, which has somewhat stabilized the situation in the industry5.
Among the real transformations, the creation of genetic centers in five regions of Russia should be highlighted, whose tasks included providing farms with breeding material and consulting support on breeding issues. This led to an increase in the reproduction efficiency of the dairy herd. The launch of new and expansion of existing plants for the production of premixes, amino acids, vitamin and mineral complexes has reduced the cost of feeding and improved the quality of the diet. There are government programs for partial compensation of costs for the purchase of domestic equipment. The introduction of digital accounting systems for milk yields, feed and health indicators (ERP, CRM systems for the agricultural sector) made it possible to automate individual accounting and monitoring of the condition of animals. Agricultural courses and online training for farmers and specialists have helped to improve the skills of workers and reduce the impact of management errors.
The fourth stage is 2022. A new wave of restrictions.
After the start of the special military operation (SMO) and a significant increase in sanctions pressure, new strict restrictive measures were introduced, affecting almost all components of the industry’s production chain.
The complete cessation of cooperation with foreign companies has practically stopped the supply of modern milking and refrigeration equipment, spare parts, veterinary preparations, genetic materials, technical support and access to the latest technologies. The disconnection of Russian banks from SWIFT, currency restrictions, the freezing and termination of existing contracts have made it difficult to import even from countries that have not officially supported the sanctions. Supply disruptions through ports in unfriendly countries and the reorientation to rail routes through China have increased delivery times and complicated access to critical components.
Compensatory measures include the development of accelerated import substitution programs aimed at localizing the production of livestock equipment, medicines and feed components, as well as cooperation with manufacturers from China, India, Turkiye and Brazil to supply alternative analogues; activation of programs for accelerated reproduction of breeding stock, grants and subsidies for genetic laboratories, the opening of a number of new breeding centers expansion of government support in the form of subsidies for the purchase of Russian equipment, compensation of interest rates, etc.
This stage confirmed the importance of national technological independence and the need for longterm planning for the development of dairy farming in the context of global turbulence.
The fifth stage is 2023–2024. Transition to sustainable operation under the sanctions regime.
After a period of intense external constraints and internal changes, this stage has become a time of stabilization and adaptation of dairy farming to the new reality. There are signs of sustainable development of the industry in conditions of limited access to external resources. The main direction of the state policy was the completion of localization processes of critical production equipment and technological solutions.
Breeding centers in Tatarstan, the Vologda, Novosibirsk, and Orel regions began independent production of embryos and sperm from breeding bulls, which fully met the need for breeding material for dairy breeds. Distance learning and retraining programs for livestock specialists have been launched with the support of the Ministry of Agriculture and the RANEPA. By opening our own production facilities, import dependence on vaccines and preparations has significantly decreased. Regional support programs for smart farms and small dairy cooperatives have been implemented in 12 regions6.
The government has focused on creating a sustainable financial base for the development of dairy farming. The program of preferential loans at 5% was extended for 7 years, providing for the purchase of equipment, the construction of farms, the introduction of IT systems, special grants for the introduction of digital solutions and exemption from property tax for up to 5 years during the construction of new dairy complexes and farms7.
As a result, due to active government support, localization of equipment, genetic independence and the introduction of digital solutions, the industry has significantly increased profitability, reduced import dependence and strengthened sustainability.
The impact of the Russian embargo on the dairy sector of the EU economy
The economic sanctions imposed against Russia in 2014 and the retaliatory counter-sanctions led to serious problems in the dairy industry of the EU countries, as after the introduction of the Russian embargo, the import of European dairy products to Russia was completely banned, which caused a crisis of domestic overproduction.
It is worth noting that the EU promptly adopted a set of anti-crisis measures, including subsidizing the storage of excess milk powder and butter (Private
Storage Aid program); compensation for losses to farms (more than 1 billion euros); compensation for costs caused by voluntary production cuts (Milk Reduction Scheme program); export subsidies to producers to enter new commodity markets.
As a result, the EU was able to partially stabilize the domestic dairy market by 2016, and by 2018, fully restore the dairy export volume, changing the geography of supplies (Bojnec, Ferto, 2017; Balkyte, Tvaronaviciene, 2019).
The sanctions against Russia have become a turning point in the development of the dairy sector of the EU economy. The loss of a major trading partner in the Russian Federation initially caused a crisis, but then led to an export reorientation to Asian and Middle Eastern markets, technological modernization of the industry, increased production efficiency and improved product quality. The EU example has shown that with a sound financial policy, sanctions can become not only a factor in the decline and degradation of production levels, but also a stimulus for development and economic growth.
The impact of economic sanctions on the dairy sector of the economy of the Republic of Belarus
After 2014, the Republic of Belarus, having lost access to European markets, took advantage of the opportunity to occupy a part of the Russian food market vacated as a result of sanctions. In 2015, the share of Belarusian products in Russian dairy imports reached 80%. This situation has made the Belarusian dairy industry dependent on the external political environment, but it is trade with Russia that has become and currently remains the main source of foreign exchange earnings for most local enterprises.
The expanding cooperation with the Russian Federation is a factor and an incentive for large-scale modernization of production. From 2015 to 2023, more than 400 dairy farms were reconstructed in the Republic of Belarus, and milk production increased from 6.8 to 7.8 million tons.
State regulation remains the basis of the Belarusian economic model. The state determines the purchase prices for milk, subsidizes the purchase of feed and machinery. Economic sanctions have become for the country not only a test of strength, but also an opportunity to expand production, modernize equipment, develop sales markets, etc. (Ley, Tochitskaya, 2021; Belyaeva, Kharitonova, 2022).
The impact of economic sanctions on the dairy sector of the economy of the Islamic Republic of Iran
The sanctions, which have restricted access to foreign technology and capital, have had a rather peculiar effect on the dairy sector development of the economy of the Islamic Republic of Iran. Under their influence, an isolated and self-sufficient model of dairy production was formed, combining state planning and elements of independent regional development.
In 2010, a strategy for the economy of resistance was adopted, aimed at import substitution and strengthening domestic production, as well as a number of government programs to support farmers and develop breeding. As a result, by 2020, the country began fully providing itself with dairy products of its own production8.
The national plan “Iran Dairy Vision 2030” is currently being implemented, aimed at modernizing farms and improving the genetic potential of livestock; expanding opportunities for exporting milk and dairy products to neighboring countries; expanding the production of powdered milk and whey for the confectionery industry (Pourkhanali, Saleh, 2021).
Thus, the dairy industry of the Islamic Republic of Iran was able not only to adapt to the conditions of severe foreign economic restrictions, but also to become one of the most stable areas of the national economy development.
The impact of economic sanctions on the dairy sector of the economy of the Democratic People’s Republic of Korea
Given the country’s constant isolation, the DPRK’s dairy industry remains at a very low technological level, and dairy products are produced in volumes sufficient only to meet the needs of medical and children’s institutions. Some positive developments are observed in relations with China and the Russian Federation, which supply basic equipment and organize the exchange of specialists.
In contrast to Russia, Belarus or Iran, where economic sanctions stimulated import substitution processes ( Tab. 2 ), in the DPRK, they only slowed down technological development and increased food dependence (Frank, 2019).
An analysis of the effects of economic sanctions on the dairy sector in Russia, the EU, Belarus, Iran and the DPRK has shown that the effectiveness of adaptation to changing external conditions is directly related to the quality of institutional management, the level of technological maturity, access to innovative technologies and economic autonomy.
In addition, with high innovation potential and market diversification (the EU and partly the Russian Federation), economic sanctions become an incentive for development; with a closed and centralized economy (Belarus, Iran), economic growth is achieved through the mobilization of domestic resources; with complete isolation (DPRK), sanctions lead to a significant slowdown in development and economic stagnation.
Materials and methods
We selected methods combining qualitative and quantitative analysis to assess the impact of sanctions on key parameters. We consistently used three different calculation methods for increasing the degree of objectivity and reliability of the presented studies:
-
1) method of linear convolution (weighted sum) with preliminary normalization of each particular indicator, and then their averaging taking into account the weights;
-
2) method of geometric convolution (multiplicative index), i.e. a method of constructing an integral indicator based on the geometric mean of normalized values, in which low values of one factor do not have a decisive effect on the final index;
Table 2. Indicators of the dairy farming industry before and after the introduction of sanctions
|
Indicator |
Country |
||||
|
Russia |
EU |
Belarus |
Iran |
North Korea |
|
|
Period before/after |
2010–2013 / 2015– |
2010–2013 / |
2010–2013 / |
2008–2011 / |
2008–2011 / |
|
sanctions, years |
2024 |
2014–2024 |
2015–2024 |
2012–2024 |
2012–2024 |
|
Milk production |
+5% |
-1,8% |
+20% |
+17% |
-23% |
|
Annual salary per cow |
+36% |
+7% |
+26% |
+38% |
-12% |
|
Number of animals |
-12% |
-14% |
-7% |
-12% |
-13% |
|
Import share |
-19 p. p. |
+3 p. p. |
-6 p. p. |
-10 p. p. |
+10 p. p. |
|
Exported countries |
CIS, China, Middle East countries |
Africa, Asia, Middle East |
Russia, Kazakhstan, China |
Iraq, Afghanistan, UAE |
no |
|
State support |
+130% |
+10% |
+66% |
+120% |
-75% |
|
Main effect of sanctions |
Import substitution, increased processing |
Loss of the Russian market |
Export growth in the RF |
Growth of domestic investments |
Dependence on China |
|
Key issues |
Import of machinery and genetics |
Energy costs, falling prices |
Limited markets |
Lack of technology |
Shortage of feed, isolation |
According to: Kuznetsova I., Yanbykh R. (2021). Russian food security and the import substitution policy: The case of dairy. Russian Journal of Economics, 7(3), 266–285; EU dairy farms report 2020. DG Agriculture and Rural Development (2020). European Commission; Impact of Sanctions on Agricultural Trade and Food Security in the Eurasian Region (2023). Food and Agriculture Organization of the United Nations (FAO); (Belyaeva, Kharitonova, 2022); (Pourkhanali, Saleh, 2021); Final Report of the Panel of Experts Submitted Pursuant to Resolution 2345 (2017). United Nations, S/2021/211.
-
3) methodology using the Harrington desirability function, which allows converting each indicator into a scale [0; 1] according to the degree of desirability and is most often used to assess the degree of compliance of parameters with a normative or other set level.
We propose to use the composite index developed by us based on four key indicators to assess the sustainability of dairy cattle breeding ( Tab. 3 ).
The index is calculated when the indicators are normalized (min-max scaling to bring them to a scale of 0–1), taking into account the weight by aggregating them into the final index:
Indexsustainability = 0.3 × Econ. + 0.3 × Prod. +
+ 0.2 × Market + 0.2 × SocEnv.
Weight combinations were determined based on several methods. With the help of expert analysis, average significance estimates for key factors were identified: economic – 4.7, production – 4.5, market – 3.8, socio-environmental – 3.5. The main component method based on statistical analysis of the RSA revealed the explanatory power of conditions in the following proportions: economic – 28% variance, production – 27% variance, market – 19% variance, socio-ecological – 16% variance.
We used comparative analysis methods of software to assess the impact of sanctions: Python 3.10 (libraries: Pandas, Scikit-learn, Folium, Matplotlib); Google Colab for cloud computing. Cartographic visualization is based on an interactive map (Folium) with color differentiation and static maps (Matplotlib) for accounting documents.
Results
In the course of the research, we used digital material obtained exclusively from open sources of information as the initial data. In the absence of a complete set of reliable annual statistics, a logically constructed trend based on general industry data was applied, taking into account the patterns identified in the research process.
-
Table 4 presents the initial data for calculating the integral index of dairy cattle breeding development.
The integral index was calculated using the linear convolution method as the average value of the normalized indicators: milk production, average annual yield (positive impact), equipment imports, feed imports, and milk costs (negative impact). Normalization was carried out using the min-max method. The integral index I t for each year was found by the formula:
I t = ^=1 ^ , (2)
where t – serial number of the year;
X ^ — normalized value of the i -th indicator.
Table 3. Indicators for assessing the sustainability of dairy farming under sanctions*
|
Component |
Indicator |
Weight in the index, % |
|
Economic sustainability |
Profitability of dairy farming (%) Share of government support in revenue (%) Dependence on imported feed and machinery (%) |
30 |
|
Production sustainability |
Milk yield per 1 cow (kg/year) Dairy herd (thousand heads) Share of automated farms (%) |
30 |
|
Logistical and market sustainability |
Export volume of dairy products (thousand tons) Availability of alternative markets (diversification index) |
20 |
|
Socio-environmental sustainability |
Availability of locally produced feed (%) Staffing (number of veterinarians per 1,000 heads) |
20 |
|
* The index weight is determined based on the following methods: PCA, consistency criterion, regression analysis. Source: own compilation. |
||
Table 4. Initial data for calculating the integral index of dairy cattle breeding in the Russian Federation, 2013–2024
|
Yea r |
Milk production, million tons |
Share of equipment imports, % |
Share of feed and drug imports, % |
Average annual weight, kg |
Profitability, % |
|
2013 |
30.5 |
70 |
60 |
4,400 |
10.5 |
|
2014 |
31.0 |
65 |
57 |
4,500 |
11.2 |
|
2015 |
30.8 |
60 |
55 |
4,550 |
10.8 |
|
2016 |
30.2 |
55 |
53 |
4,700 |
9.6 |
|
2017 |
30.7 |
50 |
50 |
4,900 |
10. 1 |
|
2018 |
30.9 |
48 |
47 |
5,100 |
10.9 |
|
2019 |
31.6 |
45 |
43 |
5,500 |
14.2 |
|
2020 |
32.2 |
42 |
40 |
5,800 |
19.5 |
|
2021 |
32.6 |
40 |
38 |
6,200 |
20.1 |
|
2022 |
32.8 |
38 |
35 |
6,700 |
20.2 |
|
2023 |
32.9 |
36 |
33 |
7,400 |
29.9 |
|
2024 |
33.1 |
35 |
30 |
7,650 |
31.8 |
|
Source: Agriculture, hunting and forestry in Russia: Statistical collection Moscow: Rosstat, 2023; Analytical report on the state and development of dairy farming in Russia for 2022–2024. Ministry of Agriculture of the Russian Federation: Moscow, 2024; Global Dairy Market Overview. FAO. 2024. |
|||||
Table 5 shows the calculation of the integral index of dairy cattle breeding development and shows the dynamics of its change in 2013–2024. According to the data, during the period under review, the integral index for the development of dairy cattle breeding in Russia demonstrates steady growth, which indicates the industry’s transition from a state of high dependence on imports and low animal productivity to a phase of effective industry development. A particularly noticeable increase has been observed since 2019, due to adaptation to external constraints and improved production efficiency.
The geometric convolution method using z-normalization made it possible to give a more sensitive assessment of the integral index of dairy cattle breeding development. The general formula for calculating the integral I t index is as follows:
4 = (П?=11 ^^ Й (3) °i where х;ср — average value of the i-th indicator for the entire period;
σ i – standard deviation of indicator i .
Table 5. Calculation of the integral index of dairy cattle breeding development RF by linear convolution, 2013–2024
Year Milk production Share of equipment imports Share of feed and drug imports Average annual salary Profitability Integral index 2013 0.103 0.0 0.0 0.0 0.04 0.029 2014 0.276 0.143 0.1 0.031 0.071 0.124 2015 0.207 0.286 0.167 0.046 0.054 0.152 2016 0.0 0.429 0.233 0.092 0.0 0.151 2017 0.172 0.571 0.333 0.154 0.018 0.25 2018 0.241 0.629 0.433 0.215 0.063 0.316 2019 0.483 0.714 0.567 0.338 0.196 0.46 2020 0.690 0.811 0.667 0.431 0.442 0.606 2021 0.828 0.857 0.733 0.554 0.464 0.687 2022 0.897 0.914 0.833 0.708 0.464 0.763 2023 0.931 0.971 0.9 0.923 0.911 0.927 2024 1.0 1.0 1.0 1.0 1.0 1.0 According to: Agriculture in Russia: Statistical collection Moscow: Rosstat, 2015–2024. Available at:
Table 6 shows the integral index of the dairy cattle breeding development in the Russian Federation for 2013–2024 calculated using this method.
The use of z-normalization made it possible to assess the strength and balance of the development of Russian dairy farming in the face of sanctions pressure. We should say that in the period 2013– 2017, the integral index had multidirectional dynamics, indicating an unstable level of health, and since 2020, a gradual increase in the indicator begins, reflecting the beginning of positive processes in the industry.
The methodology using the Harrington desirability function provides for the calculation of each annual Dt index according to formula (3), followed by the geometric mean of all partial desirability coefficients:
Dt = exp (- exp (-b ^^^M) , (4)
лтах Amin where Xt – actual value of indicators;
Хma x , Xmin – acceptable range of indicator values; b – empirical coefficient.
Table 7 shows all calculations using this method.
Calculations using the Harrington desirability function show that, despite a significant decrease in desirability for a number of indicators at the beginning of the 2014–2016 sanctions period, the index began to grow and reached its highest values in 2024, which corresponds to a “good” rating on the desirability scale.
Table 6. Calculation of the integral index of dairy cattle breeding development RF by geometric convolution using z-normalization, 2013–2024
Year Milk production Share of equipment imports Share of feed and drug imports Average annual salary Profitability Integral index 2013 -1.099 -1.917 -1.552 -1.112 -0.804 0.256 2014 -0.603 -1.467 -1.24 -1.021 -0.711 0.152 2015 -0.801 -1.018 -1.032 -0.975 -0.764 0.058 2016 -1.396 -0.569 -0.824 -0.838 -0.924 0.148 2017 -0.901 -0.12 -0.511 -0.655 -0.871 0.286 2018 -0.702 0.06 -0.199 -0.472 -0.738 0.511 2019 -0.008 0.329 0.217 -0.107 -0.339 0.989 2020 0.587 0.599 0.529 0.168 0.392 1.445 2021 0.983 0.779 0.737 0.533 0.459 1.688 2022 1.181 0.958 1.049 0.99 0.459 1.912 2023 1.281 1.138 1.257 1.63 1.788 2.406 2024 1.479 1.228 1.569 1.859 2.054 2.622 According to: Agriculture in Russia: Statistical collection. Moscow: Rosstat, 2015–2024. Available at:
Table 7. Calculation of the integral index of dairy cattle breeding development RF by geometric convolution using the Harrington desirability function, 2013–2024
Year Milk production, million tons Share of equipment imports, % Share of feed and drug imports, % Average annual weight, kg Profitability, % Integral index 2013 0.0015 0.0001 0.0001 0.0001 0.0002 0.0001 2014 0.0458 0.0042 0.0013 0.0001 0.0005 0.0015 2015 0.0159 0.0520 0.0072 0.0002 0.0003 0.0031 2016 0.0001 0.1913 0.0248 0.0011 0.0000 0.0015 2017 0.0081 0.3749 0.0885 0.0054 0.0001 0.0100 2018 0.0281 0.4431 0.1972 0.0184 0.0004 0.0285 2019 0.2604 0.5308 0.3690 0.0931 0.0131 0.1438 2020 0.5075 0.5993 0.4844 0.1940 0.2080 0.3585 2021 0.6175 0.6351 0.5476 0.3528 0.2365 0.4477 2022 0.6557 0.6640 0.6211 0.5247 0.2365 0.5069 2023 0.6713 0.6871 0.6574 0.6679 0.6624 0.6692 2024 0.6968 0.6968 0.6968 0.6968 0.6968 0.6969 According to: Agriculture in Russia: Statistical collection. Moscow: Rosstat, 2015–2024. Available at:
For the convenience of analyzing the results obtained, a graphical visualization of the data was carried out ( Fig. 1 ).
The nature of the chart for the period under study confirms the steady growth of the integral index of dairy cattle breeding in the Russian Federation according to all the calculation methods presented. Despite the apparent slowdowns or plateaus noticeable in some years, the overall development vector is positive.
The linear convolution shows a steady sustainable improvement in the index after 2017, and from 2020 to 2024 there has been intensive growth associated with increased government support for the industry and increased import substitution processes.
Geometric convolution is more sensitive to high values of particular indicators, and sharp changes in the index in the period 2018–2024 indicate a qualitative leap in the face of sanctions pressure.
The Harrington desirability function curve shows a relative plateau with acceleration after 2018, indicating a transition from a “bad” state to a “moderate” one and then (after 2023) a “good” level.
Let us determine the sustainability of the industry based on the proposed indices. Weights from the EU experience in assessing the effects of the 2014 sanctions and the FAO Dairy Sustainability Index (2022) were adapted for the calculation. We selected 12 indicators for 85 RF regions for 2022–2023 as the initial data. Factor loadings were determined based on the RSA method and the rotated component matrix ( Tables 8, 9 ).
Component 1: “Economic sustainability” (pressures on profitability and government support).
Component 2: “Production capacity” (milk yield and livestock loads).
Component 3: “Market activity” (export burden).
Component 4: “Resource availability” (feed load).
Figure 1. Dynamics of changes in the level of dairy cattle breeding development in the RF, 2013–2024
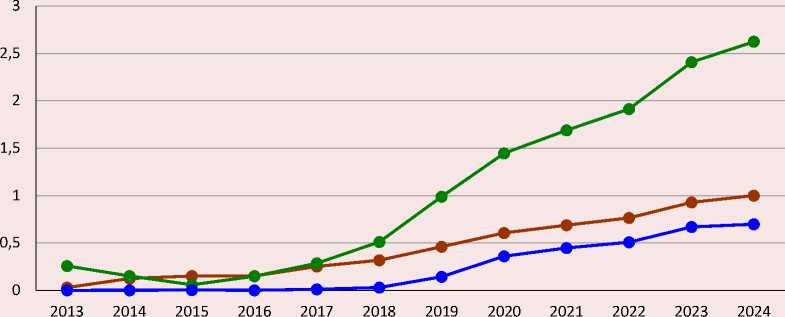
—•— Linear convolution —•— Geometric convolution —•— Harrington function
Source: Regions of Russia. The main socio-economic indicators of cities. 2023: Statistical collection Moscow: Rosstat. 2023; Agriculture in Russia: Statistical collection. Moscow: Rosstat, 2015–2024. Available at:
Table 8. RSA results
|
Component |
Proper value |
% of the explained variance |
Cumulative % |
Вес, % |
|
1 Economic |
3.85 |
32.1 |
32.1 |
38.9 |
|
2 Production |
2.97 |
24.8 |
56.9 |
30.00 |
|
3 Market |
1.76 |
14.7 |
71.6 |
17.8 |
|
4 Socio-environmental |
1.32 |
11.0 |
82.6 |
3.3 |
Table 9. Factor loadings (rotated component matrix)
|
Indicator |
Component 1 (Economic) |
Component 2 (Production) |
Component 3 (Market) |
Component 4 (Socio-environmental) |
|
Profitability |
0.92 |
0.15 |
0.08 |
0.03 |
|
Share of state support |
0.87 |
0.22 |
0.12 |
0.09 |
|
Milk yield for a cow |
0.11 |
0.94 |
0.05 |
0.08 |
|
Livestock |
0.18 |
0.89 |
0.13 |
0.07 |
|
Export volume |
0.09 |
0.07 |
0.91 |
0.12 |
|
Availability of feed |
0.05 |
0.11 |
0.14 |
0.93 |
Let us calculate the weights:
Component_Weight = (Proper value) / (Sum of the eigenvalues of the selected components)
Economic: 3.85/9.90 ≈ 0.39 → Rationing is up to 30%.
Production: 2.97/9.90 ≈ 0.30 → 30%.
Market: 1.76/9.90 ≈ 0.18 → 20%.
Socio-environmental: 1.32/9.90 ≈ 0.13 → 20%.
Based on the developed methodology and refined weights, we will compile a table of the regions’ rating according to the dairy cattle sustainability index ( Tab. 10 ).
Table 10. Rating of regions according to the dairy cattle sustainability index, 2023
|
Rating |
Region |
Econ. (30%) |
Prod. (30%) |
Market (20%) |
Soc-env. (20%) |
Final index |
Sustainability Group |
|
1 |
Republic of Tatarstan |
0.85 |
0.90 |
0.75 |
0.80 |
0 .83 |
High |
|
2 |
Krasnodar Territory |
0.80 |
0.85 |
0.70 |
0.75 |
0.78 |
High |
|
3 |
Republic of Bashkortostan |
0.75 |
0.80 |
0.65 |
0.70 |
0.73 |
High |
|
4 |
Belgorod Region |
0.78 |
0.72 |
0.68 |
0.65 |
0.72 |
High |
|
5 |
Voronezh Region |
0.70 |
0.75 |
0.60 |
0.65 |
0.68 |
Average+ |
|
6 |
Altai Territory |
0.65 |
0.70 |
0.55 |
0.60 |
0.63 |
Average+ |
|
7 |
Leningrad Region |
0.68 |
0.65 |
0.58 |
0.55 |
0.6 2 |
Average+ |
|
8 |
Sverdlovsk Region |
0.60 |
0.65 |
0.50 |
0.55 |
0.58 |
Average+ |
|
9 |
Kirov Region |
0.58 |
0.62 |
0.48 |
0.52 |
0.56 |
Average+ |
|
10 |
Rostov Region |
0.55 |
0.60 |
0.45 |
0.50 |
0.54 |
Average+ |
|
11 |
Novosibirsk Region |
0.50 |
0.58 |
0.42 |
0.48 |
0.51 |
Average+ |
|
12 |
Omsk Region |
0.48 |
0.55 |
0.40 |
0.45 |
0.49 |
Average+ |
|
13 |
Tyumen Region |
0.45 |
0.52 |
0.38 |
0.42 |
0.46 |
Low+ |
|
14 |
Kaliningrad Region |
0.42 |
0.48 |
0.35 |
0.40 |
0.43 |
Low+ |
|
15 |
Chelyabinsk Region |
0.40 |
0.45 |
0.32 |
0.38 |
0.40 |
Low+ |
|
16 |
Irkutsk Region |
0.35 |
0.42 |
0.28 |
0.32 |
0.36 |
Low |
|
17 |
Amur Region |
0.30 |
0.38 |
0.25 |
0.28 |
0.32 |
Low |
|
18 |
Republic of Sakha (Yakutia) |
0.28 |
0.32 |
0.22 |
0.25 |
0.28 |
Low- |
|
19 |
Magadan Region |
0.25 |
0.28 |
0.18 |
0.20 |
0.2 4 |
Critical |
|
20 |
Chukotka AA |
0.20 |
0.22 |
0.15 |
0.18 |
0.19 |
Critical |
|
21 |
Vologda Region |
0.60 |
0.78 |
0.70 |
0.65 |
0.68 |
Average+ |
|
Source: own compilation. |
|||||||
The presented data demonstrate high indicators for the Republic of Tatarstan (0.83), the Krasnodar Territory (0.78), and the Republic of Bashkortostan (0.73). The main success factors are high profitability (15–20%), over 85% availability of feed, and the availability of developing automated farms and processing plants. The average values for regions with a sustainability index of 0.5–0.7. These territories are characterized by limited export opportunities and moderate dependence on feed imports (30–50%). The recommendations for them include the development of the feed base and the modernization of equipment. The outsiders among the regions with an index value of less than 0.4 are the Magadan Region and the Chukotka Autonomous Area, which are highly dependent on imported feed (> 70%). To achieve optimal results, they need to create logistics hubs and develop greenhouse feed production. The Vologda Region is one of the leaders in dairy cattle breeding: the final index is 0.68, which indicates values above the average level of industry development. After the sanctions imposed in 2022, the region faced problems related to rising production costs and a shortage of imported equipment. However, active government support measures have helped the industry adapt and achieve record cow productivity. Figure 2 shows the main indicators of the development of dairy cattle breeding in the Vologda Region.
Despite the sanctions, milk production increased by 3.2% in 2022 due to increased cow productivity. The increase in this indicator in 2023 was 9.2% compared to the previous one. In 2024, this indicator will stabilize at a high level and the historical maximum productivity of cows will be reached – 8,843 kg per cow.
Figure 3 presents the cartogram of the distribution of regions according to the sustainability index of the dairy farming industry.
Geographical distribution has shown the best results in the regions of the Central and Southern federal districts, special measures are required in the territories of the Far East and the North.
The average sustainability index for 2023 increased by 8.3% ( Fig. 4 ). Despite the prohibitive measures from Western countries, the industry is demonstrating successful adaptation in most regions. Territories with diversified economies (Voronezh and Chelyabinsk regions) show minimal changes.
Figure 2. Main indicators of the development of dairy cattle breeding in the Vologda branch for 2021–2024
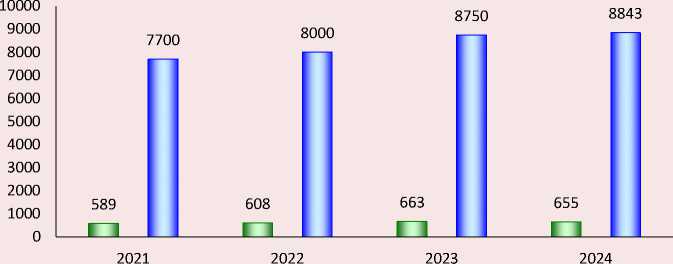
□ Milk production (thousand tons) о Average milk yield per cow (kg)
Source: Livestock numbers in agricultural organizations of the Vologda Region: Statistical report. Federal State Statistics Service. Moscow,2024. Available at: (accessed: 13.11.2025); About livestock and milk production in the Vologda Region farms: Statistical report. Territorial Body of the Federal State Statistics Service for the Vologda Region (Volgdastat). Vologda, 2021–2024. Available at: (accessed: 13.11.2025).
Figure 3. Cartogram of the distribution of regions according to the dairy cattle sustainability index for 2023
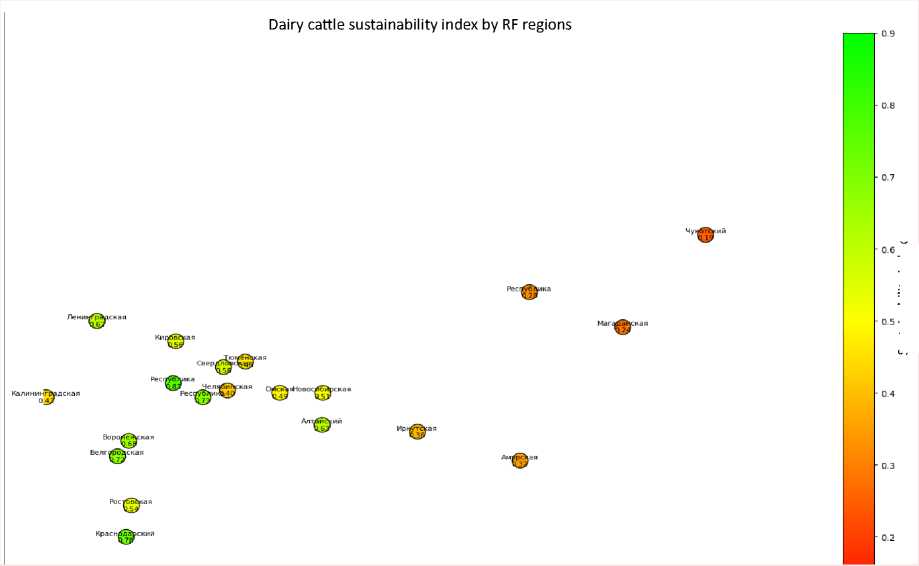
Sustainability index
Source: data from Table 8. Software: Python 3.10, Libraries: Folium 0.14.0., GeoPandas 0.12.2, Matplotlib 3.7.1, Pandas .0.3 in the Google Colab cloud development environment.
Figure 4. Dairy Cattle Sustainability Index by the RF regions for 2021, 2023
Meaning
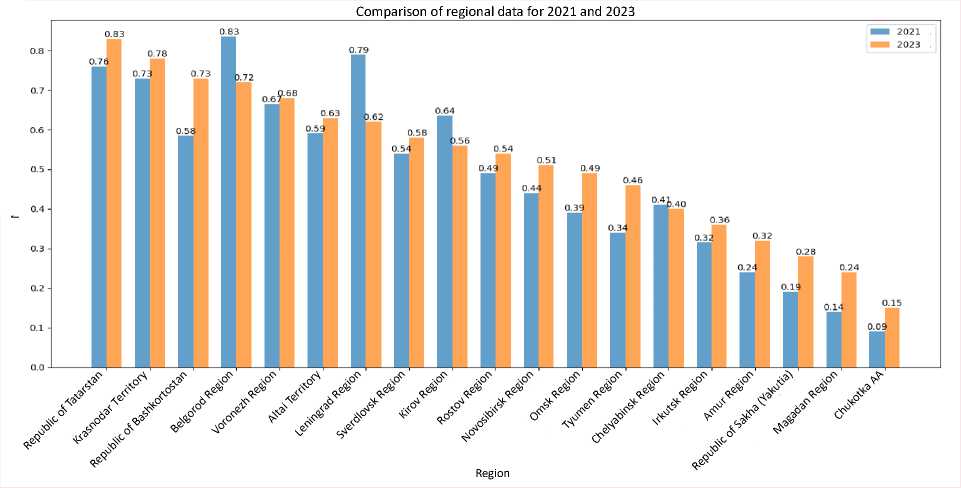
Source: data from our methodology calculation “Dairy Cattle Sustainability Index”.
The forecast of the dairy cattle breeding development will allow the government and business to understand the effects of the processes taking place in the economy and other areas and prepare in advance for the upcoming tasks. Modeling conditions makes it possible to assess the scenario consequences of various options: inertial development, optimistic (easing sanctions and increasing government support), pessimistic (strengthening sanctions and reducing aid).
In the face of increasing external pressure and the need for adaptation, the government, based on the forecast, will be able to justify the amount of subsidies and form support programs. Businesses, in turn, will be able to assess how profitable investments in dairy farming are and what risks should be taken into account in planned investment projects.
In this case, there is an urgent need to develop and apply a forecasting tool that allows taking into account not only the internal dynamics of changes in indicators, but also the impact of key macroeconomic regulators on the object under consideration. From the variety of existing analysis methods, we selected the ARIMAX model, i.e. an extended version of moving average autoregression (ARIMA), which, when making a forecast, takes into account not only the internal state of the system itself, but is also able to integrate the influence of controlled environmental factors into calculations (formula 5):
У = с + S^y;- + v^ej^ ■ 5 + S^iPkykt + St.
where Yt – value of the predicted indicator t;
с – constant reflecting the average level
∅ i – weighting factor reflecting the degree of influence of the previous value on the present;
Ɵ j – coefficient of the moving average, depending on the previous random disturbances in the previous period;
Ɛ t – random error of the predicted value at time t ;
β k – coefficient reflecting the degree of sensitivity of the indicator to changes in the factor.
When constructing the forecast model, special attention was paid to substantiating external regressive factors that have a decisive impact on changes in industry indicators. After conducting a preliminary analysis, the level of sanctions pressure (on a scale of 0–10) and the amount of government support (also on a scale of 0-10) were selected as the basic external factors, since they have a high degree of significance and relevant variability over time. Moreover, sanctions acted in the model as an external destructive factor negatively affecting the pace of development, and government support as a positive indicator compensating for the negative external impact.
The forecast horizon (2025–2030) was not chosen by chance. This period covers the mediumterm implementation cycle of the state agroindustrial policy, and a number of key federal programs are planned to be completed by 2030, which will make it possible to correlate the forecast with real budget forecasting tools.
For businesses, the seven-year period coincides with the payback cycles of most investment projects, and investors will have the opportunity to assess the prospects for return-on-investment risks depending on the proposed development scenarios.
Based on the structure presented in the formula, ARIMAX partial mathematical models were constructed, taking into account the dynamics of changes in partial and integral forecast indicators characterizing the degree of dairy cattle breeding development:
– depending on the volume of milk production y mi lk :
/ milk = 0,9 + 0,76/™ ! - 0,45Xu + 0.72X2 , t + £t ; (6)
– depending on the average annual milk yield per cow yy ield :
yy ieid = 170 + о,85уУ^ы — o,45Xw + 0,72X 2, t + £t; (7)
– depending on the profitability of milk production ytprof :
/prof = 2,9 + 0,72^^ - 1,7^ + 3,6X2 , t + £t; (8)
-
— depending on the import of equipment y™ p1 : Vt imp1 = 3,2 + 0,64^ 1 + 2,1X 1, t - 2,8X 2, t + £t; (9)
– to depend on the import of feed and drugs
-m-
- Vtimp2 = 3,7 + 0,81^2 + 2,3XW - 4,5X2,t + St; (10)
– to calculate the integral development indicator Vtint:
rt int = 0,94 + 0,617^ - 0,032XV + 0,057X 2, t + £t. (11)
Analyzing expression (11), it is necessary to note the following:
– base level of the index is greater than zero, which indicates the internal ability of the system to develop without the influence of external factors;
– value reflecting the degree of influence of the previous value on the next one is 0.61 units, which indicates a fairly high inertia and stability of the industry;
– negative value of the β 1 coefficient (-0.032) confirms the negative impact of sanctions on the development of the industry;
– positive value of the β 2 coefficient (+0.057) indicates the beneficial effect of government support, and since the absolute value is | в2 \ > I в ] I , according to our calculations, support is quite capable of compensating for the industry’s losses from sanctions.
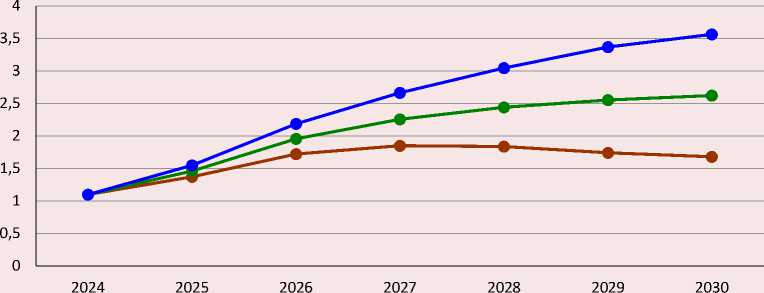
The dynamics of the forecast change in the combined integral index of dairy cattle breeding development was calculated for three scenarios – inertial, optimistic and pessimistic. The unit of measurement is a point (0 points – minimal development; above 3 points – high efficiency). Table 11 presents the calculation results.
To make the research results clearer and easier to perceive, they were visualized ( Fig. 5 ).
Table 11. Combined integral index of development of dairy cattle breeding in Russia, 2025–2030
|
Year |
Development scenario |
||
|
Pessimistic |
Inertial |
Optimistic |
|
|
2025 |
1.373 |
1.462 |
1.552 |
|
2026 |
1.724 |
1.957 |
2.189 |
|
2027 |
1.852 |
2.258 |
2.667 |
|
2028 |
1.837 |
2.443 |
3.048 |
|
2029 |
1.741 |
2.555 |
3.369 |
|
2030 |
1.682 |
2.624 |
3.565 |
Figure 5. Forecast curves of the combined index of dairy cattle breeding in Russia, 2025–2030
Pessimistic Inertial Optimistic
The analysis of the research results allows drawing the following conclusions.
Under an optimistic development scenario involving a consistent easing of sanctions pressure and increased financial support for the industry, the combined integral index demonstrates steady positive dynamics, which indicates the industry’s high potential for growth under favorable development conditions.
The inertial scenario, which provides that the parameters of the sanctions pressure will remain at the level of 2024, shows a more moderate increase in the combined integral indicator, which confirms the internal stability of the industry, but practically excludes the occurrence of breakthrough changes in the context of structural challenges.
A pessimistic scenario involving increased external pressure and a reduction or even termination of government assistance indicates a potential stagnation of the industry.
Conclusion
Thus, the sanctions had a mixed impact on the development of dairy cattle breeding in the period 2022–2024. We can identify several trends:
-
1) dependence on sanctions decreased due to stimulation of own feed production (Central and Volga Federal Districts);
-
2) milk exports to the EAEU countries, the Middle East and China increased by 18–25%, especially in the border areas (Altai Territory, Kaliningrad Region);
-
3) in the Krasnodar Territory and Tatarstan, by increasing subsidies, it became possible to fully compensate for losses from sanctions.
However, the negative consequences in the form of a shortage of high-tech equipment, rising costs and logistics services, spare parts, and the emergence of imbalances between regions require additional measures aimed at developing export prospects and shaping the long-term sustainability of dairy farming in the territories.
Table 12. Main directions of overcoming sanctions measures
|
Type of region |
Key issues |
Recommendations |
Examples of successful measures |
|
Leaders (index > 0.7) Tatarstan, Krasnodar Territory, Bashkortostan |
Risks of oversaturation of the local market; dependence on export logistics chains |
|
Tatarstan: launch of the cluster «From feed to cheese» with a full production cycle; Krasnodar Territory: export development to the UAE through new logistics routes |
|
Average level (index 0.5–0.7) Voronezh, Leningrad, and Sverdlovsk regions. |
Shortage of local forage resources; outdated equipment |
|
Leningrad Region: Farm 4.0 program with robotic milking systems; Voronezh Region: creation of 10 feed cooperatives |
|
Laggards (index < 0.5) Magadan region, Chukotka Autonomous Region, Yakutia |
Extreme climatic conditions; high logistical costs |
|
Yakutia: experiment on growing hydroponic feed in permafrost conditions; Magadan region: preferential tariffs for the air delivery of veterinary drugs |
|
According to: research results. |
|||
Based on the results and conclusions obtained, recommendations can be proposed to improve the position of each region in the context of ongoing sanctions measures ( Tab. 12 ).
Thus, the analysis carried out using various methods of integrated assessment confirms a single vector of movement of Russian dairy cattle breeding – from instability and dependence on imports to sustainability and intensive growth. Despite the initial decline caused by the sanctions restrictions of 2014–2017, in 2022–2024 the industry was able to adapt due to import substitution, increased profitability of production and increased productivity of animals. The steady significant growth of the integral development indices since 2020 indicates the formation of an independent and effective model capable, with the participation and support of the state, of resisting external pressure and contributing to ensuring Russia’s internal food security.
