Proximal femoral nail antirotation versus bipolar hemiarthroplasty for intertrochanteric fractures: a meta-analysis

Author: Damara I.G.A.D., Wijaya N.S.N., Dusak I.W.S.
Journal: Гений ортопедии @geniy-ortopedii
Section: Обзор литературы
Article in issue: 2 т.31, 2025.
Free access
Introduction Intertrochanteric fractures account for almost half of all hip fractures, with a mortality rate of 15 to 20 % within one year following fracture, primarily in elderly patients aged 65 years old and older. The purpose of this study is to compare the operative time, intraoperative blood loss, intraoperative blood transfusion, hospitalization time, weight-bearing time, Harris Hip Score at 1, 3, 6, 12 months follow-up, and complications after proximal femoral nail antirotation versus bipolar hemiarthroplasty for intertrochanteric fracture in elderly patients based on the published literature of their comparison.Methods We conducted a comprehensive search in the electronic databases such as PubMed, Scopus, and Google Scholar. Original articles up to November 2024 were screened, focusing on retrospective or prospective cohort studies.Results and Discussion The initial search yielded 702 studies. Six cohort studies with a total of 495 participants were assessed. The Proximal Femoral Nail Antirotation (PFNA) showed statistically significant shorter operative time (p = 0.006), lower intraoperative blood loss (p function show_abstract() { $('#abstract1').hide(); $('#abstract2').show(); $('#abstract_expand').hide(); }
Proximal femoral nail antirotation, bipolar hemiarthroplasty, intertrochanteric fracture, elderly, harris hip score, complications
Short address: https://sciup.org/142245093
IDR: 142245093 | UDC: 616.718.41/.44-001.511-08-035:616.71-089.844:616.71-089.223 | DOI: 10.18019/1028-4427-2025-31-2-252-262
Антиротационный штифт для проксимального отдела бедра против биполярной гемиартропластики при межвертельных переломах: метаанализ
Введение. Межвертельные переломы составляют почти половину всех переломов бедра, с уровнем смертности от 15 до 20 % в течение одного года после перелома, встречаются в основном у пациентов в возрасте 65 лет и старше.Цель работы - на основе литературных данных об использовании технологий антиротационного штифта для проксимального отдела бедра и биполярной гемиартропластики при межвертельных переломах у пожилых пациентов сравнить показатели времени операции, госпитализации и нагрузки, интраоперационных кровопотери и переливания крови, индекса Харриса, а также оценить послеоперационные осложнения.Методы. Проведен комплексный поиск источников в электронных базах данных PubMed, Scopus и Google Scholar. Для проведения систематического обзора и метаанализа использовали Кокрановское руководство по систематическим обзорам в соответствии с рекомендациями протокола PRISMA. Отобраны оригинальные статьи, ретроспективные или проспективные когортные исследования, опубликованные до ноября 2024 года. Первоначальный поиск дал 702 результата.Результаты и обсуждение. Оценено шесть когортных исследований с общим числом участников 495. При использовании антиротационного штифта зарегистрированы статистически значимо более короткое время операции (p = 0,006) и меньшая интраоперационная кровопотеря (p function show_eabstract() { $('#eabstract1').hide(); $('#eabstract2').show(); $('#eabstract_expand').hide(); }
Text of the review article Proximal femoral nail antirotation versus bipolar hemiarthroplasty for intertrochanteric fractures: a meta-analysis
Intertrochanteric hip fractures are common and often fatal injuries, especially among the elderly. Intertrochanteric fractures account for almost half of all hip fractures, with a mortality rate of 15 to 20 % within one year following fracture [1]. By 2050, Asia is expected to account for more than half of all hip fractures worldwide, owing to an ageing population and increased life expectancy. In Japan, the chance of lifetime hip fractures for people over the age of 50 is stated to be 5.6 % for men and 20 % for women. Hip fracture cases in China are expected to increase sixfold, from 0.7 million in 2013 to 4.5 million by 2050 [2].
The number of hip fractures in the United States alone is expected to rise from approximately 320,000 per year to 580,000 by 2040. This growing demand puts tremendous strain on the health-care system in terms of staffing and resources needed to manage these patients. In the United States, healthcare expenses for the management of hip fractures are anticipated to surpass $10 billion annually [3–8], while the impact on the UK healthcare system is expected to be $2 billion per year [9]. These expenditures are driven not just by the acute surgical treatment, but also by post-acute care, such as rehabilitation. While hip fracture surgery is very effective, patients are likely to endure severe morbidity in terms of pain, discomfort, and limited mobility during their recovery, and in many cases are unable to restore pre-fracture levels of function [3, 6, 9]. Studies also reveal that there is a relationship between hip fracture and higher rates of mortality, with 30 % more deaths seen than the age-matched populations with and without hip fracture [9–14]. However, such findings should be interpreted with caution, as those who have had a hip fracture may be more vulnerable and prone to illness.
The optimum surgical method for intertrochanteric fracture should restore the patient's mobility to preoperative levels while minimising intra- and postoperative morbidity and death. Although proximal femoral nail antirotation (PFNA) has been widely used by orthopaedic specialists for patients with intertrochanteric fractures, PFNA failure has been reported due to extensive comminution, osteoporosis, implant cutout, femoral medialization, and lateral migration of proximal screws or helical blades [15, 16]. As a result, bipolar hemiarthroplasty, which allows for early weight-bearing while reducing the chance of osteosynthesis failure, has become a popular option for older patients with intertrochanteric fractures [17].
The proximal femoral nail antirotation (PFNA) has acquired widespread approval for its minimally invasive nature and biomechanical advantages, which allow for early weight-bearing [18]. This treatment comprises closed fracture reduction under fluoroscopy and the subsequent insertion of an intramedullary nail with a helical blade into the femur, minimising surgical time and blood loss while improving outcomes in terms of fracture union and functional recovery [19, 20]. However, problems such as blade migration and fixation failure have been reported, motivating efforts to identify and mitigate risk factors through continuous research and advancements in surgical procedures and implant designs [21].
For older patients with unstable intertrochanteric femur fractures, hemiarthroplasty with a bipolar prosthesis improves early postoperative ambulation. This would have a direct impact on both postoperative rehabilitation and general health [22].
The objective of this study was to compare the operative time, intraoperative blood loss, intraoperative blood transfusion, hospitalization time, weight-bearing time, Harris Hip Score at 1, 3, 6, 12 months follow-up, and complications after the proximal femoral nail antirotation versus bipolar hemiarthroplasty for intertrochanteric fracture in elderly patients, so that it can help the physician to choose the right treatment for the intertrochanteric fracture in the elderly.
MATERIALS AND METHODS
The Cochrane Handbook for Systematic Reviews of Interventions was used to perform this systematic review and meta-analysis, which was then reported using the Preferred Reporting Items for Systematic Reviews and Meta-Analyses (PRISMA) guidelines.
Search Strategy
Two researchers (IGADD and NSNW) conducted literature search using three databases including PubMed, Scopus, and Google Scholar. The focus of the search was on the topic "proximal femoral nail antirotation versus bipolar hemiarthroplasty for intertrochanteric fracture in elderly". The study used only retrospective and prospective cohort studies. The literature search was performed using the keywords "proximal femoral nail antirotation" OR "PFNA" OR "bipolar hemiarthroplasty" OR "BHA" AND "Intertrochanteric Fracture". Applying filters to English language papers, human studies and cohort (retrospective or prospective) studies. The literature search ensuring inclusion of the terms in titles, abstracts, and keywords for study design and publication year. All search results were evaluated based on titles and abstracts to ensure relevance to the inclusion criteria.
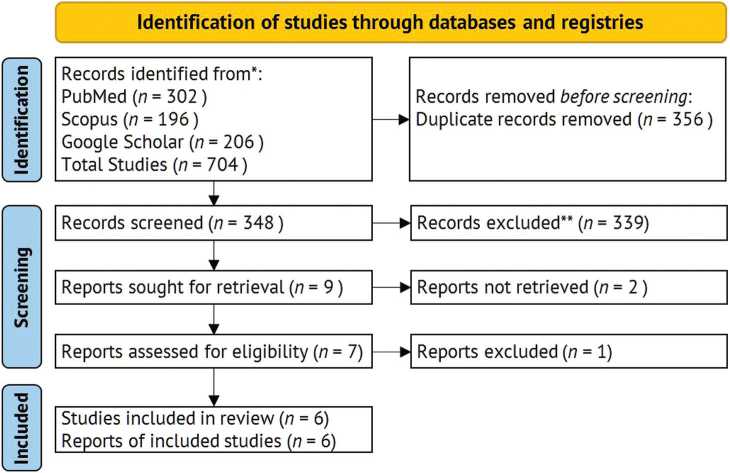
Fig. 1. PRISMA Flowchart 2020
Inclusion and Exclusion Criteria
The Inclusion criteria
-
(1) retrospective or prospective cohort studies comparing the use of the proximal femoral nail antirotation (PFNA) and bipolar hemiarthroplasty (BHA) in patients with intertrochanteric fractures;
-
(2) studies reporting at least one of the following outcomes: operative time, intraoperative blood loss, intraoperative blood transfusion, hospitalization time, weight-bearing time, Harris Hip Score, and complications;
-
(3) the study population included participants aged above 65 years old diagnosed with intertrochanteric fractures;
-
(4) articles published in English;
-
(5) with full texts available.
Exclusion criteria
-
(1) studies design were other than cohort (case report, case series, randomized controlled trials, literature review);
-
(2) studies that did not distinguish outcomes between PFNA and BHA;
-
(3) studies with fewer than 15 patients for each group;
-
(4) article data that could not be quantitatively analysed.
All articles meeting the inclusion criteria were assessed for methodological quality using the Newcastle Ottawa Scale (NOS).
Study Selection
Two reviewers (IGADD and NSNW) independently reviewed the title and abstract of all studies generated from the literature search to exclude irrelevant studies. For potentially eligible studies, 2 reviewers (IGADD and NSNW) independently reviewed the full text of articles (up to November 2024) using the inclusion criteria. The references in the retrieved articles were also carefully searched. Inconsistencies were resolved by discussion by a third author (IWSD). The reviewers were not blinded to the authors, journals, or sources of financial support.
Data Extraction and Quality Assessment
Data extraction and quality assessment were conducted by two reviewers (IGADD and NSNW). Key information for data extraction was collected from each study, including the first author’s name, year of publication, retrospective or prospective cohort studies, sample size, demographic characteristics of participants, fracture classification (Evan-Jensens), treatment groups (proximal femoral nail antirotation and bipolar hemiarthroplasty). Quality assessment of included studies was performed using the Newcastle Ottawa Scale (NOS). NOS used for evaluating three domains: selection of participants, comparability of study groups, and assessment of outcomes. Studies with score ≥ 6 on the NOS were considered of high methodological quality. Disagreement during data extraction was resolved through discussion with a third reviewer (IWSD).
Statistical Analysis
Statistical analysis was conducted employing Review Manager (RevMan) version 5.4.1. Dichotomous data were condensed using odd ratio (OR) with 95 % confidence interval (CI), for continuous data were evaluated using standard mean difference (SMD) and Mean Difference (MD) to define for variation in measurement scale across studies. Heterogeneity was evaluated using the Chi2 test and quantified with the I2. If I2 test > 50 % using random effect model indicating high heterogeneity, if I2 test < 50 % using fixed effect model indicating low heterogeneity. Forest plots were generated to visually provide the pooled effect estimate for each outcome. Statistical significance was set using p value ≤ 0.05. All analyses adhered to PRISMA guidelines for systematic reviews and meta-analysis.
RESULTS
Selection of the Studies
The PRISMA flow diagram shows the study selection process in Figure 1. The initial research obtained a total 704 studies, and through the elimination of duplication 348 studies underwent independent screening and 339 were excluded due to subsequent reason: irrelevant title and abstract, non PFNA and BHA procedures. After exclusion, 7 full-text studies were assessed for the eligibility. At the end, 6 studies (original articles up to November 2024) were included in our data synthesis.
Table 1
Baseline Characteristics of the studies
|
Study |
Country |
Design |
Study Period |
Ages (Mean ± SD) |
Intervention to patients |
|||
|
PFNA |
BHA |
PFNA |
BHA |
Total |
||||
|
C. Cai, et al., 2022 [29] |
China |
Retrospective Cohort |
2014–2019 |
80.88 ± 4.90 |
82.19 ± 3.96 |
34 |
36 |
70 |
|
X. Lu, et al., 2023 [30] |
China |
Retrospective Cohort |
2006–2021 |
92.3 ± 2.7 |
92.1 ± 2.5 |
36 |
77 |
110 |
|
H. Saraf, S. Munot, 2018 [31] |
India |
Retrospective Cohort |
2016–2017 |
82.4 ± 3.9 |
80.8 ± 4.3 |
20 |
20 |
40 |
|
Q.C. Song, et al. 2022 [32] |
China |
Retrospective Cohort |
2012–2016 |
79.9 ± 6.1 |
81.0 ± 9.1 |
32 |
30 |
62 |
|
S. Zhou, et al., 2019 [33] |
China |
Retrospective Cohort |
2008–2012 |
83.5 ± 4.8 |
83.8 ± 6.4 |
61 |
47 |
108 |
|
X. Zhou, et al., 2024 [34] |
China |
Retrospective Cohort |
2012–2018 |
78.00 ± 6.95 |
80.04 ± 6.39 |
52 |
50 |
102 |
Table 2
Newcastle-Ottawa Scale (NOS)
|
Study |
Selection |
ей и |
Outcomes |
Total |
|||||
|
00 ОО CU 4-» 5° я и Й си Ф on w о Ф й о |
ПЙ си 00 О о си о о Ф Ч-ч О ио О о |
Й Й 3 00 й о Ф Ф о |
си ф й й Г-| СП 4-» 4-» Д d> 00 00 О ф ф О й я о |
Й £ ф 2 оо О < о |
Й Ф Ч-ч U о |
§ о < о |
|||
|
C. Cai, et al., 2022 [29] |
+ |
+ |
+ |
– |
+ |
+ |
+ |
+ |
8 |
|
X. Lu, et al., 2023 [30] |
+ |
+ |
+ |
+ |
+ |
+ |
+ |
+ |
9 |
|
H. Saraf, S. Munot, 2018 [31] |
– |
– |
+ |
+ |
+ |
+ |
+ |
+ |
7 |
|
Q.C. Song, et al. 2022 [32] |
– |
+ |
+ |
+ |
+ |
+ |
+ |
+ |
8 |
|
S. Zhou, et al., 2019 [33] |
– |
+ |
+ |
+ |
+ |
+ |
+ |
+ |
8 |
|
X. Zhou, et al., 2024 [34] |
++ |
+ |
+ |
+ |
+ |
+ |
+ |
+ |
10 |
Table 2 represents the results of the New Castle Ottawa Scale. Of all included studies, one study has a score of 7, three studies have a score of 8, one study has a score of 9, and one study has a score of 10. It can be concluded that all studies have high quality studies.
Operative Time
Of the 6 included studies, 5 reported the operative time [29–31, 33–34]. The forest plot analysis found that BHA had statistically significant difference in longer operative time, compared with PFNA (SMD –1.45, 95 % CI –2.49 to –0.42, p = 0.006) A random effects model was used because of the clinical heterogeneity (I2 = 94 %, Fig. 2).
|
Study or Subgroup |
PFNA |
Mean |
BHA SD |
Total |
Std. Mean Difference Weight IV, Random, 95% Cl |
||
|
Mean |
SD |
Total |
|||||
|
Cal 2022 |
54.06 |
5.78 |
34 |
74.89 |
8.18 |
36 |
19.4% -2.89 [-3.57, -2.21] |
|
Lu 2023 |
90.7 |
IB.8 |
36 |
94.1 |
23.6 |
77 |
20.7% -0.15 [-0.55. 0.24] |
|
Saraf 2018 |
40 |
6.09 |
20 |
55 |
9.5 |
20 |
19.1% -1.84 [-2.59. -1.09] |
|
Zhou 2019 |
53.7 |
15.2 |
61 |
77.5 |
16.8 |
47 |
20.6% -1.48 [-1.92, -1.05] |
|
Zhou 2024 |
60 |
12.5 |
52 |
85 |
7.5 |
50 |
20.2% -2.40 [-2.91. -1.88] |
|
Total (95% Cl) |
203 |
230 |
100.0% -1.74 [-2.73, -0.74) |
||||
|
Heterogeneity: Tau1 - |
1.21; Chi1 - 7 2.56. df - 4 (P < 0.00001>; I1 - 94% |
||||||
|
Testfcr overall effect: |
Z - 3.42 (P - |
0.0006) |
|||||
Std. Mean Difference IV, Random, 95% Cl
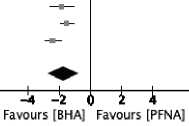
Fig. 2. Comparison of PFNA vs BHA on Operative Time
Intraoperative Blood Loss
All the included studies reported the intraoperative blood loss [29–34]. The forest plot analysis found that BHA statistically significant difference in intraoperative blood loss, compared with PFNA (SMD –2.34, 95 % CI –3.50 to –1.19, p < 0.0001) A random effects model was used because of the clinical heterogeneity (I2 = 96 %, Fig. 3).
|
Study or Subgroup |
Mean |
PFNA |
BHA |
Weight |
Std. Mean Difference IV, Random, 95% Cl |
Std. Mean Difference IV, Random, 95% Cl |
||||
|
SD |
Total |
Mean |
SD |
Total |
||||||
|
QI 2022 Lu 2023 Saraf 2018 Song 2022 Zhou 2019 Zhou 2024 |
168.82 173.1 120 153.33 132.5 100 |
130.77 101.5 29.4 59.96 33.2 37.5 |
34 36 20 32 61 52 |
193.33 322.1 300 335.31 286.3 200 |
142.81 128.1 49.4 90.87 43.2 50 |
36 77 20 30 47 50 |
17.2% 17.3% 14.9% 16.7% 16.7% 17.1% |
-0.18 [-0.65, 0.29] -1.23 [-1.66, -0.80] -4.34 [-5.52, -3.16] -2.35 [-3.01, -1.69] -4.03 [-4.70. -3.37] -2.25 [-2.75, -1.75] |
— |
|
|
—■— — |
||||||||||
|
Total (95% Cl) Heterogeneity: TaiP -Test for overall effect |
235 |
260 100.0% ; P - 96% |
-2.34 [-3.50, -1.19] |
|||||||
|
z - 3.99 (P < 0.0001) |
Favours [BHA] |
i Favours [PFNA] |
||||||||
Fig. 3. Comparison of PFNA vs BHA on Intraoperative Blood Loss
Blood Transfusion
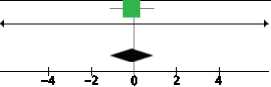
Of the 6 included studies, 2 reported the blood transfusion [29–30]. The forest plot analysis found that there was no statistically significant difference in blood transfusion between two groups (SMD –0.10, 95 % CI –1.11 to 0.90, p = 0.84) and low heterogeneity (I2 = 31 %, Fig. 4).
Mean Difference
PFNA BHA
Mean Difference
IV, Fixed, 95% Cl
Favours [BHA] Favours [PFNA]
Study or Subgroup Mean SD Total Mean SD Total Weight __________ IV, Fixed, 95% Cl
0120 2 2 1.12 1.34 17 1.2 2 1.59 16 100.0% -0.10 [-1.11.0.91]
Lu 2023 716.7 499.7 36 837.7 496.1 77 0.0% -121.00 [-318.29, 76.29]
Total (95% Cl) 53 93 100.0% -0.10 [-1.11,0.90]
Heterogeneity: ChP - 1.44. df - 1 (P - 0.23); P - 31%
Test for overall effect: Z - 0.20 (P - 0.84)
Fig. 4. Comparison of PFNA vs BHA on Blood Transfusion
Hospitalization Time
Of the 6 included studies, 5 reported the hospitalization time [29, 31–34]. The forest plot analysis found no statistically significant difference in hospitalization time between the two groups (SMD –0.16, 95 % CI –0.59 to 0.27, p = 0.47) A random effects model was used because of the clinical heterogeneity (I2 = 76 %, Fig. 5).
|
Study or Subgroup |
PFNA |
Mean |
BHA SD |
Total |
Weight |
Std. Mean Difference IV, Random, 95% Cl |
Std. Mean Difference IV, Random, 95% Cl |
||
|
Mean |
SD |
Total |
|||||||
|
Cal 2022 |
10.91 |
5.61 |
34 |
13.22 |
5.93 |
36 |
20.2% |
-0.40 [-0.87, 0.08] |
----■-- |
|
Saraf 2018 |
4 |
1.19 |
20 |
6 |
2.13 |
20 |
16.1% |
-1.14 [-1.81. -0.46] |
— |
|
Song 2022 |
17.13 |
2.92 |
32 |
16.65 |
3.64 |
30 |
19.7% |
0.14 [-0.35, 0.64] |
— |
|
Zhou 2019 |
7.6 |
1.8 |
61 |
6.9 |
2.2 |
47 |
22.1% |
0.35 [-0.03, 0.73] |
—■— |
|
Zhou 2024 |
10 |
2.75 |
52 |
10 |
2 |
50 |
22.0% |
0.00 [-0.39, 0.39] |
—ii— |
|
Total (95% Cl) |
199 |
183 |
100.0% |
-0.16 [-0.59, 0.27] |
|||||
|
Heterogeneity: Tau1 - |
0.18; Chi1 - 16.89, df - 4 (P - 0.002); I2 |
- 76% |
“3—3— --i— |
||||||
|
Test for overall effect: |
Z - 0.72 (P - |
0.47) |
Favours [BHA] Favours [PFNA] |
||||||
Fig. 5. Comparison of PFNA vs BHA on Hospitalization Time
Weight- Bearing Time
Of the 6 included studies, 3 reported the weight-bearing time [32–34]. The forest plot analysis found statistically significant difference that that PFNA was slower in early weight-bearing time, compared with BHA (SMD 5.16, 95 % CI 1.81 to 8.50, p = 0.003) A random effects model was used because of the clinical heterogeneity (I2 = 98 %, Fig. 6).
|
Study or Subgroup |
PFNA |
Mean |
BHA SD |
Total |
Std. Mean Difference |
Std. Mean Difference IV, Random, 95% Cl |
|||
|
Mean |
SD |
Total |
Weight |
IV, Random, 95% Cl |
|||||
|
Song 2022 |
18.42 |
1.75 |
32 |
11.15 |
1.36 |
30 |
33.3% |
4.56 [3.59, 5.53] |
|
|
Zhou 2019 |
28.2 |
3.7 |
61 |
3.1 |
1.2 |
47 |
32.7% |
8.61 [7.38, 9.84] |
—■— |
|
Zhou 2024 |
6 |
2.25 |
52 |
2 |
0.5 |
50 |
34.0% |
2.41 [1.90, 2.93] |
-■- |
|
Heterogeneity: Tau1 - |
8.51; Chi1 - 87.94, df - 2 {P < 0.00001); I1 - 98% |
tig- |
—3----о----i---й |
||||||
|
Test for overall effect: |
Z - 3.02 (P - |
0.003) |
Favours [BHA] Favours [PFNA] |
||||||
Fig. 6. Comparison of PFNA vs BHA on Weight-Bearing Time
Harris Hip Score at 1 Month Follow Up
Of the 6 included studies, 2 reported Harris Hip Score at 1-month follow-up [31, 34]. The forest plot analysis found that BHA statistically significant difference more superior in Harris Hip Score at 1-month follow-up, compared with PFNA (SMD –3.39, 95 % CI –3.91 to –2.86, p < 0.00001) and no heterogeneity (I2 = 0 %, Fig. 7).
PFNA BHA Std, Mean Difference
Std. Mean Difference IV, Random, 95% Cl
Study or Subgroup Mean SD Total Mean SD Total Weight IV, Random, 95% Cl
|
Saraf 2018 |
52.1 2.05 20 |
61.4 |
3.75 |
20 |
31.4% |
-3.02 [-3.95, -2.08] |
|
Zhou 2024 |
45.69 5.37 52 |
61.92 |
3.45 |
50 |
68.6% |
-3.55 1-4.19,-2.92] |
|
Total (95% Cl) |
72 |
70 |
100.0% |
-3.39 [-3,91, -2.86] |
||
|
Heterogeneity: Tau' |
- 0.00; Chi1 - 0.88, df |
- 1 |
-0.35) |
II1- |
0% |
|
|
Test for overall effect: Z - 12.70 (P < 0.00001) |
||||||
Favours [BHA] Favours [PFNA]
Fig. 7. Comparison of PFNA vs BHA on Harris Hip Score at 1-Month Follow-up
Harris Hip Score at 3 Month Follow Up
Of the 6 included studies, 4 reported Harris Hip Score at 3-month follow-up [29, 31, 32, 34]. The forest plot analysis found that there was statistically significant difference and BHA was more superior in Harris Hip Score at 3-month follow-up, compared with PFNA (SMD –1.80, 95 % CI –2.90 to –0.70, p = 0.001). A random effects model was used because of the clinical heterogeneity (I2 = 93 %, Fig. 8).
|
Study or Subgroup |
PFNA |
Mean |
BHA SD |
Total |
Weight |
Std. Mean Difference IV, Random, 95% Cl |
||
|
Mean |
SD |
Total |
||||||
|
Cal 2022 |
47.35 |
12.7 |
34 |
66.57 |
16.66 |
36 |
25.6% |
-1.28 [-1.80, -0.76] |
|
Saraf 2018 |
64.05 |
2.61 |
20 |
70.2 |
2.14 |
20 |
23.4% |
-2.53 [-3.38, -1.67] |
|
Song 2022 |
68.91 |
8.15 |
32 |
73.2 |
6.56 |
30 |
25.7% |
-0.57 [-1.08, -0.06] |
|
Zhou 2024 |
61.83 |
5.9 |
52 |
76.94 |
4.26 |
50 |
25.4% |
-2.91 [-3.47, -2.34] |
|
Total (95% Cl) |
138 |
136 |
100.0% |
-1.80 [-2.90, -0.70] |
||||
Heterogeneity: lai/ - 1.17; Ch? - 42.45, df - 3 (P < 0.00001); I* - 93%
Test for overall effect: z - 3.20 (P - 0.001)
Std. Mean Difference IV, Random, 95% Cl
