Public Opinion Monitoring of the State of the Russian Society

Author: Kosygina K.E., Bakhvalova I.M.
Journal: Economic and Social Changes: Facts, Trends, Forecast @volnc-esc-en
Section: Monitoring studies
Article in issue: 5 т.18, 2025.
Free access
Short address: https://sciup.org/147252473
IDR: 147252473 | DOI: 10.15838/esc.2025.5.101.15
Text of the article Public Opinion Monitoring of the State of the Russian Society
Source: VCIOM. Available at:
Source: Levada-Center*. Available at:
In your opinion, how successful is the RF President in handling challenging issues? (% of respondents; VolRC RAS data)
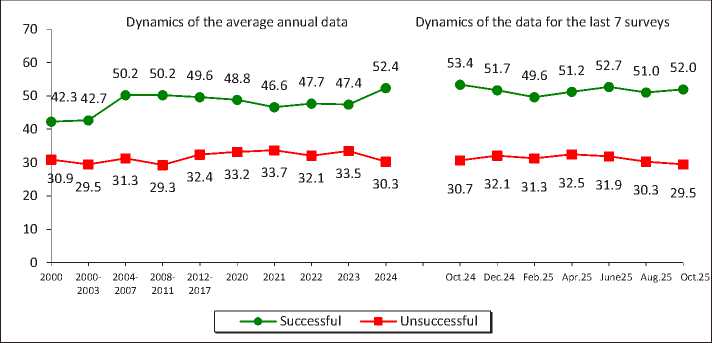
Over the past two months, the proportion of people who consider the Russian President’s actions to strengthen Russia’s international position to be successful has remained stable at 52%. For comparison, the proportion of those who adhere to the opposite point of view is significantly less and amounts to 29–30%.
From October 2024 to October 2025, the shares of both positive and negative assessments of the RF President’s work to strengthen Russia’s international position did not change.
Strengthening Russia’s international position
|
Response |
Dynamics (+/-), Oct .2025 to |
|
|
Oct. 2024 |
Aug. 2025 |
|
|
Successful |
-1 |
+1 |
|
Unsuccessful |
-1 |
-1 |
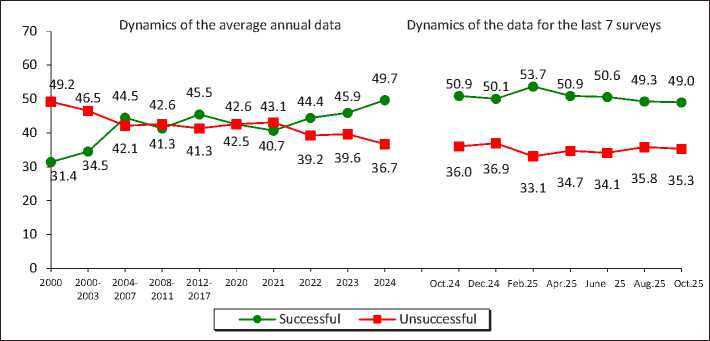
In August – October 2025, the share of residents of the region who positively assessed the work of the head of state to restore order in the country was 49%.
Over the past 12 months (from October 2024 to October 2025), the estimates of the population have remained unchanged: the share of positive judgments is 49–51%, negative – 35–36%.
Imposing order in the country
|
Response |
Dynamics (+/-), Oct .2025 to |
|
|
Oct. 2024 |
Aug. 2025 |
|
|
Successful |
-2 |
0 |
|
Unsuccessful |
-1 |
-1 |
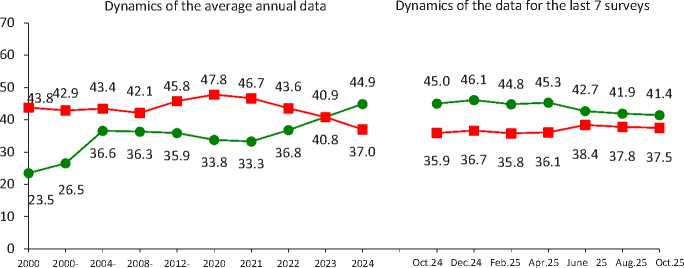
In August – October 2025, the share of positive assessments of the activities of the President of the Russian Federation to protect democracy and strengthen the freedoms of citizens amounted to 41–42%, the proportion of negative ones was 38%.
From October 2024 to October 2025, the proportion of positive judgments decreased by 4 percentage points, from 45 to 41%. The proportion of negative judgments did not change.
Protecting democracy and strengthening citizens’ freedoms
2003 2007 2011 2017
—•— Successful — ■ — Unsuccessful
|
Response |
Dynamics (+/-), Oct .2025 to |
|
|
Oct. 2024 |
Aug. 2025 |
|
|
Successful |
-4 |
-1 |
|
Unsuccessful |
+2 |
0 |
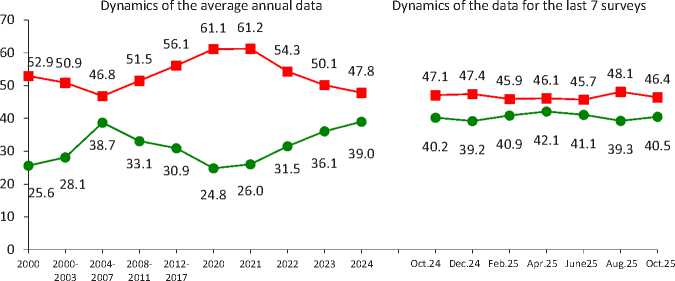
The share of positive opinions about the activities of the head of state to boost the economy and increase the welfare of citizens remains stable from August to October 2025 (39–40%). The proportion of negative assessments is still high and remains at the level of 46–48%.
Over the past 12 months, there were no significant changes in the judgments regarding the work of the head of state to protect democracy and strengthen citizens’ freedoms.
Economic recovery, increase in citizens’ welfare
—•— Successful — ■ — Unsuccessful
|
Response |
Dynamics (+/-), Oct .2025 to |
|
|
Oct. 2024 |
Aug. 2025 |
|
|
Successful |
0 |
+1 |
|
Unsuccessful |
-1 |
-2 |
Over the past two months, no significant changes were recorded in the structure of political preferences of the region’s residents: in August – October 2025, the share of people whose interests are expressed by the United Russia Party was 41%, the Communist Party of the Russian Federation – 10–12%, the Liberal Democratic Party – 7–9%, Just Russia – 3–4%, New People – 1–2%.
From October 2024 to October 2025, the political preferences of the residents of the region remained unchanged. The share of people who believe that none of the parties represented in Parliament reflects their interests is 23–24%.
Which party expresses your interests? (% of respondents; VolRC RAS data)
|
Party |
Dynamics of the average annual data |
Dynamics of the data for the last 7 surveys |
Dynamics (+/-), Oct. 2025 to |
|||||||||||||||||||
|
g |
§ |
co 03 E О CD CO CO ОС CD Ji? |
§ |
CD |
CO CD CO E o CD CO CO DC CD |
co |
CM |
co CO E О CD CO CO DC CD Ji? |
я |
о |
CD О |
C\J u_ |
lo |
lo CD ~Э |
LO |
LO О |
О |
|||||
|
United Russia |
18.5 |
31.1 |
33.4 |
29.1 |
35.4 |
38.0 |
37.9 |
31.5 |
49.8 |
31.7 |
35.2 |
39.5 |
42.9 |
41.8 |
42.3 |
39.9 |
40.5 |
41.6 |
41.2 |
40.5 |
-1 |
-1 |
|
CPRF |
11.5 |
10.3 |
16.8 |
10.6 |
8.3 |
14.2 |
9.2 |
8.4 |
18.9 |
9.3 |
10.1 |
9.6 |
8.9 |
8.7 |
9.1 |
8.8 |
8.0 |
9.1 |
11.5 |
10.5 |
+2 |
-1 |
|
LDPR |
4.8 |
7.8 |
15.4 |
7.8 |
10.4 |
21.9 |
9.6 |
9.5 |
7.6 |
9.9 |
7.3 |
7.0 |
7.1 |
7.5 |
8.8 |
7.5 |
7.1 |
9.4 |
8.7 |
7.8 |
0 |
-1 |
|
Just Russia – Patriots for the Truth |
– |
5.6 |
27.2 |
6.6 |
4.2 |
10.8 |
2.9 |
4.7 |
7.5 |
4.7 |
4.9 |
4.4 |
3.5 |
4.2 |
4.4 |
2.3 |
2.9 |
3.9 |
4.2 |
3.4 |
-1 |
-1 |
|
New People* |
– |
– |
– |
– |
– |
– |
– |
– |
5.3 |
2.3 |
1.5 |
1.9 |
2.0 |
2.3 |
2.3 |
3.1 |
3.0 |
2.5 |
1.8 |
2.2 |
0 |
0 |
|
Other |
0.9 |
1.9 |
– |
2.1 |
0.3 |
– |
0.7 |
0.5 |
– |
0.2 |
0.3 |
0.1 |
0.2 |
0.3 |
0.3 |
0.3 |
0.0 |
0.1 |
0.1 |
0.1 |
0 |
0 |
|
None |
29.6 |
29.4 |
– |
31.3 |
29.4 |
– |
28.5 |
34.2 |
– |
33.9 |
30.6 |
26.5 |
25.2 |
24.1 |
26.3 |
28.4 |
27.7 |
24.9 |
23.3 |
24.3 |
0 |
+1 |
|
Difficult to answer |
20.3 |
13.2 |
– |
11.7 |
12.0 |
– |
11.2 |
11.1 |
– |
10.0 |
10.1 |
11.1 |
10.3 |
11.0 |
6.5 |
9.7 |
10.8 |
8.5 |
9.2 |
11.3 |
0 |
+2 |
* The New People party was elected to the State Duma of the Russian Federation for the first time following the results of the election held on September 17–19, 2021.
From August to October 2025, the share of positive assessments of social mood remained at the level of 71–73%. The proportion of people experiencing predominantly negative emotions also remained unchanged at 23–24%.
During the year (from October 2024 to October 2025), the proportion of people who describe their daily emotional state as «normal, fine» did not change (70–71%). The proportion of those who more often experience «tension, irritation, fear, sadness» remains stable (24–26%).
Estimation of social condition (% of respondents; VolRC RAS data)
Social mood
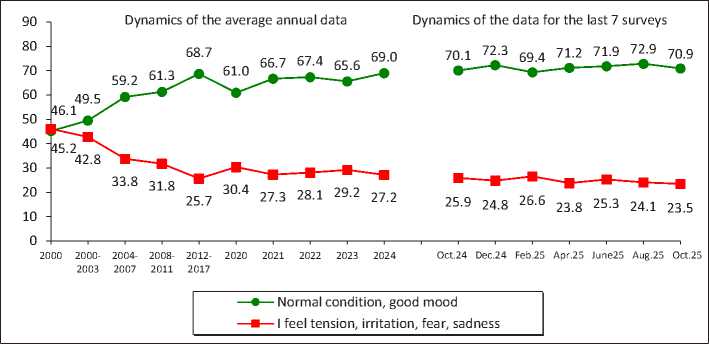
|
Response |
Dynamics (+/-), Oct .2025 to |
|
|
Oct. 2024 |
Aug. 2025 |
|
|
Normal condition, good mood |
+1 |
-2 |
|
I feel tension, irritation, fear, sadness |
-2 |
-1 |
From August to October 2025, the share of positive assessments of the stock of patience increased: the proportion of people who note that “everything is not so bad and life is livable; life is hard, but we can endure it” increased by 4 percentage points (from 80 to 84%). The share of those who believe that it is “no longer possible” to bear their plight was 12–13%.
Over the past 12 months (from October 2024 to October 2025), the stock of patience has also increased by 4 percentage points, from 80 to 84%.
Stock of patience
Dynamics of the average annual data
Dynamics of the data for the last 7 surveys
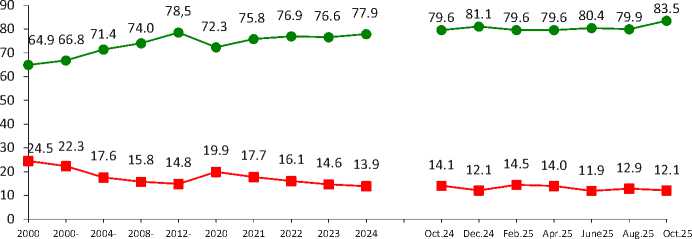
2003 2007 2011 2017
—•— Everything is not so bad and life is livable; life is hard, but we can endure it
— ■ — It’s impossible to bear such plight
|
Response |
Dynamics (+/-), Oct .2025 to |
|
|
Oct. 2024 |
Aug. 2025 |
|
|
Everything is not so bad and life is livable; life is hard, but we can endure it |
+4 |
+4 |
|
It’s impossible to bear such plight |
-2 |
-1 |
In August – October 2025, the proportion of residents of the region subjectively classifying themselves as “poor and extremely poor” amounted to 41–43%. The proportion of those who subjectively classify themselves as “middle-income people” was 44–45%.
During the year of observations, the indicators of social self-identification did not change significantly.
Social self-identification*
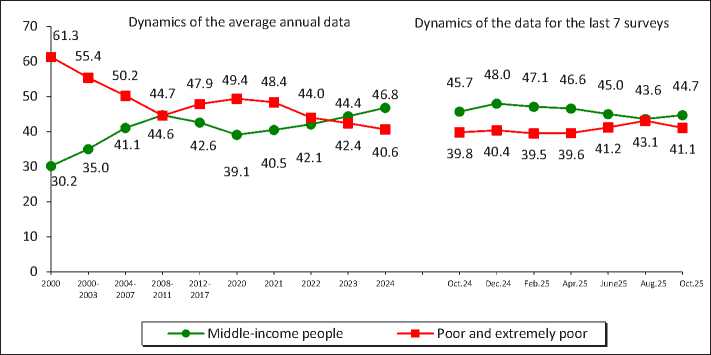
* Wording of the question: “What category do you belong to, in your opinion?”
|
Response |
Dynamics (+/-), Oct .2025 to |
|
|
Oct. 2024 |
Aug. 2025 |
|
|
Middle-income people |
-1 |
+1 |
|
Poor and extremely poor |
+1 |
-2 |
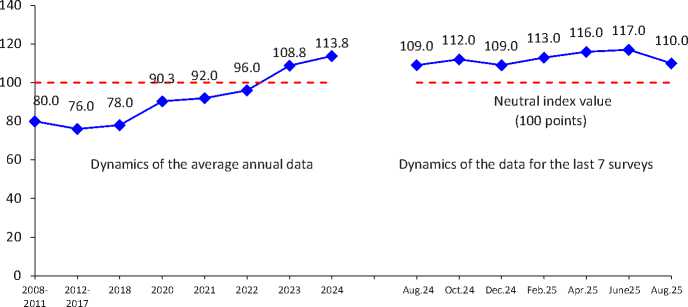
The value of the CSI in October 2025 remained at the level of August 2025 – 86–87 points.
In October 2025, the value of the CSI corresponds to the data of October 2024.
Consumer Sentiment Index
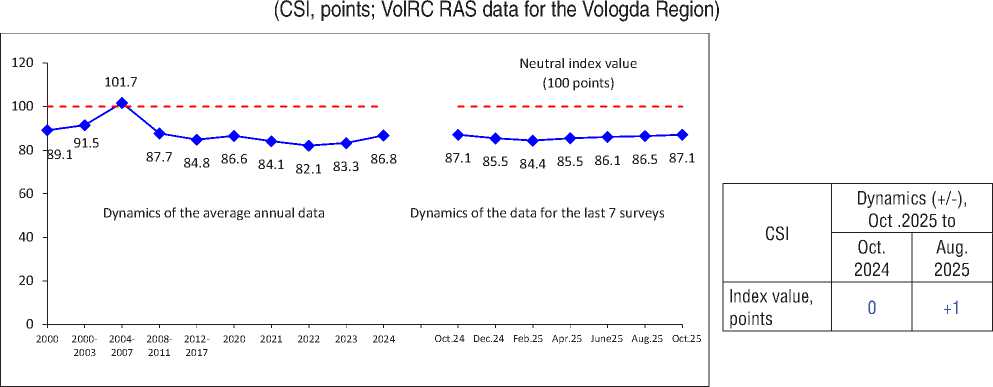
|
CSI |
Dynamics (+/-), Aug. 2025 to |
|
|
Aug. 2024 |
June 2025 |
|
|
Index value, points |
+1 |
-7 |
The index is calculated since 2008.
The latest data – as of August 2025.
Source: Levada-Center*. Available at:
During the period from August to October 2025, there were no significant changes in the dynamics of the share of positive assessments of social mood in most of the main socio-demographic groups. There is a decrease in the proportion of people who positively characterize their daily emotional state in only two categories: among men (from 72 to 68%) and in the group of the least affluent (from 56 to 53%).
Over the past 12 months, the share of positive assessments of social mood has increased in 5 of the 14 main socio-demographic groups, especially among those with secondary education (by 6 percentage points); the most affluent residents (by 6 percentage points); residents of Vologda (by 4 percentage points) and Cherepovets (by 3 percentage points); in the age group of 30–55 years (by 4 percentage points). A slight deterioration in grades is recorded among people with secondary vocational education (by 4 percentage points). There are no significant changes in other socio-demographic groups.
Social mood in different social groups (response: “Wonderful mood, normal, stable condition”, % of respondents; VolRC RAS data)
|
Population group |
Dynamics of the average annual data |
Dynamics of the data for the last 7 surveys |
Dynamics (+/-), Oct. 2025 to |
|||||||||||||||
|
2000 |
2007 |
2012 |
2018 |
2020 |
2021 |
2022 |
2023 |
2024 |
Oct. 2024 |
Dec. 2024 |
Feb. 2025 |
Apr. 2025 |
June 2025 |
Aug. 2025 |
Oct. 2025 |
Oct. 2024 |
Aug. 2025 |
|
|
Gender |
||||||||||||||||||
|
Men |
50.1 |
65.9 |
69.1 |
72.8 |
60.8 |
65.7 |
66.8 |
65.5 |
66.5 |
65.2 |
69.2 |
70.1 |
68.8 |
71.6 |
72.1 |
68.2 |
+3 |
-4 |
|
Women |
43.3 |
61.7 |
65.8 |
69.8 |
61.2 |
67.4 |
67.9 |
65.7 |
70.9 |
74.0 |
74.7 |
68.8 |
73.1 |
72.2 |
73.5 |
73.1 |
-1 |
0 |
|
Age |
||||||||||||||||||
|
Under 30 |
59.1 |
71.3 |
72.3 |
79.9 |
67.6 |
73.5 |
77.6 |
75.0 |
76.6 |
78.0 |
81.3 |
79.9 |
76.7 |
76.7 |
78.1 |
75.2 |
-3 |
-3 |
|
30–55 |
44.2 |
64.8 |
67.9 |
72.6 |
61.8 |
69.5 |
69.4 |
68.8 |
71.3 |
69.8 |
73.2 |
70.2 |
74.1 |
74.1 |
74.9 |
73.9 |
+4 |
-1 |
|
Over 55 |
37.4 |
54.8 |
62.1 |
65.2 |
57.4 |
60.5 |
61.1 |
58.2 |
63.3 |
67.4 |
67.8 |
64.6 |
65.8 |
67.6 |
68.6 |
65.9 |
-2 |
-3 |
|
Education |
||||||||||||||||||
|
Secondary and incomplete secondary |
41.7 |
58.4 |
57.2 |
64.8 |
56.1 |
62.1 |
64.6 |
62.0 |
64.6 |
62.5 |
65.5 |
64.6 |
65.6 |
68.4 |
70.3 |
68.4 |
+6 |
-2 |
|
Secondary vocational |
46.4 |
64.6 |
66.7 |
72.1 |
63.5 |
66.7 |
68.3 |
66.1 |
70.3 |
75.2 |
76.5 |
71.8 |
74.8 |
74.1 |
73.6 |
71.4 |
-4 |
-2 |
|
Higher and incomplete higher |
53.3 |
68.6 |
77.0 |
76.7 |
63.3 |
71.5 |
69.5 |
68.8 |
72.3 |
72.3 |
74.2 |
71.4 |
73.4 |
73.0 |
74.7 |
73.1 |
+1 |
-2 |
|
Income group |
||||||||||||||||||
|
Bottom 20% |
28.4 |
51.6 |
51.5 |
57.2 |
43.4 |
54.6 |
57.0 |
50.1 |
53.5 |
54.8 |
55.7 |
55.9 |
56.9 |
56.1 |
58.3 |
53.3 |
-2 |
-5 |
|
Middle 60% |
45.5 |
62.9 |
68.7 |
72.1 |
62.6 |
67.3 |
68.1 |
67.4 |
70.7 |
73.6 |
74.2 |
70.5 |
72.6 |
74.4 |
73.1 |
73.1 |
-1 |
0 |
|
Top 20% |
64.6 |
74.9 |
81.1 |
82.4 |
75.6 |
79.9 |
78.3 |
73.9 |
77.6 |
78.4 |
80.6 |
77.9 |
81.3 |
84.1 |
83.8 |
84.8 |
+6 |
+1 |
|
Territory |
||||||||||||||||||
|
Vologda |
49.2 |
63.1 |
73.6 |
71.0 |
60.9 |
60.3 |
59.8 |
59.6 |
66.0 |
67.9 |
69.6 |
66.7 |
68.6 |
69.5 |
72.9 |
71.4 |
+4 |
-2 |
|
Cherepovets |
50.8 |
68.1 |
76.2 |
75.7 |
60.4 |
71.0 |
71.2 |
68.1 |
69.8 |
70.7 |
73.0 |
69.9 |
71.5 |
72.5 |
75.0 |
73.2 |
+3 |
-2 |
|
Districts |
42.2 |
61.6 |
59.8 |
68.6 |
61.4 |
67.8 |
69.5 |
67.7 |
70.2 |
71.0 |
73.4 |
70.7 |
72.7 |
73.1 |
71.6 |
69.3 |
-2 |
-2 |
|
Region |
46.2 |
63.6 |
67.3 |
71.2 |
61.0 |
66.6 |
67.4 |
65.6 |
69.0 |
70.1 |
72.3 |
69.4 |
71.2 |
71.9 |
72.9 |
70.9 |
+1 |
-2 |
|
Total number of groups: positive changes / no changes / negative changes |
14: 5 / 8 / 1 |
14: 0 / 12 / 2 |
||||||||||||||||
RESUME
As the results of the next round of monitoring showed, there were no significant changes in the dynamics of most indicators of public sentiment:
-
– a high level of approval of the activities of the federal government remains: the President of the Russian Federation – 66–67%, the Chairman of the Government of the Russian Federation – 55%;
-
– at the same time, there is still a differentiation of assessments in certain areas of the head of state ‘s activities: the strengthening of international positions is more highly appreciated than the economic recovery and the growth of the welfare of citizens;
-
– there are no significant fluctuations in the structure of political preferences of citizens, the leading position is occupied by the United Russia Party;
-
– the positive background of social well-being also remains: the proportion of respondents who rate their emotional state as “normal” or “fine” remains at the level of 70–73%;
-
– at the same time, the vast majority of the population (84%) retains a high stock of patience and considers life’s difficulties to be bearable. We emphasize that the trend toward strengthening this indicator is observed both in the short term and in the annual dynamics.
In our opinion, it is important to note that against the background of the general stability of public opinion assessments on the main monitoring indicators, there is a positive trend regarding people’s forecasts about their future. This is indicated by the growth dynamics of the Consumer Sentiment Index (CSI). It is barely noticeable (from February to October – from 84 to 87 points), but it is fixed throughout virtually the entire year 2025.
Among the negative changes, a decrease in positive assessments of social mood among men and the least affluent (according to their own self-assessments) citizens should be highlighted. Such dynamics require close attention, especially due to the fact that in the medium term, with the onset of the autumn-winter period, seasonal factors may put pressure on social well-being: from worsening climatic conditions to higher housing and communal services tariffs, which can have a significant negative impact on assessments, primarily (but not only) socially vulnerable population groups.
Prepared by K.E. Kosygina and I.M. Bakhvalova
Volume 18, Issue 5, 2025
Economic and Social Changes: Facts, Trends, Forecast
