
Public Opinion Monitoring of the State of the Russian Society
Journal: Economic and Social Changes: Facts, Trends, Forecast @volnc-esc-en
Section: Monitoring studies
Article in issue: 3 т.19, 2026.
Free access
Short address: https://sciup.org/147254773
IDS: 147254773 | DOI: 10.15838/esc.2026.3.105.14
Text of the article Public Opinion Monitoring of the State of the Russian Society
Source: VCIOM. Available at:
Source: Levada-Center*. Available at:
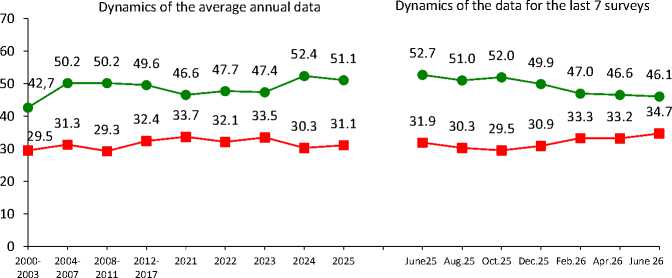
In your opinion, how successful is the RF President in handling challenging issues? (% of respondents; VolRC RAS data)
Public assessment of the President’s success in strengthening Russia’s international standing has remained stable since February 2026: the share of positive judgments stands at 46–47%, negative at 33–35%.
Over the past 12 months, the share of positive judgments has decreased by 7 percentage points (from 53 to 46%), while the share of negative judgments has risen by 3 percentage points (from 32 to 35%).
Strengthening Russia’s international standing
—•— Successful — ■ — Unsuccessful
|
Response |
Dynamics (+/-), June 2026 to |
|
|
June 2025 |
Apr. 2026 |
|
|
Successful |
-7 |
-1 |
|
Unsuccessful |
+3 |
+2 |
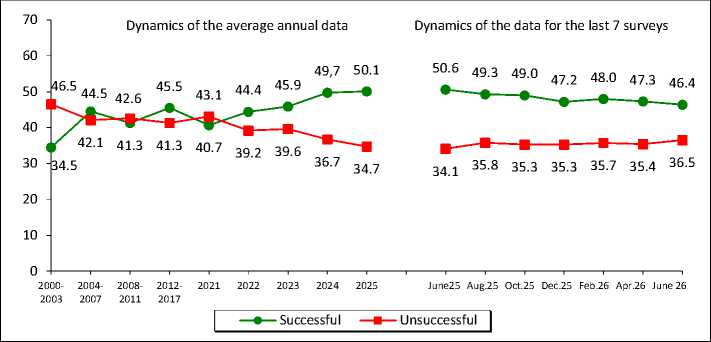
The share of regional residents who consider the head of state’s efforts to restore order in the country successful stands at 46–47%, as it did two months ago; the proportion of those holding the opposite view is somewhat lower, at 35–36%.
At the same time, a year-on-year comparison also reveals negative changes: compared with June 2025, the share of positive assessments has declined by 5 percentage points (from 51% to 46%), while negative assessments have risen by 3 percentage points (from 34 to 37%).
Restoring order in the country
|
Response |
Dynamics (+/-), June 2026 to |
|
|
June 2025 |
Apr. 2026 |
|
|
Successful |
-5 |
-1 |
|
Unsuccessful |
+3 |
+1 |
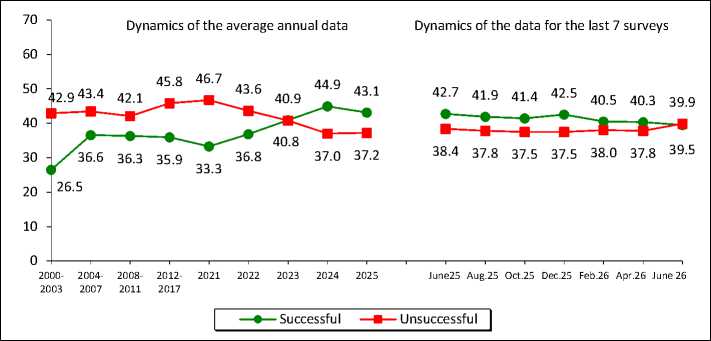
The share of positive judgments about the head of state’s success in protecting democracy and strengthening civil liberties also remains stable (40–41%), while the share of negative assessments has increased slightly over the past two months (by 2 percentage points, from 38 to 40%).
Over the year of measurements, no substantial changes are observed on this issue: positive assessments range from 40 to 43%, negative from 38 to 40%.
Protecting democracy and strengthening civil liberties
|
Response |
Dynamics (+/-), June 2026 to |
|
|
June 2025 |
Apr. 2026 |
|
|
Successful |
-3 |
-1 |
|
Unsuccessful |
+2 |
+2 |
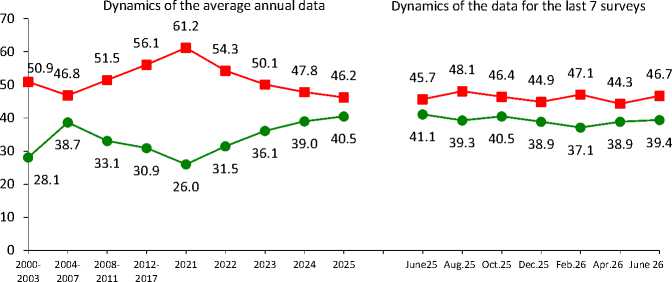
In June 2026, the share of regional residents who negatively assess the head of state’s efforts to boost the economy and improve citizens’ well-being increased slightly (by 3 percentage points, from 44 to 47%). At the same time, the share of positive assessments did not change significantly (39%).
From June 2025 to June 2026, public opinion in the region on this issue did not change significantly: the share of positive judgments stands at 39–41%, negative at 46–47%.
Boosting the economy and improving citizens’ well-being
—•— Successful ■ Unsuccessful
|
Response |
Dynamics (+/-), June 2026 to |
|
|
June 2025 |
Apr. 2026 |
|
|
Successful |
-2 |
+1 |
|
Unsuccessful |
+1 |
+2 |
The structure of citizens’ electoral preferences has remained stable since the beginning of the year: the share of regional residents supporting the United Russia party stands at 37%, the Communist Party of the Russian Federation (CPRF) and the Liberal Democratic Party of Russia (LDPR) at 8–9% each, and the Just Russia and New People at 3–4% each.
Over the past 12 months, support for United Russia has declined slightly (by 5 percentage points, from 42 to 37%), while the share of people who believe that none of the parliamentary parties currently reflects their interests has increased (by 6 percentage points, from 25 to 31%).
Which party expresses your interests? (% of respondents; VolRC RAS data)
|
Party |
Dynamics of the average annual data |
Dynamics of the data for the last 7 surveys |
Dynamics (+/-), June 2026 to |
|||||||||||||||||||
|
оз E о CD CO CO о u_ DC CD OP |
CD |
оз E о CD CD CO о u_ ОС O ° CD |
CO |
CM |
03 E О CD CD CO о 11 co ОС Is CD |
a |
CD ~Э |
О |
CD О |
CD u_ |
CD |
CD CD ~Э |
CD ~Э |
CD |
||||||||
|
United Russia |
31.1 |
33.4 |
29.1 |
35.4 |
38.0 |
37.9 |
31.5 |
49.8 |
31.7 |
35.2 |
39.5 |
42.9 |
40.3 |
41.6 |
41.2 |
40.5 |
38.1 |
36.1 |
35.7 |
36.8 |
-5 |
+1 |
|
CPRF |
10.3 |
16.8 |
10.6 |
8.3 |
14.2 |
9.2 |
8.4 |
18.9 |
9.3 |
10.1 |
9.6 |
8.9 |
9.6 |
9.1 |
11.5 |
10.5 |
9.7 |
9.2 |
8.1 |
8.9 |
0 |
+1 |
|
LDPR |
7.8 |
15.4 |
7.8 |
10.4 |
21.9 |
9.6 |
9.5 |
7.6 |
9.9 |
7.3 |
7.0 |
7.1 |
8.2 |
9.4 |
8.7 |
7.8 |
8.6 |
8.9 |
7.9 |
7.6 |
-2 |
0 |
|
Just Russia – Patriots for the Truth |
5.6 |
27.2 |
6.6 |
4.2 |
10.8 |
2.9 |
4.7 |
7.5 |
4.7 |
4.9 |
4.4 |
3.5 |
3.5 |
3.9 |
4.2 |
3.4 |
4.1 |
3.1 |
4.3 |
3.7 |
0 |
-1 |
|
New People* |
– |
– |
– |
– |
– |
– |
– |
5.3 |
2.3 |
1.5 |
1.9 |
2.0 |
2.5 |
2.5 |
1.8 |
2.2 |
2.5 |
2.4 |
2.3 |
2.6 |
0 |
0 |
|
Other |
1.9 |
– |
2.1 |
0.3 |
– |
0.7 |
0.5 |
– |
0.2 |
0.3 |
0.1 |
0.2 |
0.1 |
0.1 |
0.1 |
0.1 |
0.2 |
0.2 |
0.2 |
0.2 |
0 |
0 |
|
None |
29.4 |
– |
31.3 |
29.4 |
– |
28.5 |
34.2 |
– |
33.9 |
30.6 |
26.5 |
25.2 |
25.8 |
24.9 |
23.3 |
24.3 |
26.1 |
29.1 |
31.5 |
30.5 |
+6 |
-1 |
|
Difficult to answer |
13.2 |
– |
11.7 |
12.0 |
– |
11.2 |
11.1 |
– |
10.0 |
10.1 |
11.1 |
10.3 |
10.0 |
8.5 |
9.2 |
11.3 |
10.7 |
11.0 |
9.8 |
9.7 |
+1 |
0 |
* The New People party first won a seat in the State Duma of the Russian Federation following the elections held on September 17–19, 2021.
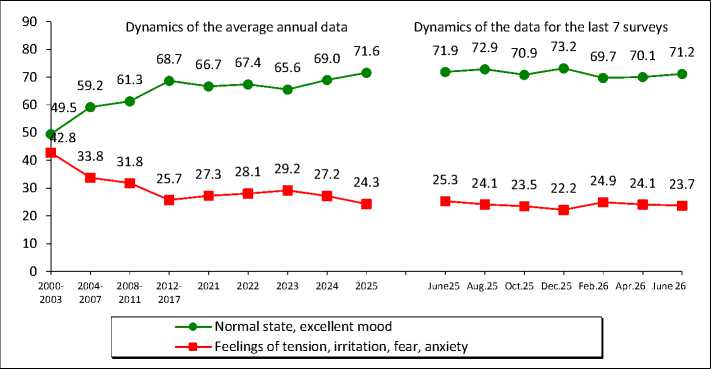
Assessment of social condition (% of respondents; VolRC RAS data)
In April–June 2026, the share of regional residents who positively assess their day-to-day emotional state stood at 70–71%, which is considerably higher than the share of negative assessments (24%).
In a year-on-year comparison, no substantial changes are observed in the dynamics of the social mood of the region’s residents either.
Social mood
|
Response |
Dynamics (+/-), June 2026 to |
|
|
June 2025 |
Apr. 2026 |
|
|
Normal state, excellent mood |
-1 |
+1 |
|
Feelings of tension, irritation, fear, anxiety |
-2 |
0 |
In June 2026, the share of people with a high social “patience reserve” increased slightly (from 81 to 83%), while the proportion of those who believe that “it is no longer possible to endure our desperate situation” remains at 11–12%.
Similar changes have been observed over the past 12 months: the share of people who say that “Things are not so bad, and it is possible to live; life is hard but bearable” rose by 3 percentage points (from 80 to 83%); the share of negative assessments remains stable at 11–12%.
Reserve of patience
|
100 90 80 70 |
66.871.4 |
Dynamics of the average annual data Dynamics of the data for the last 74.0 78.5 75.8 76.9 76.6 77.9 81.1 80.4 79.9 83.5 83.4 81.1 |
7 surveys 80.6 82.5 |
|
60 50 40 30 20 10 0 |
22.3 17.6 |
15.8 14.8 17.7 16.1 14.6 13.9 12.6 11.9 12.9 12.1 10.1 11.9 * ■ * 1 ■ — ■ ■ — ■ — ■ —a— ■ - |
11.6 10.5 |
|
20 20 |
00- 2004 03 2007 |
2008- 2012- 2021 2022 2023 2024 2025 June25 Aug.25 Oct.25 Dec.25 Feb.26 Apr.26 June 26 2011 2017 |
|
|
—•— Things are not so bad, and it is possible to live; life is hard but bearable — ■ — It is no longer possible to endure our desperate situation |
|||
|
Response |
Dynamics (+/-), June 2026 to |
|
|
June 2025 |
Apr. 2026 |
|
|
Things are not so bad, and it is possible to live; life is hard but bearable |
+2 |
+2 |
|
It is no longer possible to endure our desperate situation |
-1 |
-1 |
Negative changes are observed in the dynamics of social self-identification. In April–June 2026, the share of regional residents who subjectively place themselves in the “middle-income” category declined by 3 percentage points (from 47 to 44%), while the share of those who identify with the “poor and destitute” strata increased by 4 percentage points (from 37 to 41%).
Compared with June 2025, no significant changes are observed in the dynamics of the population’s social self-identification.
Social self-identification
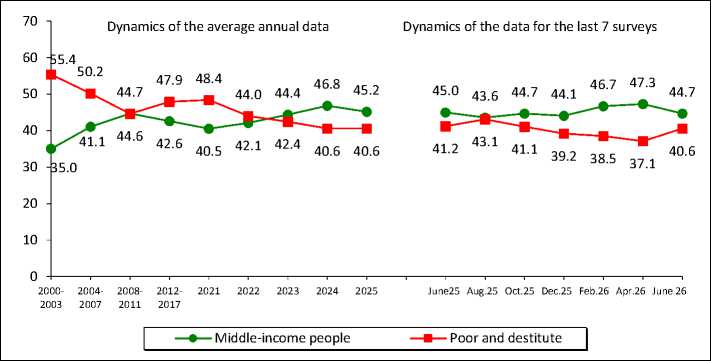
Question wording: “Which category do you belong to, in your opinion?”.
|
Response |
Dynamics (+/-), June 2026 to |
|
|
June 2025 |
Apr. 2026 |
|
|
Share of those considering themselves middle-income |
0 |
-3 |
|
Share of those considering themselves poor and destitute |
-1 |
+4 |
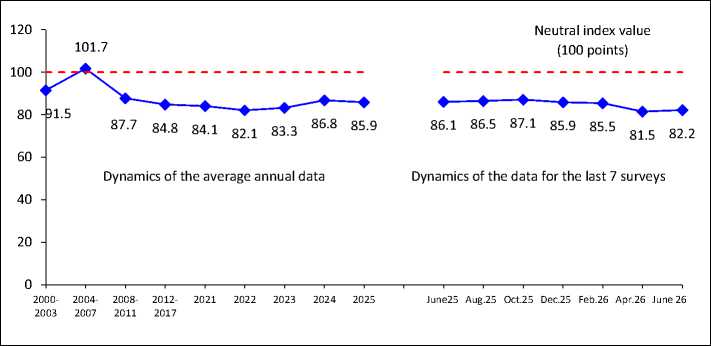
The Consumer Sentiment Index (CSI) stabilized in June 2026 at 82 points after a noticeable decline in February–April 2026 (from 86 to 82 points).
Nevertheless, its latest value remains markedly lower than 12 months ago (86 points).
Consumer Sentiment Index (CSI, points; VolRC RAS data for the Vologda Region)
|
Response |
Dynamics (+/-), June 2026 to |
|
|
June 2025 |
Apr. 2026 |
|
|
Index value, points |
-4 |
+1 |
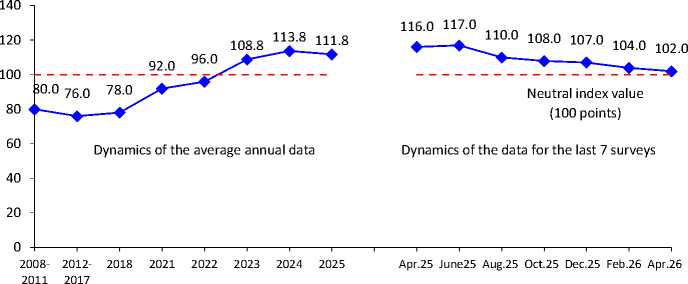
According to nationwide polls by Levada-Center*, the consumer sentiment index in the country has been declining since August 2025. In February–April 2026, it decreased by 2 points (from 104 to 102 points).
Compared with June 2025, the CSI fell by 15 points (from 117 to 102 points).
Consumer Sentiment Index (CSI, points; Levada-Center* data for Russia 5 )
|
Response |
Dynamics (+/-), Apr. 2026 to |
|
|
Apr. 2025 |
Feb. 2026 |
|
|
Index value, points |
-14 |
-2 |
The index has been calculated since 2008.
The latest data – for April 2026.
Source: Levada Center* data. Available at:
From April to June 2026, no significant changes in the share of positive assessments of social mood are observed in most socio-demographic groups, with two exceptions: among people with secondary and incomplete secondary education, the share of positive assessments increased by 5 percentage points; and in the bottom 20% income group, it rose by 4 percentage points. No negative changes are recorded.
From June 2025 to June 2026, no changes are observed in the socio-demographic groups. The only group with identified negative changes is young people under 30 (a decline in the share of positive assessments by 11 percentage points).
Social mood in various social groups (response option “Excellent mood, normal, steady state”, % of respondents; VolRC RAS data)
|
Population group |
Dynamics of the average annual data |
Dynamics of the data for the last 7 surveys |
Dynamics (+/-), June 2026 to |
||||||||||||||
|
2007 |
2012 |
2018 |
2021 |
2022 |
2023 |
2024 |
2025 |
June 2025 |
Aug. 2025 |
Oct. 2025 |
Dec. 2025 |
Feb. 2026 |
Apr. 2026 |
June 2026 |
June 2025 |
Apr. 2026 |
|
|
Gender |
|||||||||||||||||
|
Men |
65.9 |
69.1 |
72.8 |
65.7 |
66.8 |
65.5 |
66.5 |
70.7 |
71.6 |
72.1 |
68.2 |
73.3 |
69.1 |
71.9 |
70.7 |
-1 |
-1 |
|
Women |
61.7 |
65.8 |
69.8 |
67.4 |
67.9 |
65.7 |
70.9 |
72.3 |
72.2 |
73.5 |
73.1 |
73.1 |
70.1 |
68.7 |
71.6 |
-1 |
+3 |
|
Age |
|||||||||||||||||
|
Under 30 |
71.3 |
72.3 |
79.9 |
73.5 |
77.6 |
75.0 |
76.6 |
76.8 |
76.7 |
78.1 |
75.2 |
74.3 |
69.5 |
67.6 |
66.2 |
-11 |
-1 |
|
30–55 |
64.8 |
67.9 |
72.6 |
69.5 |
69.4 |
68.8 |
71.3 |
74.3 |
74.1 |
74.9 |
73.9 |
78.4 |
73.6 |
73.1 |
73.5 |
-1 |
0 |
|
Over 55 |
54.8 |
62.1 |
65.2 |
60.5 |
61.1 |
58.2 |
63.3 |
66.5 |
67.6 |
68.6 |
65.9 |
66.6 |
64.9 |
67.5 |
70.2 |
+3 |
+3 |
|
Education |
|||||||||||||||||
|
Secondary and incomplete secondary |
58.4 |
57.2 |
64.8 |
62.1 |
64.6 |
62.0 |
64.6 |
67.2 |
68.4 |
70.3 |
68.4 |
66.1 |
60.6 |
60.4 |
65.0 |
-3 |
+5 |
|
Secondary vocational |
64.6 |
66.7 |
72.1 |
66.7 |
68.3 |
66.1 |
70.3 |
73.6 |
74.1 |
73.6 |
71.4 |
75.6 |
71.6 |
74.7 |
73.4 |
-1 |
-1 |
|
Higher and incomplete higher |
68.6 |
77.0 |
76.7 |
71.5 |
69.5 |
68.8 |
72.3 |
73.9 |
73.0 |
74.7 |
73.1 |
77.6 |
74.7 |
74.0 |
75.5 |
+3 |
+2 |
|
Income group |
|||||||||||||||||
|
Bottom 20% |
51.6 |
51.5 |
57.2 |
54.6 |
57.0 |
50.1 |
53.5 |
55.2 |
56.1 |
58.3 |
53.3 |
50.7 |
48.2 |
51.3 |
55.6 |
-1 |
+4 |
|
Middle 60% |
62.9 |
68.7 |
72.1 |
67.3 |
68.1 |
67.4 |
70.7 |
73.2 |
74.4 |
73.1 |
73.1 |
75.2 |
72.2 |
72.7 |
72.0 |
-2 |
-1 |
|
Top 20% |
74.9 |
81.1 |
82.4 |
79.9 |
78.3 |
73.9 |
77.6 |
83.6 |
84.1 |
83.8 |
84.8 |
89.4 |
87.7 |
83.4 |
84.7 |
+1 |
+1 |
|
Territory |
|||||||||||||||||
|
Vologda |
63.1 |
73.6 |
71.0 |
60.3 |
59.8 |
59.6 |
66.0 |
70.2 |
69.5 |
72.9 |
71.4 |
71.9 |
68.1 |
68.8 |
68.1 |
-1 |
-1 |
|
Cherepovets |
68.1 |
76.2 |
75.7 |
71.0 |
71.2 |
68.1 |
69.8 |
73.1 |
72.5 |
75.0 |
73.2 |
76.3 |
73.0 |
73.5 |
75.3 |
+3 |
+2 |
|
Districts |
61.6 |
59.8 |
68.6 |
67.8 |
69.5 |
67.7 |
70.2 |
71.6 |
73.1 |
71.6 |
69.3 |
72.2 |
68.7 |
69.0 |
70.8 |
-2 |
+2 |
|
Region |
63.6 |
67.3 |
71.2 |
66.6 |
67.4 |
65.6 |
69.0 |
71.6 |
71.9 |
72.9 |
70.9 |
73.2 |
69.7 |
70.1 |
71.2 |
-1 |
+1 |
|
Total number of groups: positive changes / no changes / negative changes |
14: 0 / 13 / 1 |
14: 2 / 12 / 0 |
|||||||||||||||
