
Raman Spectroscopy of Rock Art Paintings in the Minusinsk Basin: Testing the Method and Practical Implications
Журнал: Archaeology, Ethnology & Anthropology of Eurasia @journal-aeae-en
Рубрика: Paleoenvironment, the stone age
Статья в выпуске: 3 т.53, 2025 года.
Бесплатный доступ
This article presents the use of Raman spectroscopy to test the composition of paint detected in petroglyphs on old red sandstone in the Minusinsk Basin. Because this sandstone is saturated with iron compounds, it is extremely difficult to distinguish components of red paint based on mineral raw materials from those of the rock surface. We elaborated a two-stage technique. First, the composition of the rock surface was analyzed using Raman spectroscopy. Second, the concentration of substances on the surface was assessed using indexes of relative peak intensity in the spectra using statistical methods (Mann-Whitney U-test, principal component analysis). The procedure was tested at three rock art sites in the Minusinsk Basin. The examination of panel 15 at Tepsei I (Krasnoturansky District, Krasnoyarsk Territory) suggests that when the rock is heavily damaged by environmental processes such as ferruginization, oxalate accretions, oxidation and weathering products, the composition of the paint is indistinguishable from that of the substrate. At Oglakhty IV (Bogradsky District, Republic of Khakassia), analysis revealed that local mineral raw materials from metamorphosed sandstone subjected to heat treatment were used. On panels 7–9 in section 1A of Shalabolino (Kuraginsky District, Krasnoyarsk Territory), two paints were used. The lighter color was made of ocher, the outcrops of which in the form of metamorphosed sandstone were found within the boundaries of the site. The darker paint was made from apatite-magnetite ore. In both cases, the mineral raw materials were subjected to heating. This method will be used to study a larger sample of rock art paintings in the Minusinsk Basin.
Короткий адрес: https://sciup.org/145147547
IDS: 145147547 | DOI: 10.17746/1563-0110.2025.53.3.085-094
Текст научной статьи Raman Spectroscopy of Rock Art Paintings in the Minusinsk Basin: Testing the Method and Practical Implications
Paintings of various chronological periods, from the earliest rock art to the ethnographic period, have been discovered at all key rock art sites of the Minusinsk Basin (the Kavkazskoye, Malye Arbaty, and Shalabolino rock art sites, Tepsei I and Boyary I sites, etc.) (Sher, 1980: 122, 132; Leontiev, Bokovenko, 1985). However, due to relatively poor preservation of images and complexity of their analysis, there have been almost no studies on the composition of their paints (Esin et al., 2014). Difficulties are associated with the rock paintings being located in open complexes that are subjected to significant environmental influences on their chemical features (Hernanz, Gavira-Vallejo, Ruiz-López, 2006). The composition of the rock substrate whose surface contains the image is a key factor. This factor causes particular difficulties in studying the composition of paints in the representations from the Minusinsk Basin. Most of the images in the region were made with red paint, which usually consists of iron oxides and hydroxides (magnetite, hematite, goethite, etc.). The vast majority of rock surfaces with drawings are composed of red-colored Devonian sandstone containing significant amounts of similar iron compounds (Morozov et al., 2019: Pl. 1; Bábek et al., 2025), which hampers the identification of the components
of the paint and their separation from components of the rock substrate. This problem requires a special approach to analysis and interpretation of data on the composition of pigments.
This study was intended to test the method of Raman spectroscopy for determining the composition of paints in rock representations on old red sandstone in the Minusinsk Basin.
Material and methods
Raman spectroscopy identifies the molecular structure of a sample, and is a qualitative method of analysis (determining the presence of certain substances without assessing their concentration). As a result, a spectrum is formed that horizontally consists of the Raman shift (cm-1) and vertically uses a standard unit to compare the intensity. Substances are identified by interpreting peaks in the spectrum.
The research was carried out using a SPEKTR-M RaPort M532 portable spectrometer (laser wavelength 532 nm, power up to 30 mW, focal length 50–75 mm, entrance slit 20 μm, spectral range of wavenumber readings 140–4000 cm-1). The instrument was controlled and spectra were analyzed using EnSpectr Professional software. The spectra collection time was 180–600 sec.
On each panel studied, several points of the rock surface without traces of paint were analyzed; then, spectra were collected in the areas with paint residues. Depending on the state of the panels, oxalate accretions and natural ferruginization were additionally examined. In total, from 8 to 32 analyses were done on each panel.
The first stage of the Raman spectroscopy data reduction involved the identification of the substances present in the zone under analysis, as well as differences between the rock surface and the painted areas. In the absence of distinctive differences, at the second stage, the data were analyzed using methods of mathematical statistics.
The magnitude of peaks marking specific substances is expressed in standard units in the spectra. Thus, their comparison reveals a relative difference in intensity. The ratio of standard units (the index) shows which of any two peaks is more pronounced in the spectrum and to what degree. For example, if peak 1 has an intensity of 600 standard units and peak 2 has an intensity of 450 standard units, the index of peak 1 to peak 2 is 600/450 = 1.3 (the first peak is 1.3 times more intense than the second). A similar approach was used for comparative assessment of the content and structural features of substances (Jorio et al., 2010; Filippov, 2014).
The groups of spectra were compared by peak intensity indexes using the Mann-Whitney U-test. Absence of normal distribution of data in all the cases was confirmed by the Shapiro-Wilk, Anderson-Darling, and Jarque-Bera tests (Kobzar, 2006: 238, 454). Principal component analysis was an additional method given sufficient sample size (at least 30 spec.) (Kosovsky, Adams, Bronte, 2009). Analysis was carried out using the PAST software environment (Hammer, Harper, Ryan, 2001).
The method was tested on material from Shala-bolino (section 1A, panels 1, 7–9), Oglakhty IV, and Tepsei I (panel 15). The earliest rock art paintings, those of the Okunev culture, and unidentifiable spots were studied. For better quality, the photographs were processed in the DStretch plug-in (color filtering) (Gunn, Douglas, Whear, 2014).
Study results
The Shalabolino rock art site is located in the Kuraginsky District of the Krasnoyarsk Territory, on the bank of the Tuba River. The site is divided into 12 sections (1–8, 1A, 2A, 4A, 8A) where over 500 panels with images were found, numbered from west to east (Uchetnaya karta..., 2010). A large number of paintings were discovered in the southwestern part of the site (Zaika, Solodeinikov, 2018). The survey of the site revealed an ocher outcrop emerging from disintegrated old red sandstone. It contained quartz marked by pronounced peaks of 124, 205, 360, 461, and 1160 cm-1 in the spectra, hematite (peaks of 220, 290, 1320 cm-1), and goethite (peaks of 405, 681, and 700 cm-1) (Froment, Tournie, Colomban, 2008: Fig. 2).
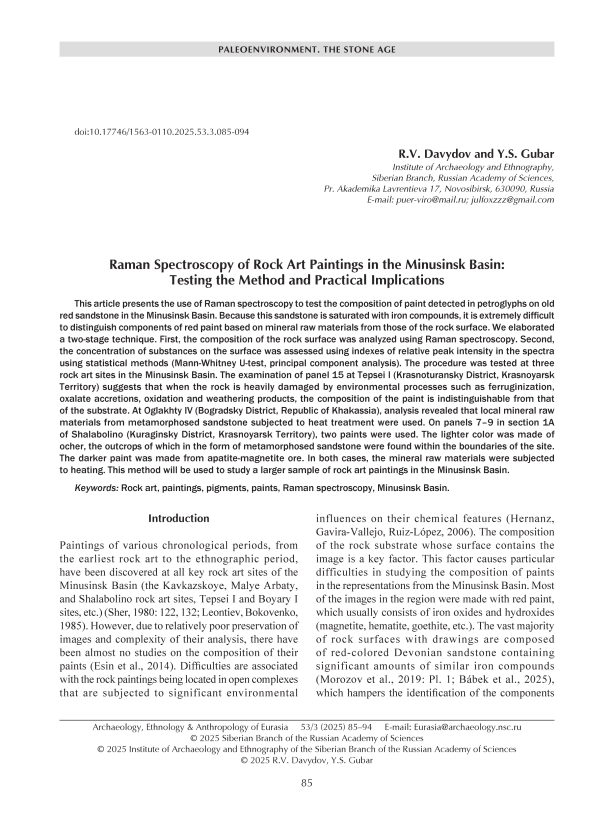
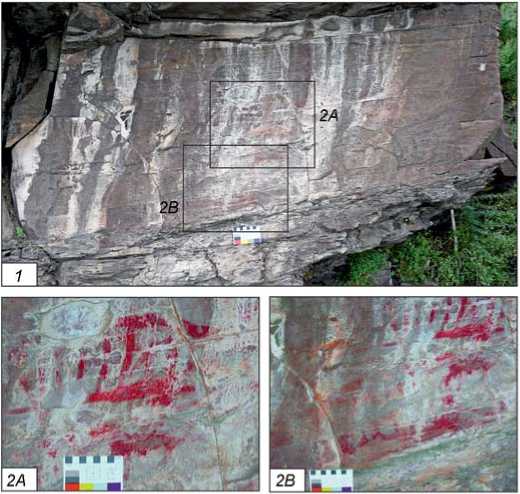
In the eastern part of section 1A, a large palimpsest of painted images of the Okunev culture (late 3rd to early 2nd millennium BC) was found. It was located on panels 7–9 on a block of red sandstone divided into three parts. In addition to paintings, carved images of animals and engraved drawings were discovered on the block (Fig. 1, 1 ).
Most of the rock art paintings were located on the middle third of the panel. A.L. Zaika identified two layers of paintings: the early layer—masks without an external contour and a mask with arched “edging” in the middle of the block, and the later layer—crossshaped masks and signs in the left and central parts (Zaika, Solodeinikov, 2018). The early images were
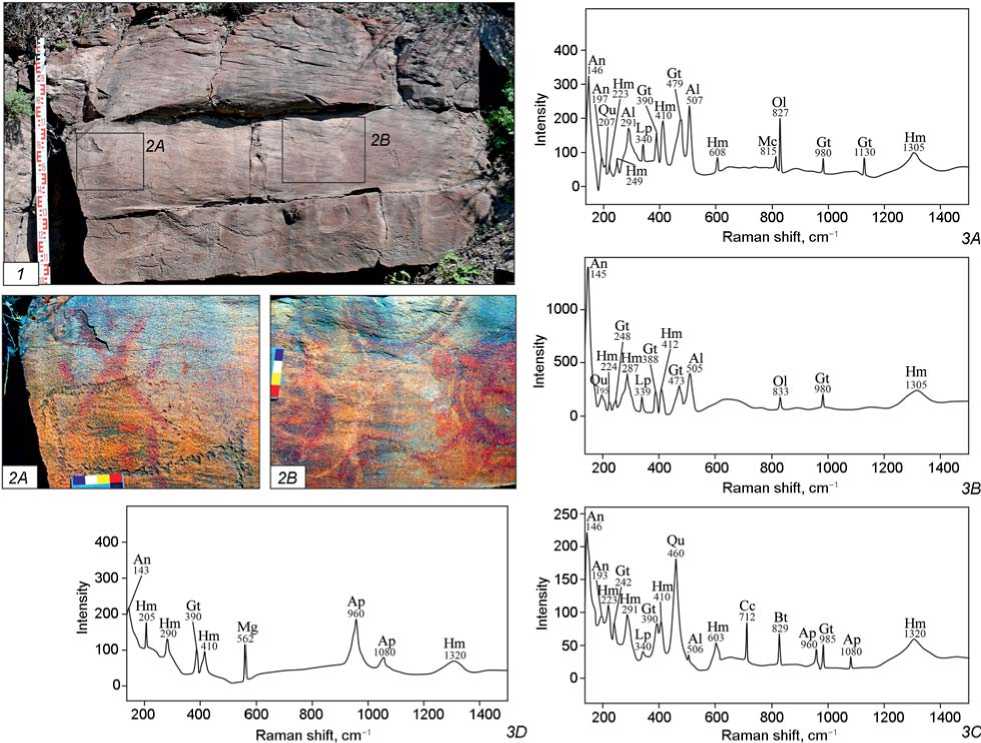
Fig. 1 . Results of analysis of painted images from section 1A of the Shalabolino rock art site.
1 – photograph of panels 7–9; 2A , 2B – photographs of sections with painted images after processing with the DStretch plug-in ( 2A – crossshaped mask on the left part of the block, 2B – palimpsest in the central part); 3A–3D – Raman spectra ( 3A – rock surface, 3B – light paint, 3C – dark paint, 3D – ore inclusions). An – anatase, Al – albite, Ap – apatite, Bt – biotite, Hm – hematite, Gt – goethite, Qu – quartz, Cc – calcite, Lp – lepidocrocite, Mg – magnetite, Mc – microcline, Ol – olivine.
colored light red to light brown; the later images ranged from purple-gray to gray-brown (Fig. 1, 2A , 2B ).
A total of 44 spectra was obtained: 10 of the rock surface and 34 of coloring substances (17 spectra of light and dark paint). The composition of the rock surface was homogeneous and typical of sandstone (Fig. 1, 3A ). Anatase (peaks of 146 and 197 cm–1), albite (291 and 507 cm–1), microcline (815 cm–1), quartz (207 cm–1), and olivine (827 cm–1) were identified. Hematite (223, 249, 410, 608, and 1305 cm–1), goethite (390, 479, 980, and 1130 cm–1), and lepidocrocite (340 cm–1) were also clearly expressed in the spectra (De Faria, Silva, De Oliveira, 1997: 877).
The spectra of areas with light paint also demonstrated the presence of anatase (145 cm-1), albite (505 cm-1), quartz (195 cm-1), and olivine (833 cm-1) (Fig. 1, 3B ). Peaks of hematite (224, 287, 412, and
1305 cm-1), goethite (248, 388, 473, and 980 cm-1), and lepidocrocite (339 cm-1) were observed.
The spectra of areas with dark paint were predominantly (11 spectra) distinguished by apatite peaks (960 and 1080 cm-1) (Fig. 1, 3C ) (Zhang et al., 2023). In the rest of the areas with dark paint, the same compounds were present, including anatase (146 and 193 cm–1), albite (506 cm–1), quartz (460 cm–1), biotite (829 cm–1), lepidocrocite (340 cm–1), hematite (223, 291, 410, 603, and 1320 cm–1), and goethite (242, 390, and 985 cm–1). Areas contaminated with calcite (712 cm–1) were identified (Donnely et al., 2017).
The surface with dark paint yielded six spectra of unknown material showing particularly marked peaks of apatite (960 and 1080 cm–1) and containing magnetite (562 cm–1), anatase (143 cm–1), hematite
(205, 290, 410, and 1320 cm–1), and goethite (390 cm–1) (Fig. 1, 3D ).
Comparison of the four resulting groups confirmed the increased intensity of the apatite peak in the spectra of dark paint and unknown material as compared with the rock surface and light paint. When comparing the groups (each containing from 6 to 17 spectra) across three indexes (apatite, 960 cm–1 to hematite, 290 cm–1; apatite, 960 cm–1 to quartz, 461 cm–1, and apatite, 960 cm–1 to albite, 506 cm–1) according to the Mann-Whitney U-criterion, a statistically significant difference was observed (in all the cases, U < 4 at p < 0.004). The significance criterion p determines the probability of a null hypothesis (in this case, the equality of the samples). If it is less than 0.05, the difference between the groups by a certain feature is considered statistically significant (Kobzar, 2006: 454). The median values of the indexes increased: apatite/hematite from 0.48 (light paint) to 1.31 (unknown material), apatite/quartz from 0.34 (light paint) to 2.7 (unknown material), and apatite/albite from 0.61 (rock surface) to 4.03 (unknown material).
The magnetite peaks manifested a similar increase in intensity. A statistically significant difference was observed for the indexes of magnetite (562 cm-1) to quartz (461 cm-1) and magnetite (562 cm-1) to albite (506 cm-1) with U < 18 and p < 0.0007. The median values of the indexes increased: magnesium to quartz from 0.43 (rock surface) to 1.15 (unknown material), and magnesium to albite from 0.65 (rock surface) to 1.7 (unknown material).
The similarity/difference of the groups by the indexes of albite (506 cm-1) to apatite (960 cm-1), quartz (461 cm-1) to apatite (960 cm-1), and quartz (461 cm-1) to magnetite (562 cm-1) was additionally subjected to principal component analysis. This is used to reduce dimensionality of data by constructing new axes forming a plot in which the proximity of units determines their similarity or difference (Fig. 2, 1 ).
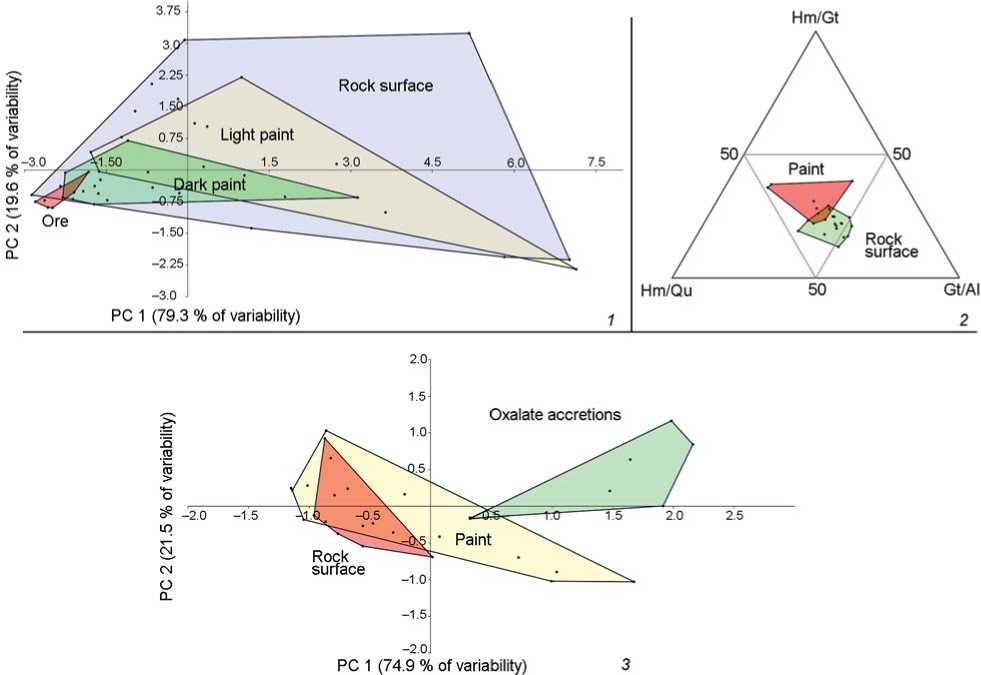
Fig. 2 . Results of analysis of the ratio of peak intensities in the spectra of various materials.
1 – spectral distribution plot for panels 7–9 of section 1A at Shalabolino with PC 1 and PC 2 values by the indexes of albite/apatite, quartz/ apatite, and quartz/magnetite; 2 – spectral distribution diagram for Oglakhty IV by the indexes of hematite/quartz, hematite/goethite, and goethite/albite; 3 – spectral distribution diagram for panel 15 at Tepsei I site with PC 1 and PC 2 values by the indexes of gypsum/quartz, albite/quartz, and quartz/lepidocrocite.
Fig. 3 . Results of analysis of painted images from the Oglakhty IV site.
1 – photograph of the area with paint spots; 2A , 2B – photographs of areas with paint after processing with DStretch plug-in ( 2A – spot, 2B – round symbol); 3A , 3B – Raman spectra ( 3A – rock surface, 3B – paint). Ww – whewellite, Wd – weddellite. For the rest of the designations, see Fig. 1.
Three variables were considered in the analysis. The samples contained 44 elements, which meets the conditions for using this method (over 30 spec.) (Kosovsky, Adams, Bronte, 2009). Two principal components covered 98.9 % of the sample variability. A gradual change in the indexes was observed moving towards an increase in the intensities of magnetite and apatite (the highest was in the unknown material). The nonparametric multivariate PERMANOVA test was performed for verifying the obtained data and confirmed the difference between the groups (F = 4.24, p = 0.004).
It can be concluded that the composition of the rock surface and light paint differed from the dark coloring agent and unknown material, revealing an increased content of magnetite and apatite in the latter two.
The light paint could have been obtained from local metamorphosed sandstone, which explains its similarity to the rock surface material. The presence of iron oxides and hydroxides in ocher outcrops at the site confirms this possibility. The dark paint differed from the local material. The increased apatite content suggests the use of apatite-magnetite ore. In this case, the unknown material with a large amount of apatite and magnetite consists of inclusions of incompletely processed mineral raw material.
The Oglakhty IV site is a part of the Mount Oglakhty rock art complex in the Bogradsky District of the Republic of Khakassia. It is located on a steep southwestern slope called “Forty Teeth”, has a length of 4 km, and contains over 260 panels (Miklashevich, 2015). Spots of red paint (Fig. 3, 1 )—four non-figurative spots up to 3 × 2 cm in size and one poorly preserved symbol consisting of a circle with a dot in the middle (Fig. 3, 2A , 2B )—were discovered in its southeastern part (the “first tooth”), above the panels with carved zoomorphic images. Similar circles are known from the art of the Okunev culture (Studzitskaya, 1997: Pl. I, 4 ).
Twenty five spectra were obtained from the site, including 17 of the rock surface and eight of paint. The rock surface had a composition typical of sandstone (Fig. 3, 3A). The spectra revealed peaks of anatase (145 and 190 cm-1), albite (480 and 505 cm-1), quartz (460 cm-1), hematite (240, 290, 410, and 1310 cm-1), and goethite (390 cm-1). A special feature of the rock surface under study was the presence of whewellite (901, 1460, and 1486 cm-1), which was detected in all areas regardless of the presence of paint and could be interpreted as a metabolic product of microorganisms living in the upper layers of the rock substrate (Hernanz, Gavira-Vallejo, Ruiz-López, 2006: Fig. 7, pp. 1059–1060).
The paint spectra demonstrated a similar composition (Fig. 3, 3B ). Anatase (peaks of 145, 190 cm-1), albite (480 and 505 cm-1), and quartz (460 cm-1) were detected. Iron compounds were represented by hematite (peaks of 290, 410, and 1310 cm-1) and goethite (390 cm-1). The presence of calcium oxalate in the form of weddellite was also observed (peaks of 904 and 1470 cm-1) (Ibid.: Fig. 7).
Analysis of the intensity ratio revealed a significant decrease in the power of the goethite peak in the spectra of paint, which was expressed in a statistically significant increase in the hematite (290 cm-1) to goethite (390 cm-1) index (U = 7, p < 0.0001) from 0.71 (rock surface) to 1.06 (paint), and decrease in the goethite (390 cm-1) to albite (508 cm-1) index (U = 33, p = 0.04) from 1.51 to 1.19 (see Fig. 2, 2). No other differences between the groups of spectra were detected.
The paint could have been made from local material similar to the sandstone of the rock surface.
The Tepsei I site is a part of the rock art site of “Listvyagovo. Petroglyphs of Tepsei” (Krasnoturansky District, Krasnoyarsk Territory), which includes Tepsei I–VI and Ust-Tuba I–VI. Tepsei I is located on the partially flooded shore of the Krasnoyarsk Reservoir and has at least 50 panels. Panels 1–25 are on higher ground at the northern end of the site. Panel 15 was examined, revealing five images of ungulates painted in red (Fig. 4, 1 , 2 ) (Abolonkova, Solodeinikov, 2021). The panel was covered with whitish oxalate accretions partially concealing the images. A reddish amorphous spot resulting from natural ferruginization was in the upper left part of the panel.
$ 400
С/)
о 300
- 200
= 500
| 400
£ 300
100 0
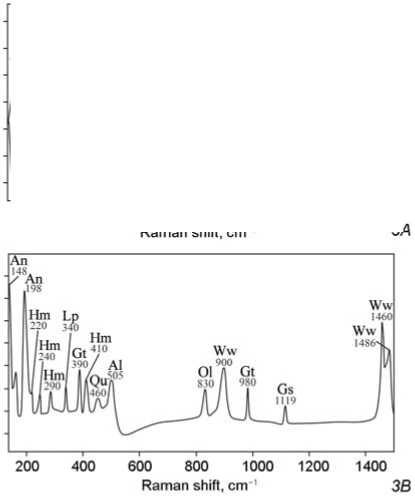
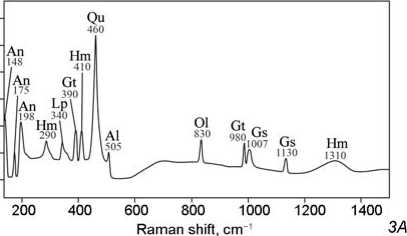
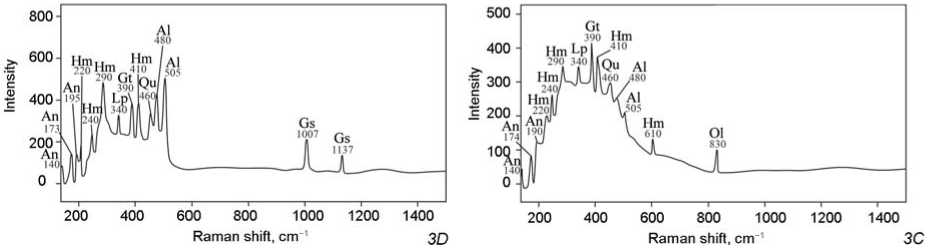
Fig. 4 . Results of the analysis of painted images from the Tepsei I site.
1 – photograph of panel 15; 2A , 2B – photographs of painted images after processing with DStretch plug-in ( 2A – central part of the panel, 2B – lower part); 3A–3D – Raman spectra ( 3A – rock surface, 3B – oxalate accretion, 3C – natural ferruginization, 3D – paint).
Ww – whewellite, Gs – gypsum. For the rest of the designations, see Fig. 1.
In total, 32 spectra were obtained from the panel, including 15 of the rock surface, six of oxalate accretions, one of natural ferruginization, and 10 of paint. The rock substrate differed from those described earlier by the presence of gypsum (marked by peaks of 1007 and 1130 cm-1), which is a typical product of sandstone disintegration (Fig. 4, 3A ) (Ilmi et al., 2022). Otherwise, the spectra of the rock surface were quite typical, manifesting the presence of anatase, albite, quartz, olivine, hematite, goethite, and lepidocrocite. In addition to the sandstone components, oxalate accretions contained whewellite (marked by peaks of 900, 1460, and 1486 cm-1) (Fig. 4, 3B ). Natural ferruginization was located outside of the oxalate accretions and areas of sandstone disintegration, so it did not contain gypsum or any forms of calcium oxalates (Fig. 4, 3C ). The spectra showed pronounced peaks of hematite (220, 240, 290, 410, and 610 cm-1), goethite (390 cm-1), and lepidocrocite (340 cm-1) (De Faria, Silva, De Oliveira, 1997: 877). Anatase, quartz, albite and olivine were present. Paint spectra from the areas not covered by oxalate accretions demonstrated presence of anatase, quartz, and albite (Fig. 4, 3D ). Peaks of hematite (220, 240, 290, and 410 cm-1), goethite (390 cm-1), and lepidocrocite (340 cm-1) were clearly expressed; gypsum was also present (peaks of 1007 and 1137 cm-1).
Comparison between the groups of spectra showed the absence of statistically significant differences between the rock surface and paint. Difference between the coloring agent and surrounding oxalate accretions was more noticeable due to the increased intensity of quartz peaks in the spectra. This pattern was revealed by the indexes of gypsum (1007 cm-1) to quartz (460 cm-1), albite (505 cm-1) to quartz (460 cm-1), and quartz (460 cm-1) to goethite (390 cm-1). The median values of gypsum to quartz decreased from 0.79 (incrustations) to 0.42 (paint), whereas the albite to quartz indexes lessened from 1.69 to 0.3, respectively. This difference was statistically significant (when comparing samples, in the former case U = 3, p = 0.005; in the latter case U = 5, p = 0.01). The quartz to goethite index increased from 0.45 to 1.07 (U = 4, p = 0.007).
To verify this pattern, all the samples were compared using principal component analysis for the following indexes: gypsum (1007 cm-1) to quartz (460 cm-1), albite (505 cm-1) to quartz (460 cm-1), and quartz (460 cm-1) to lepidocrocite (340 cm-1) (see Fig. 2, 3 ). There were 32 elements in the sample, which corresponded to the conditions for using that method. Principal components 1 and 2 covered
96.4 % of the variability. According to the index values, paint spectra were almost identical to those of the rock surface; a difference was detected only for oxalate accretions.
Verification of the results using the PERMANOVA test confirmed these findings. For three samples (excluding ferruginization), F = 8.36, p = 0.0008. When comparing the spectra of paint and the rock surface, F = 0.86, p = 0.39, which shows the absence of differences.
Difference between oxalate accretions from the rock surface and the paint was quite expected. Absence of this difference could indicate, as in other cases considered, similarity of the material. Noteworthy is the presence of two iron hydroxides, strong oxalate accretions, and gypsum, which together suggest the intensive transformation of the rock surface in a humid environment (Alekseev, Alekseeva, 2000; Ilmi et al., 2022). For this reason, the chemical characteristics of the rock surface might have become similar across the entire panel.
Discussion
Analysis of rock art paintings at three sites in the Minusinsk Basin proves this method to be relatively effective. In most cases, the composition of the paint and of the rock surface was very similar, and any regularities could only be revealed by analyzing the ratio of peak intensities (Oglakhty IV, dark and light paints on panels 7–9 of section 1A of the Shalabolino rock art site).
In the context of this study, an exception was panel 15 at Tepsei I, with distinctive differences between the rock surface and paint. The results of analysis were greatly influenced by changes in the chemical features of the panel. The presence of goethite and lepidocrocite indicated oxidation processes involving organic matter (Alekseev, Alekseeva, 2000; Vodyanitsky, 2010: 12–14), which caused the development of oxalate accretions from bacterial activity on the rock surface (Hernanz, Gavira-Vallejo, Ruiz-López, 2006: 1058, 1062). Another evidence of disintegration of the panel was the presence of gypsum formed during sandstone weathering (Ilmi et al., 2022). Natural ferruginization also suggests active oxidation processes. Panel 15 at Tepsei I was subjected to intense chemical exposure, which could have been due to its location directly on the shore of the Krasnoyarsk Reservoir. Relatively good preservation of the rock art paintings probably resulted from oxalate accretions.
In other cases, the method used has made it possible to identify specific features of pigment composition. The light paint on panels 7–9 of section 1A at Shalabolino and Oglakhty IV was made from local mineral raw materials. This is manifested by the compositions of pigments and the rock surface being almost identical, without traces of the significant impact of natural factors as was the case at Tepsei I.
The composition of ocher, which had an outcrop at Shalabolino, was also very typical of ordinary old red sandstone (quartz, hematite, and goethite) (Morozov et al., 2019; Wojcieszak, Wadley, 2019). Similar outcrops of natural mineral pigments were recorded in the area of the Kavkazskoye rock art site, containing large series of painted images of the Early Iron Age (Leontiev, Bokovenko, 1985: 87). The raw material strategy, which implied the use of pigments from local mineral sources for making paints, was common in rock art from the Stone Age (Chalmin, Menu, Vignaud, 2003: 1596; Bu, Cizdziel, Russ, 2013).
Hence, the images of the Okunev culture at Shalabolino and Oglakhty IV were made with paint based on local ocher, which emerged after disintegration of old red sandstone. The composition of individual samples of red pigment from steles at the Okunev burials demonstrates a similar combination of hematite and ocher, with the admixture of quartz and calcite (Esin et al., 2014: 87). The use of mineral raw materials from rock outcrops must have been widespread, but the sample is so far not large enough to make generalizations.
The dark paint on panels 7–9 of section 1A at Shalabolino turned out to be different in composition than the local sandstone. Intense peaks of magnetite and apatite suggest the use of apatite-magnetite ore as a mineral raw material. It is widespread in the Altai-Sayan, including the Kuraginsky District of Krasnoyarsk Territory (the Kazyr group of deposits) (Dolgushin, Pavlov, 1987: 31). Thus, that kind of ore could well have served as an alternative source for the pigment. Notably, A.L. Zaika attributed the images made with dark paint to a later chronological period of the Okunev culture than those painted with pigment based on local raw materials (Zaika, Solodeinikov, 2018).
Judging by iron oxides and hydroxides in the paints, the mineral raw materials used at Shala-bolino and Oglakhty IV were subjected to heat treatment. The key difference in the coloring agent at Oglakhty IV was the reduced content of iron hydroxide. In the dark paint at Shalabolino, magnetite did not appear as much as in unprocessed ore inclusions. Mineral pigments acquire a rich red color from hematite into which iron hydroxides (goethite, magnetite) pass during firing (Nurdini et al., 2022). Heat treatment for increasing color intensity has been observed in reconstructions of paint manufacturing techniques starting from the Upper Paleolithic (Praslov, 1992: 100; Pomiès, Menu, Vignaud, 1999; Nurdini et al., 2022).
Thus, Raman spectroscopy and analysis of relative peak intensities in the spectra have revealed that Okunev images at the Oglakhty IV site and panels 7–9 of section 1A at the Shalabolino rock art site were created with paint made of local ocher (disintegrated old red sandstone) or apatite-magnetite ore subjected to heat treatment.
Conclusions
Research of ancient paints on old red sandstone is significantly complicated by its composition. Presence of iron compounds in the rock hampers identification of pigments, and makes the sandstone itself the accessible raw material for pigments, which are then almost identical in composition to the rock substrate.
Raman spectroscopy, supplemented by analysis of the ratio of peak intensities, makes it possible to identify specific features of paint composition. The exception is situations when the rock surface is heavily contaminated.
Our findings show that the paint used on panels 7–9 of section 1A at Shalabolino and Oglakhty IV was made of local raw materials, which underwent heat treatment to enhance their color. Firing was also applied in the manufacture of dark pigment based on apatite-magnetite ore, which is observed in some masks at the Shalabolino rock art site.
The method tested in this research can be further used in rock art studies in the Minusinsk Basin and other regions.
Acknowledgment
This study was supported by the Russian Science Foundation, Project No. 25-28-00600 “Comprehensive Technological Study of Rock Art Paintings in the Minusinsk Basin: Formulation, Application Methods, Preservation” .