Research into the conditions and drivers of labor potential reproduction in the Vologda oblast municipal districts

Author: Chekmareva Elena Andreevna
Journal: Economic and Social Changes: Facts, Trends, Forecast @volnc-esc-en
Section: Labor economics
Article in issue: 5 (47) т.9, 2016.
Free access
The article presents the reproduction of labor potential of a municipal district as a continuous renewal process of its quantitative and qualitative features, consisting of three consecutive phases: formation, distribution (including redistribution) and exploitation. The research paper reveals the problems and specifics of labor potential reproduction at the municipal level on the basis of processing available statistical and sociological information on the districts of the Vologda Oblast. The materials of the territorial body of the Federal State Statistics Service in the Vologda Oblast and databases of questionnaire surveys conducted by ISEDT RAS served as an information base of the research. The analysis has allowed characterizing the modern structure of labor potential as a kind of “starter” state which largely determines future development prospects. Special attention is given to the formation, distribution and exploitation of labor potential qualitative characteristics which are assessed in the article on the basis of studies carried out by ISEDT RAS in eight municipal districts of the Vologda Oblast and the cities of Vologda and Cherepovets (sample size - 1,500 people of working age)...
Labor potential, reproduction, formation, distribution, exploitation, municipal district
Short address: https://sciup.org/147223870
IDR: 147223870 | UDC: 331.101.26(470.12) | DOI: 10.15838/esc.2016.5.47.10
Text of the scientific article Research into the conditions and drivers of labor potential reproduction in the Vologda oblast municipal districts
Labor potential is the main driving force of social and economic development of territories. According to the opinion of the global scientific community, including M.S. Toksanbaeva, a leading domestic expert on labor potential reproduction in modern Russia, “the value of human factor in the economy will increase intensively” [13, p. 3]. Recognition of the role of the human factor in economic development led to the emergence of one of the most important ideas in modern labor economics, according to D. Acemoglu, – the understanding of the set of skills and abilities of employees as a special form of capital [16, p. 3] and the introduction of the term “human capital” into scientific practice. The development of this idea in the foreign scientific literature formed a generally accepted approach that considers potential employment opportunities of the population in light of increasing production in the framework of the human capital theory, the foundations of which were laid in the works of American economists T. Schultz [20] and G. Becker [17] more than 50 years ago. In fact, the human capital theory consider workers abilities as a specific item that could be “bought and sold”: knowledge, skills and abilities can be “bought” by investing in education [19], and then “sold” at a profit by finding a high-paid job [18]. This understanding of working man was alien to the Soviet economic science, which, in our opinion, is connected not only with the administrative-command economic system that existed in Russia in the period of formation of the human capital theory, but also with specifics of the Russian mentality [1]. As a result, the Russian economic thought went a slightly different way, and “in order to characterize a personal production factor in a multidimensional expression” [9, p. 5] A.S. Pankratov proposed the concept of “labor potential”.
In modern conditions, as M.S. Tok-sanbaeva notes, “paramount theoretical and practical importance is attached to the knowledge about qualitative and quantitative characteristics of labor potential, to the study of level and drivers of its effective reproduction. They (...) help find out what generated the changes (...) and, accordingly, what aspects of reproduction of labor potential require special attention and adjustment” [13, p. 3]. However, as we see, the analysis of labor potential reproduction is necessary to start from the municipal level, since the presentation of statistics in aggregate form in the context of regions, and real problems of labor potential reproduction in rural areas are smoothed out by the success of development of large cities. The problem outlined, along with the recognition of sustainable development of rural areas as one of the most important strategic goal of the state policy in the Russian Federation [5] and lack of scientific support for the question, determines the relevance of the study of labor potential reproduction at the municipal level. It should be understood that people live not in the region in general, but in a particular municipality, which has its own features and problems that shape a specific environment for labor potential reproduction.
In addition, we fully agree with A.S. Marshalova and A.S. Novoselov who state that “one of the problems of municipal management consists in the absence of a clear system for managing reproduction processes” [7, p. 171]. Therefore, we believe that the study of the problems and features of reproduction of labor potential in municipalities is of particular relevance and significance in practice, because it can become a good basis for the development of a scientifically sound system for managing reproduction processes at the municipal level.
The purpose of the present study is to identify main problems and features of formation, distribution and use of labor potential at the municipal level on the basis of processing available statistical and sociological information on the Vologda Oblast districts. To achieve this goal, the following objectives have been achieved: current structure of labor potential was studied as a kind of “initial” status, which determines future development prospects; main problems and features of individual phases of labor potential reproduction in the Vologda Oblast municipal districts were revealed.
Materials of the territorial office of the Federal State Statistics Service in the Vologda Oblast, and databases of questionnaire surveys carried out by ISEDT RAS served as the information basis for the research. The analyzed period is 2000–2015.
The present paper considers labor potential reproduction in a municipal district as a continuing process of renewal of its quantitative and qualitative features, consisting of three consecutive phases: formation, distribution (including redistribution) and use. The labor potential of the territory is understood as a “generalized characteristic of the measure and quality of the set of abilities to work:” [8, p. 14], which is assessed quantitatively by the size of working age population and qualitatively – by level of development of qualitative characteristics of working age population. This corresponds to an integrated economic approach to the interpretation of this term [6].
In general, when analyzing the reproduction of labor potential, we follow the approach of A.S. Pankratov , according to which “the division of the overall process of labor potential reproduction into a series of independent phases allows us to study them in more detail and systematize those economic relations that are characteristic of the reproductive phase, and only then to synthesize inferences and theoretically substantiate directions for improving the reproductive process as a whole” [9, p. 16]. For this reason, next, we consider individual phases of labor potential reproduction in the Vologda Oblast municipal districts step by step.
It should be noted that we do not aim to carry out a comprehensive analysis of reproduction processes. In particular, some aspects of formation, distribution and use of labor potential are deliberately omitted from consideration. For example, the paper does not describe birth rate dynamics, because today’s babies will enter into working age only 16 years later. However, the birth rate is taken into account when constructing demographic forecasts.
Formation of labor potential. Main quantitative and qualitative characteristics of labor potential are built up in the phase of its formation. Note that the principles of formation of labor potential are the same for any district, but the conditions are different depending on the territorial-geographical, historical, economic, demographic, social and other factors [9, p. 16]. However, despite the abundance of drivers of labor potential formation, it is the demographic development of the municipality that has the greatest influence on its quantitative characteristics.
Currently, demographic development in the majority of municipal districts comprising the Vologda Oblast is characterized by a decline in the total population. The increase in the number of residents is observed only in Vologodsky District. So, between 2000 and 2015, the total population increased by 1% from 51,296 to 51,930 people (Tab. 1) . For comparison, over the same period, the number of inhabitants of Vologda increased by 4%, of Cherepovets – 1% and reached 319 and 318 thousand, respectively. During this period, the population of Vashkinsky District decreased by almost a third (31%). Similar extent of population decline was
Table 1. Change in the number and share of working age population in municipal areas and urban districts of the Vologda Oblast in the period from early 2000 to early 2015
|
Municipal district / urban district |
Total population, people |
Working age population in total population |
|||||||||
|
Number, people |
Share, % |
||||||||||
|
2000 |
2015 |
Dynamics |
2000 |
2015 |
Dynamics |
2000 |
2015 |
Dynamics |
|||
|
absolute |
relative. |
||||||||||
|
Vologodsky |
51296 |
51930 |
+1% |
29656 |
30119 |
+2% |
57.8 |
58.0 |
+0.2 p.p. |
+0.3% |
|
|
Vologda |
307182 |
319408 |
+4% |
192291 |
192544 |
0% |
62.6 |
60.3 |
-2.3 p.p. |
-3.7% |
|
|
Cherepovetsky |
41992 |
40000 |
-5% |
22406 |
21612 |
-4% |
53.4 |
54.0 |
+0.6 p.p. |
+1.3% |
|
|
Cherepovets |
315422 |
318107 |
+1% |
196588 |
188938 |
-4% |
62.3 |
59.4 |
-2.9 p.p. |
-4.7% |
|
|
Sheksninsky |
35856 |
33211 |
-7% |
21666 |
19521 |
-10% |
60.4 |
58.8 |
-1.6 p.p. |
-2.7% |
|
|
Totemsky |
26890 |
23083 |
-14% |
15004 |
12960 |
-14% |
55.8 |
56.1 |
+0.3 p.p. |
+0.6% |
|
|
Sokolsky |
60503 |
49735 |
-18% |
33707 |
27640 |
-18% |
55.7 |
55.6 |
-0.1 p.p. |
-0.2% |
|
|
Kaduysky |
19481 |
16997 |
-13% |
11104 |
9104 |
-18% |
57.0 |
53.6 |
-3.4 p.p. |
-6.0% |
|
|
Nikolsky |
27506 |
20571 |
-25% |
14082 |
11535 |
-18% |
51.2 |
56.1 |
+4.9 p.p. |
+9.5% |
|
|
Vozhegodsky |
19573 |
15218 |
-22% |
10312 |
8205 |
-20% |
52.7 |
53.9 |
+1.2 p.p. |
+2.3% |
|
|
Syamzhensky |
10620 |
8344 |
-21% |
5626 |
4402 |
-22% |
53.0 |
52.8 |
-0.2 p.p. |
-0.4% |
|
|
Babushkinsky |
15775 |
12064 |
-24% |
8484 |
6469 |
-24% |
53.8 |
53.6 |
-0.2 p.p. |
-0.3% |
|
|
Gryazovetsky |
43264 |
33580 |
-22% |
24309 |
18507 |
-24% |
56.2 |
55.1 |
-1.1 p.p. |
-1.9% |
|
|
Verkhovazhsky |
16653 |
13133 |
-21% |
8936 |
6772 |
-24% |
53.7 |
51.6 |
-2.1 p.p. |
-3.9% |
|
|
Ustyuzhensky |
22553 |
17523 |
-22% |
12243 |
9264 |
-24% |
54.3 |
52.9 |
-1.4 p.p. |
-2.6% |
|
|
Kichm.-Gorodetsky |
23280 |
16616 |
-29% |
11759 |
8875 |
-25% |
50.5 |
53.4 |
+2.9 p.p. |
+5.7% |
|
|
Velikoustyugsky |
68823 |
55630 |
-19% |
40321 |
30068 |
-25% |
58.6 |
54.0 |
-4.6 p.p. |
-7.7% |
|
|
Ust-Kubinsky |
9703 |
7912 |
-18% |
5243 |
3856 |
-26% |
54.0 |
48.7 |
-5.3 p.p. |
-9.8% |
|
|
Chagodoshchensky |
16230 |
12823 |
-21% |
8799 |
6462 |
-27% |
54.2 |
50.4 |
-3.8 p.p. |
-7.0% |
|
|
Nyuksensky |
12048 |
8944 |
-26% |
6455 |
4669 |
-28% |
53.6 |
52.2 |
-1.4 p.p. |
-2.6% |
|
|
Kirillovsky |
19223 |
15223 |
-21% |
10472 |
7465 |
-29% |
54.5 |
49.0 |
-5.5 p.p. |
-10.0% |
|
|
Vytegorsky |
32894 |
25302 |
-23% |
18193 |
12958 |
-29% |
55.3 |
51.2 |
-4.1 p.p. |
-7.4% |
|
|
Tarnogsky |
15820 |
11795 |
-25% |
8449 |
6002 |
-29% |
53.4 |
50.9 |
-2.5 p.p. |
-4.7% |
|
|
Babaevsky |
25964 |
20150 |
-22% |
14312 |
10106 |
-29% |
55.1 |
50.2 |
-4.9 p.p. |
-9.0% |
|
|
Mezhdurechensky |
7858 |
5716 |
-27% |
4153 |
2880 |
-31% |
52.9 |
50.4 |
-2.5 p.p. |
-4.7% |
|
|
Kharovsky |
21623 |
15041 |
-30% |
11268 |
7353 |
-35% |
52.1 |
48.9 |
-3.2 p.p. |
-6.2% |
|
|
Belozersky |
22642 |
15752 |
-30% |
11986 |
7745 |
-35% |
52.9 |
49.2 |
+3.7 p.p. |
-7.1% |
|
|
Vashkinsky |
10469 |
7202 |
-31% |
5769 |
3388 |
-41% |
55.1 |
47.0 |
-8.1 p.p. |
-14.6% |
|
Note. Arranged according to the change in the number of working age population.
Sources: Vozrastno-polovoi sostav naseleniya Vologodskoi oblasti v 2014 godu: stat. sbornik [Age-sex composition of the population of the Vologda Oblast in 2014: statistics collection]. Vologdastat. Vologda, 2015. 97 p.; Vologdastat data; author’s calculations.
observed in Belozersky (-30%), Kharovsky (-30%) and Kichmengsko-Gorodetsky (-29%) districts.
The decline in the total population was accompanied by a decline in working age population, the main quantitative characteristic of labor potential of the territory. The volume of labor potential is declining almost everywhere at a more rapid pace than the total population. So, in Vashkinsky District, the decline was 41%, in Belozersky and Kharovsky districts – 35%, in Mezhdurechensky District – 31%. In 15 years, half of the districts in the Vologda Oblast lost at least a quarter of their working age population.
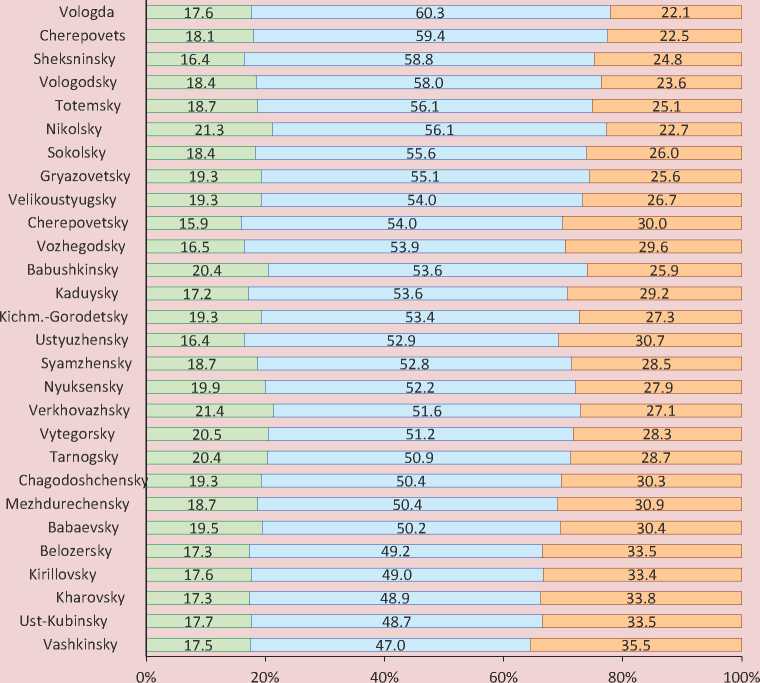
Figure 1. Age structure of population in the Vologda Oblast municipal districts at the beginning of 2015
□ under working age
□ ofworking age
□ over working age
Note. Sorted in descending order of the share of working age population.
Sources: Vozrastno-polovoi sostav naseleniya Vologodskoi oblasti v 2014 godu : stat. sbornik [Age-sex composition of the population of the Vologda Oblast in 2014: statistics collection]. Vologdastat. Vologda, 2015. 97 p.; author’s calculations.
However, in some districts where demographic dynamics is negative (Nikolsky, Kichmengsko-Gorodetsky, Vozhegodsky, Cherepovetsky, Totemsky), the decline in total population was more rapid than the reduction in labor potential; as a result, the share of working age population in the total population in these areas increased, which, in this case, can by no means be regarded as a positive change.
To date, age structure of the population is most unfavorable in Vashkinsky, Ust-Kubinsky, Kharovsky, Kirillovsky and Belozersky districts: in these territories, the share of working age population is less than half; that is, for each working
Table 2. Age structure of working age population in municipal districts of the Vologda Oblast at the beginning of 2015, %
|
Municipal district / urban district |
Age, years |
Average age, years |
|||||
|
16–19 |
20–29 |
30–39 |
40–49 |
50 and older* |
|||
|
Vologda |
6.9 |
29.9 |
28.4 |
19.0 |
15.8 |
35.2 |
|
|
Cherepovets |
6.4 |
24.7 |
29.7 |
22.2 |
17.0 |
36.4 |
|
|
Vologodsky |
5.7 |
24.6 |
27.0 |
22.0 |
20.7 |
37.3 |
|
|
Velikoustyugsky |
6.8 |
23.3 |
26.1 |
22.5 |
21.2 |
37.4 |
|
|
Sokolsky |
6.0 |
23.3 |
27.4 |
22.1 |
21.2 |
37.6 |
|
|
Sheksninsky |
4.5 |
23.3 |
29.5 |
22.6 |
20.2 |
37.7 |
|
|
Ustyuzhensky |
5.0 |
24.7 |
25.2 |
22.7 |
22.4 |
37.9 |
|
|
Kaduysky |
7.2 |
20.7 |
25.1 |
24.8 |
22.3 |
38.1 |
|
|
Totemsky |
7.6 |
21.0 |
24.5 |
22.1 |
24.7 |
38.1 |
|
|
Cherepovetsky |
4.7 |
23.4 |
26.6 |
21.7 |
23.5 |
38.2 |
|
|
Gryazovetsky |
6.4 |
20.1 |
25.6 |
24.7 |
23.2 |
38.5 |
|
|
Vytegorsky |
6.2 |
18.6 |
28.1 |
24.4 |
22.8 |
38.6 |
|
|
Chagodoshchensky |
4.7 |
16.6 |
29.8 |
24.9 |
24.0 |
39.4 |
|
|
Vozhegodsky |
5.1 |
21.0 |
22.8 |
23.8 |
27.3 |
39.4 |
|
|
Babaevsky |
4.0 |
17.9 |
28.2 |
24.5 |
25.4 |
39.6 |
|
|
Nikolsky |
6.2 |
16.0 |
21.1 |
29.2 |
27.4 |
40.2 |
|
|
Kichm.-Gorodetsky |
6.5 |
16.4 |
19.9 |
29.4 |
27.9 |
40.2 |
|
|
Belozersky |
6.1 |
17.2 |
20.7 |
25.9 |
30.0 |
40.4 |
|
|
Kirillovsky |
5.1 |
15.6 |
25.0 |
24.6 |
29.7 |
40.5 |
|
|
Verkhovazhsky |
5.9 |
14.3 |
24.3 |
26.3 |
29.1 |
40.5 |
|
|
Tarnogsky |
5.9 |
13.6 |
24.3 |
28.4 |
27.9 |
40.6 |
|
|
Kharovsky |
6.1 |
14.3 |
22.9 |
27.8 |
29.0 |
40.6 |
|
|
Ust-Kubinsky |
5.8 |
14.5 |
23.7 |
26.8 |
29.3 |
40.7 |
|
|
Nyuksensky |
6.0 |
14.1 |
23.6 |
27.2 |
29.0 |
40.7 |
|
|
Mezhdurechensky |
5.6 |
15.2 |
21.6 |
27.8 |
29.9 |
40.9 |
|
|
Syamzhensky |
4.5 |
15.4 |
23.2 |
26.7 |
30.3 |
41.0 |
|
|
Babushkinsky |
4.8 |
14.5 |
24.7 |
24.6 |
31.4 |
41.0 |
|
|
Vashkinsky |
4.9 |
10.1 |
24.2 |
27.8 |
33.0 |
42.2 |
|
Note. Arranged according to the increase in average age. *50–54 years – for women, 50–59 years – for men.
Sources: Vozrastno-polovoi sostav naseleniya Vologodskoi oblasti v 2014 godu: stat. sbornik [Age-sex composition of the population of the Vologda Oblast in 2014: statistics collection]. Vologdastat. Vologda, 2015. 97 p.; author’s calculations.
age person there is at least one person of unemployable age, and most of them are pensioners, who have already implemented their employment potential and cannot be considered as a reserve to replenish labor resources of the district (Fig. 1) .
The age structure of working age population arouses concerns. For instance, in Vashkinsky District, one-third of labor potential is represented by persons 50 years of age and older, and they will soon retire (Tab. 2). Moreover, in 15 out of 26 municipal districts in the Vologda Oblast, the proportion of persons of this age group exceeds 25%.
Annual losses of labor potential, associated with migration outflow and mortality of working age population, as
Table 3. Assessment of changes in the number of working age population in municipal districts of the Vologda Oblast in 2015
For example, in Vashkinsky District, the loss of the labor potential in 2015 is estimated at 210 people or 6% of working age population at the beginning of the year (Tab. 3). In just a year in Belozersky District, working age population fell by 4.5%. Similar rate of decline is observed in Vozhegodsky, Kharovsky and Nyuksensky districts.
Currently, the majority of districts have an extremely unfavorable population structure. Here it is important to understand
Table 4. Forecast of the number of working age population in municipal districts of the Vologda Oblast at the beginning of the year, people
|
Municipal district / urban district |
Year |
Gain / loss, % |
||||||||||
|
2015 (fact) |
2016 (estimate) |
2017 |
2018 |
2019 |
2020 |
2021 |
2022 |
2023 |
2024 |
2025 |
||
|
Vologodsky |
30119 |
30066 |
30070 |
30084 |
30112 |
30173 |
30171 |
30273 |
30429 |
30634 |
30948 |
3 |
|
Kirillovsky |
7465 |
7248 |
7112 |
7005 |
6927 |
6880 |
6880 |
6895 |
6929 |
6950 |
6998 |
-6 |
|
Sheksninsky |
19521 |
19325 |
19091 |
18892 |
18678 |
18552 |
18360 |
18288 |
18187 |
18143 |
18153 |
-7 |
|
Kaduysky |
9104 |
8908 |
8729 |
8617 |
8492 |
8452 |
8408 |
8367 |
8395 |
8360 |
8357 |
-8 |
|
Babaevsky |
10106 |
9847 |
9648 |
9432 |
9302 |
9233 |
9156 |
9071 |
9090 |
9106 |
9167 |
-9 |
|
Vologda |
192544 |
188693 |
185607 |
183101 |
181021 |
179343 |
177914 |
176401 |
175383 |
174774 |
174279 |
-9 |
|
Verkhovazhsky |
6772 |
6566 |
6413 |
6259 |
6165 |
6090 |
6028 |
6004 |
6003 |
6030 |
6079 |
-10 |
|
Cherepovets |
188938 |
185618 |
182564 |
179855 |
177413 |
174884 |
172682 |
170784 |
169251 |
168081 |
166917 |
-12 |
|
Ust-Kubinsky |
3856 |
3732 |
3639 |
3584 |
3487 |
3469 |
3440 |
3386 |
3337 |
3312 |
3301 |
-14 |
|
Tarnogsky |
6002 |
5801 |
5611 |
5446 |
5361 |
5289 |
5213 |
5163 |
5127 |
5103 |
5108 |
-15 |
|
Ustyuzhensky |
9264 |
9012 |
8832 |
8700 |
8528 |
8395 |
8241 |
8104 |
8003 |
7920 |
7827 |
-16 |
|
Totemsky |
12960 |
12574 |
12271 |
11970 |
11706 |
11483 |
11227 |
11067 |
10945 |
10827 |
10737 |
-17 |
|
Mezhdurechensky |
2880 |
2789 |
2705 |
2636 |
2561 |
2522 |
2483 |
2437 |
2386 |
2378 |
2383 |
-17 |
|
Sokolsky |
27640 |
26893 |
26208 |
25619 |
25086 |
24563 |
24100 |
23663 |
23332 |
23068 |
22798 |
-18 |
|
Nyuksensky |
4669 |
4464 |
4296 |
4129 |
4044 |
3940 |
3906 |
3868 |
3816 |
3792 |
3790 |
-19 |
|
Cherepovetsky |
21612 |
20974 |
20440 |
19870 |
19462 |
18993 |
18598 |
18185 |
17876 |
17596 |
17356 |
-20 |
|
Vytegorsky |
12958 |
12544 |
12204 |
11825 |
11515 |
11212 |
10945 |
10766 |
10625 |
10512 |
10393 |
-20 |
|
Velikoustyugsky |
30068 |
29199 |
28398 |
27620 |
27016 |
26392 |
25839 |
25294 |
24792 |
24396 |
24059 |
-20 |
|
Vashkinsky |
3388 |
3178 |
3007 |
2881 |
2771 |
2706 |
2699 |
2665 |
2692 |
2684 |
2669 |
-21 |
|
Gryazovetsky |
18507 |
17890 |
17377 |
16850 |
16350 |
15939 |
15537 |
15133 |
14821 |
14634 |
14382 |
-22 |
|
Chagodoshchensky |
6462 |
6253 |
6052 |
5860 |
5674 |
5517 |
5369 |
5275 |
5176 |
5078 |
4978 |
-23 |
|
Kichm.-Gorodetsky |
8875 |
8587 |
8318 |
8089 |
7874 |
7648 |
7442 |
7231 |
7073 |
6887 |
6754 |
-24 |
|
Kharovsky |
7353 |
7049 |
6813 |
6590 |
6415 |
6264 |
6106 |
5962 |
5814 |
5678 |
5572 |
-24 |
|
Syamzhensky |
4402 |
4256 |
4106 |
3956 |
3825 |
3686 |
3611 |
3507 |
3422 |
3354 |
3314 |
-25 |
|
Babushkinsky |
6469 |
6266 |
6058 |
5840 |
5601 |
5411 |
5221 |
5083 |
4947 |
4885 |
4853 |
-25 |
|
Nikolsky |
11535 |
11144 |
10757 |
10464 |
10108 |
9790 |
9471 |
9194 |
8920 |
8629 |
8405 |
-27 |
|
Vozhegodsky |
8205 |
7865 |
7576 |
7290 |
7036 |
6812 |
6589 |
6399 |
6208 |
6074 |
5932 |
-28 |
|
Belozersky |
7745 |
7404 |
7085 |
6765 |
6469 |
6178 |
5947 |
5707 |
5530 |
5361 |
5187 |
-33 ▼ |
Note. Sorted in ascending order of the relative decline in labor potential; the forecast was made by the method of shifting ages under the assumption that the 2015 mode of reproduction will be preserved (age-sex structure, migration and mortality, and age structure of fertility) for the whole forecast period.
Sources: Vozrastno-polovoi sostav naseleniya Vologodskoi oblasti v 2014 godu: stat. sbornik [Age-sex composition of the population of the Vologda Oblast in 2014: statistics collection]. Vologdastat. Vologda, 2015. 97 p.; author’s calculations.
that modern labor potential structure defines a kind of “initial” state that largely determines further development prospects.
Forecasting the number of population using the classical method of shifting ages shows that given the current population structure in municipal districts, modern reproduction parameters will lead to significant losses of labor potential in the near future (Tab. 4). An increase in the number of working age population is expected only in Vologodsky District.
Figure 2. Structure of labor potential quality
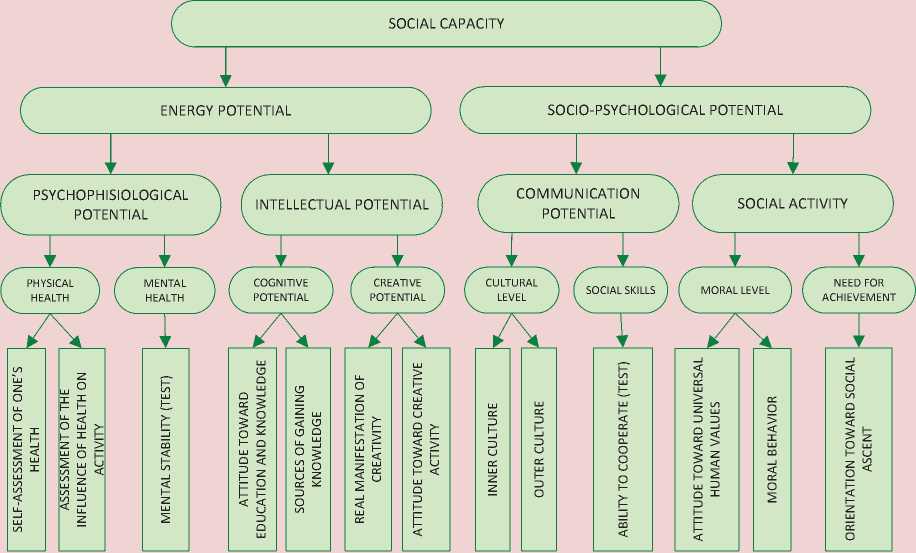
Source: Shabunova A.A. (Ed.), Leonidova G.V., Ustinova K.A., Popov A.V., Panov A.M., Golovchin M.A., Solov’eva T.S., Chekmareva E.A. Problemy effektivnosti gosudarstvennogo upravleniya. Chelovecheskii kapital territorii: problemy formirovaniya i ispol’zovaniya: monografiya [Issues of public administration effectiveness. Human capital of the territory: problems of accumulation and exploitation: monograph]. Vologda: ISERT RAN, 2013. 184 p.
Reproduction of labor potential quality in municipal districts of the Vologda Oblast arouses concern as well. As noted above, in qualitative terms, the employment potential in a municipal district is determined by qualitative characteristics of working age population. In this study, we adhered to the theoretical and methodological approach to structuring and assessing qualitative characteristics of population, developed by researchers at RAS Institute of Social and Economic Studies of Population under the leadership of N.M. Rimashevskaya [3, 11]; thus we highlighted the following qualitative components in labor potential: physical and mental health, cognitive capacity, creativity, communication skills, cultural and moral levels, and the need for achievement. Thus, social capacity is considered an integral characteristic of labor potential quality (Fig. 2).
These qualities can be assessed with the help of a tested methodology for sociological measurement; as a result of its application, the components of the labor potential components receive a numerical score in the form of indices from zero to one. In Vologda, such measurements are conducted by the Institute of Socio-
Economic Development of Territories of RAS [2, 4, 14] since 1996. A survey of the first year was pilot, and since 1997 sociological assessment labor potential quality are carried out in a monitoring mode (until 2009 – annually, then – once in two years).
Monitoring of the regional labor potential is carried out with the help of questionnaire survey of working age population. The survey is characterized by the following features: the object of study is the working age population of the Vologda Oblast. The surveys are carried out annually in August – September in the cities of Vologda and Cherepovets and in eight districts (Babaevsky, Velikoustyugsky, Vozhegodsky, Gryazovetsky, Kirillovsky, Nikolsky, Tarnogsky and Sheksninsky). The sample size is 1,500 people. The sampling method is zoning with the proportional location of observation units. The quota sample by sex and age is used. The magnitude of random sampling error is 3–4% under the confidence interval of 4–5%.
The assessments have shown that the quality of labor potential has its differences in terms of municipalities. Thus, among the territories of the oblast, the highest index values of capacity are observed traditionally in the major cities – in Vologda and Cherepovets. Moreover, since 2008, labor potential quality in Cherepovets residents exceeds that in Vologda residents. In particular, in 2014 the index of social capacity for Cherepovets residents was equal to 0.695 units, and for Vologda residents – only 0.680 units (Fig. 3) . In municipal districts of the
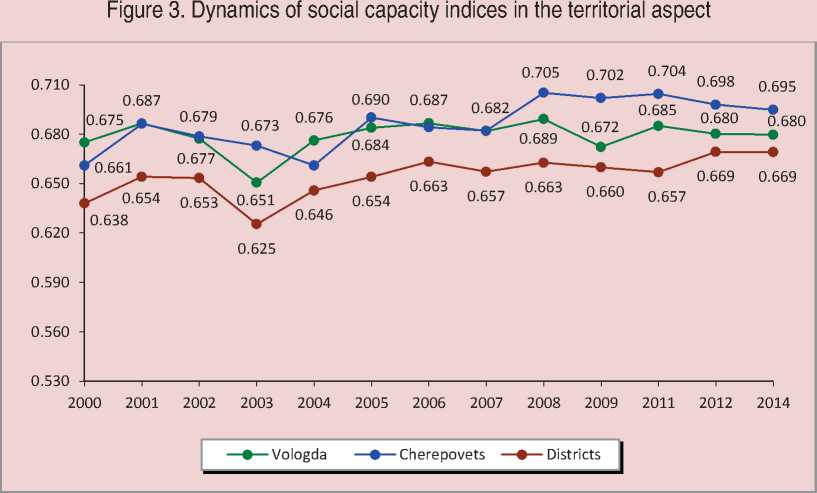
Source: Monitoring of the qualitative condition of labor potential of the population in the Vologda Oblast. ISEDT RAS.
Vologda oblast, the quality of labor potential is consistently lower (in 2014 – 0.669 units), which is due, primarily, to educational and labor migration to big cities that offer a wide range of educational services and a higher standard of living, and attract the best employees from the districts.
If we consider the primary qualitative characteristics of labor potential, which make up an integrated index, we can see that currently (according to the monitoring results, 2014) the districts lag behind the cities according to the majority of indicators (Tab. 5).
The indices of social skills, and cultural and moral level are an exception. That is, residents who live in the districts compared to those who live in Vologda and Cherepovets are more sociable and are on average more conservative in matters of culture and morality.
In comparison with the indicators of 2000, the quality of labor potential in the oblast has grown according to the majority of indicators, except for the creative
Table 5. Indices of labor potential quality in municipal districts and city districts of the Vologda Oblast in 2000 and 2014
|
Quality |
2000 |
2014 |
Dynamics, in % to 2000 |
||||||
|
Vologda |
Cherepovets |
Districts |
Vologda |
Cherepovets |
Districts |
Vologda |
Cherepovets |
Districts |
|
|
Basic qualities of the 1st level |
|||||||||
|
Physical health |
0.686 |
0.666 |
0.678 |
0.750 |
0.771 |
0.747 |
+9.3 |
+15.7 |
+10.2 |
|
Mental health |
0.715 |
0.690 |
0.675 |
0.793 |
0.802 |
0.738 |
+10.8 |
+16.3 |
+9.3 |
|
Cognitive potential |
0.665 |
0.648 |
0.614 |
0.627 |
0.635 |
0.617 |
-5.7 |
-1.9 |
+0.5 |
|
Creative potential |
0.620 |
0.589 |
0.560 |
0.597 |
0.583 |
0.535 |
-3.8 |
-0.9 |
-4.5 |
|
Social skills |
0.739 |
0.738 |
0.718 |
0.739 |
0.760 |
0.767 |
+0.1 |
+3.0 |
+6.8 |
|
Cultural level |
0.651 |
0.649 |
0.589 |
0.650 |
0.683 |
0.697 |
-0.1 |
+5.2 |
+18.3 |
|
Moral level |
0.759 |
0.782 |
0.774 |
0.772 |
0.782 |
0.788 |
+1.7 |
+0.02 |
+1.8 |
|
Need for achievement |
0.644 |
0.615 |
0.611 |
0.661 |
0.665 |
0.634 |
+2.7 |
+8.2 |
+3.7 |
|
Qualities of the 2nd level |
|||||||||
|
Psychophysiological potential |
0.697 |
0.674 |
0.672 |
0.766 |
0.781 |
0.736 |
+9.8 |
+15.9 |
+9.6 |
|
Intellectual potential |
0.638 |
0.614 |
0.582 |
0.606 |
0.604 |
0.570 |
-5.0 |
-1.7 |
-2.1 |
|
Communication potential |
0.690 |
0.689 |
0.645 |
0.688 |
0.716 |
0.724 |
-0.3 |
+4.0 |
+12.3 |
|
Social activity |
0.694 |
0.688 |
0.681 |
0.705 |
0.716 |
0.697 |
+1.7 |
+4.1 |
+2.2 |
|
Qualities of the 3rd level |
|||||||||
|
Energy potential |
0.663 |
0.639 |
0.620 |
0.676 |
0.682 |
0.642 |
+1.9 |
+6.8 |
+3.5 |
|
Socio-psychological potential |
0.689 |
0.686 |
0.660 |
0.691 |
0.712 |
0.705 |
+0.2 |
+3.9 |
+6.9 |
|
Integral indicator of labor potential quality |
|||||||||
|
Capacity |
0.675 |
0.661 |
0.638 |
0.680 |
0.695 |
0.669 |
+0.7 |
+5.2 |
+4.9 |
|
Source: Monitoring of the qualitative condition of labor potential of the population in the Vologda Oblast. ISEDT RAS. |
|||||||||
Table 6. Correspondence of labor potential quality to job requirements in the municipal districts and urban districts of the Vologda Oblast in 2014, indices
Furthermore, comparison of indices of labor potential quality with the indices of job requirements leads to the conclusion that labor potential in the Vologda Oblast municipal districts does not meet the requirements of jobs in all positions, with the exception of physical health (Tab. 6).
The largest gap is observed in the creative potential of the population, the second place belongs to cognitive potential. In urban districts, on the contrary, employers’ requirements to cognitive potential are much higher, so the difference between the existing level of knowledge development and the level that is required becomes especially relevant. That is, in districts and cities of the Vologda Oblast the intellectual potential of employees corresponds least of all to job requirements. Social skills and mental health of working age population are factors that are closest by level of their development to employers’ requirements.
The lack of correspondence between labor potential quality and job requirements causes problems in the distribution and redistribution of labor resources, creating obstacles to the full and effective use of labor potential.
Distribution of labor potential . Distribution of labor potential includes the following aspects: territorial and geographical distribution of workforce; distribution of employees by types of economic activity and sectors of the economy; distribution between the public and private sectors; professionalqualification distribution; distribution by specific jobs in enterprises and institutions, and others. Here, a full-fledged analysis of labor potential distribution depends significantly on the statistics available.
Statistical estimation of distribution of the number of people employed in the economy by sex and age, types economic activity, level of education, status in the main job, type of employment contract, groups of occupations on the main job and by other criteria is carried out by the Federal State Statistics Service in the framework of the Survey of population on employment issues (Labor Force Survey)1 carried out since 1992 in all regions of the Russian Federation on the basis of the sample method of observation with the subsequent distribution of the results to the entire population of the surveyed age. The observation units are presented by households and the persons 15 to 72 years of age are members of these households; and data weighting and distribution is carried out at the level of constituent entity of the Russian Federation. The procedure consists in comparing the sample by constituent entity of the Russian Federation (the number of surveyed citizens) with the general population according to current calculations, stratified by these same characteristics2.
Thus the sample is representative only at the level of the whole region and unrepresentative at the level of individual municipalities, that is, statistics on the distribution of employed in the economy in the context of municipalities is not collected.
Among the data on the distribution of labor potential by districts of the Vologda Oblast we should note the distribution of employees by types of economic activity, which is calculated by Vologdastat in all the districts of the oblast on the basis of the data collected in statistical observation form No. 1-T “Data on the number and wages of workers by types of activity”.
Table 7 shows that the distribution of labor potential by types of economic activity has its own specific features in the districts. For example, in Babaevsky District, the highest proportion of the population is employed in transport and communications (31%); and in Sokolsky
District, about one third of employees work in industry, this is associated with economic structure of these districts.
Economic restructuring is a complex process, it takes a long time, whereby the proportions of the quantitative distribution of labor potential by economic activities
Table 7. Distribution of the number of employees of organizations by types of economic activity in 2014, %
|
Municipal district |
Type of economic activity |
||||||||||||
|
1 |
2 |
3 |
4 |
5 |
6 |
7 |
8 |
9 |
10 |
11 |
12 |
13 |
|
|
Babaevsky |
7.1 |
2.9 |
5.0 |
2.2 |
8.6 |
0.5 |
31.1 |
0.4 |
2.5 |
13.0 |
13.0 |
10.2 |
3.5 |
|
Babushkinsky |
5.1 |
5.0 |
5.5 |
4.3 |
16.7 |
1.9 |
3.3 |
0.9 |
0.5 |
10.7 |
23.8 |
18.3 |
4.0 |
|
Belozersky |
12.5 |
7.8 |
6.6 |
2.2 |
9.5 |
0.7 |
10.7 |
0.4 |
4.6 |
14.4 |
14.8 |
11.3 |
3.7 |
|
Vashkinsky |
14.6 |
7.3 |
7.1 |
1.1 |
10.9 |
0.4 |
3.5 |
0.4 |
1.6 |
14.4 |
17.8 |
14.3 |
6.7 |
|
Velikoustyugsky |
6.4 |
16.6 |
5.8 |
3.3 |
8.2 |
2.3 |
5.6 |
2.1 |
4.8 |
9.1 |
16.3 |
13.6 |
5.8 |
|
Verkhovazhsky |
24.0 |
8.2 |
5.3 |
2.5 |
10.2 |
0.2 |
3.2 |
0.8 |
1.3 |
11.3 |
18.6 |
9.3 |
5.1 |
|
Vozhegodsky |
19.8 |
3.7 |
9.4 |
0.7 |
12.5 |
х |
5.0 |
0.5 |
3.5 |
12.4 |
13.1 |
14.4 |
3.9 |
|
Vologodsky |
32.2 |
5.9 |
5.2 |
1.9 |
7.4 |
0.9 |
6.1 |
0.1 |
4.8 |
5.7 |
12.9 |
13.5 |
3.3 |
|
Vytegorsky |
22.1 |
5.1 |
6.5 |
3.8 |
11.8 |
1.0 |
11.6 |
0.5 |
2.3 |
9.2 |
13.2 |
6.7 |
3.9 |
|
Gryazovetsky |
16.5 |
13.4 |
6.8 |
2.4 |
6.9 |
1.1 |
17.9 |
0.5 |
4.1 |
7.4 |
12.8 |
6.3 |
3.9 |
|
Kaduysky |
3.9 |
21.4 |
17.8 |
4.6 |
7.0 |
1.0 |
5.2 |
0.4 |
6.5 |
6.8 |
12.6 |
5.2 |
4.3 |
|
Kirillovsky |
12.0 |
3.8 |
10.1 |
3.5 |
9.0 |
1.8 |
5.4 |
0.4 |
2.0 |
14.7 |
12.8 |
13.8 |
8.8 |
|
Kichm.-Gorodetsky |
17.0 |
11.3 |
х |
х |
14.1 |
х |
3.3 |
0.8 |
3.0 |
8.4 |
20.0 |
14.1 |
4.7 |
|
Mezhdurechensky |
17.3 |
2.4 |
10.2 |
х |
8.0 |
х |
4.5 |
1.0 |
3.2 |
16.3 |
18.2 |
12.5 |
6.0 |
|
Nicholsky |
12.7 |
5.0 |
5.3 |
0.4 |
10.2 |
0.9 |
7.4 |
0.6 |
2.4 |
13.2 |
23.5 |
14.6 |
4.0 |
|
Nyuksensky |
5.7 |
2.6 |
5.8 |
7.1 |
7.2 |
0.8 |
27.7 |
0.7 |
3.9 |
9.1 |
14.4 |
9.4 |
5.4 |
|
Sokolsky |
3.8 |
32.3 |
6.8 |
3.3 |
5.3 |
0.8 |
5.8 |
0.4 |
2.6 |
10.2 |
13.6 |
11.5 |
3.1 |
|
Syamzhensky |
18.8 |
5.1 |
6.2 |
0.2 |
11.1 |
х |
5.9 |
0.9 |
2.8 |
15.1 |
14.6 |
14.0 |
4.3 |
|
Tarnogsky |
16.7 |
6.4 |
7.1 |
4.2 |
13.3 |
х |
1.6 |
1.0 |
2.3 |
10.1 |
17.5 |
13.4 |
5.4 |
|
Totemsky |
11.8 |
6.6 |
8.5 |
4.8 |
10.2 |
0.9 |
13.5 |
0.7 |
1.9 |
11.3 |
16.5 |
8.7 |
4.1 |
|
Ust-Kubinsky |
12.6 |
7.4 |
6.3 |
2.9 |
11.0 |
х |
3.6 |
0.7 |
0.9 |
16.1 |
16.5 |
14.7 |
7.4 |
|
Ustyuzhensky |
15.3 |
13.6 |
8.1 |
0.4 |
8.2 |
х |
2.4 |
0.9 |
2.8 |
12.1 |
17.3 |
14.3 |
4.6 |
|
Kharovsky |
5.7 |
14.9 |
8.7 |
1.0 |
8.6 |
х |
7.2 |
0.7 |
4.9 |
15.4 |
15.8 |
12.0 |
4.9 |
|
Chagodoshchensky |
10.1 |
32.6 |
5.7 |
х |
11.8 |
0.9 |
3.0 |
0.8 |
2.9 |
5.8 |
12.2 |
8.3 |
5.6 |
|
Cherepovetsky |
24.8 |
8.2 |
6.1 |
1.5 |
10.8 |
1.7 |
4.6 |
х |
3.1 |
4.6 |
17.9 |
10.2 |
5.8 |
|
Sheksninsky |
10.3 |
22.5 |
5.2 |
2.0 |
7.0 |
3.1 |
9.5 |
0.5 |
4.7 |
10.9 |
10.7 |
9.6 |
3.8 |
Legend: 1 – agriculture, hunting and forestry, 2 – manufacturing, 3 – production and distribution of electricity, gas and water 4 – construction 5 – wholesale and retail trade; repair of motor vehicles and household goods, 6 – hotels and restaurants, 7 – transport and communication, 8 – financial activity, 9 – real estate transactions, renting and provision of services, 10 – public administration and military security, social insurance, 11 – education 12 – health care and social services, 13 – other housing and utilities, social and personal services.
Sources: Trud i zanyatost’ v razreze raionov i gorodov Vologodskoi oblasti v 2014 godu: stat. byulleten’ [Labor and employment in districts, cities and town of the Vologda Oblast in 2014: statistics newsletter]. Vologdastat. Vologda, 2015. 62 p. Pp. 11-12; author’s calculations.
are relatively stable in the short term. The situation becomes very different, if we consider the annual movement of workers in the enterprises and organizations of the oblast. Thus, according to Vologdastat, from 16% (in Tarnogsky District) to 50% (in Cherepovets) of the average staffing number of employees were renovated in 2014 in the municipal districts. That is the number of new people employed in a year at the newly created workplaces or instead of those who quitted their job (Tab. 8).
At the same time from 43 to 80% of those who resigned from their position on their own accord. The reasons for this personnel rotation can be very different and require further study. In general, we have to admit that the scarcity of available
Table 8. Movement of employees in municipal and urban districts of the Vologda Oblast in 2014*
|
Municipal district / urban district |
Workers employed |
Workers who quitted their job |
Resigned from their position on their own accord, in % of the total number of those who quitted their job |
|||
|
people |
in % of average payroll count |
people |
in % of average payroll count |
|||
|
Tarnogsky |
273 |
16.2 |
324 |
19.3 |
74.7 |
|
|
Kichm.-Gorodetsky |
437 |
18.8 |
547 |
23.5 |
57.4 |
|
|
Kirillovsky |
792 |
19.5 |
883 |
21.8 |
57.4 |
|
|
Vashkinsky |
237 |
20.0 |
271 |
22.9 |
76.4 |
|
|
Mezhdurechensky |
191 |
20.8 |
229 |
24.9 |
77.7 |
|
|
Vologodsky |
1839 |
20.9 |
2307 |
26.2 |
73.1 |
|
|
Babushkinsky |
293 |
21.6 |
299 |
22.1 |
53.5 |
|
|
Ust-Kubinsky |
246 |
22.4 |
271 |
24.7 |
70.8 |
|
|
Nikolsky |
793 |
22.7 |
1068 |
30.5 |
57.0 |
|
|
Babaevsky |
1315 |
23.5 |
1528 |
27.3 |
56.1 |
|
|
Cherepovets |
22489 |
24.1 |
36668 |
39.3 |
43.3 |
|
|
Syamzhensky |
418 |
24.2 |
486 |
28.1 |
71.6 |
|
|
Velikoustyugsky |
2942 |
24.8 |
3253 |
27.4 |
62.8 |
|
|
Sheksninsky |
1877 |
25.0 |
1909 |
25.5 |
60.1 |
|
|
Gryazovetsky |
2297 |
25.5 |
2872 |
31.9 |
50.0 |
|
|
Vozhegodsky |
583 |
25.6 |
664 |
29.2 |
56.3 |
|
|
Verkhovazhsky |
664 |
26.7 |
705 |
28.3 |
65.8 |
|
|
Ustyuzhensky |
752 |
27.1 |
930 |
33.5 |
79.9 |
|
|
Belozersky |
948 |
27.3 |
1163 |
33.5 |
55.0 |
|
|
Totemsky |
1676 |
27.6 |
1857 |
30.6 |
65.5 |
|
|
Vologda |
28645 |
29.2 |
32382 |
33.0 |
70.6 |
|
|
Kaduysky |
1217 |
31.7 |
1359 |
35.4 |
66.2 |
|
|
Vytegorsky |
1731 |
32.2 |
2338 |
43.5 |
44.1 |
|
|
Sokolsky |
3877 |
32.9 |
4547 |
38.6 |
66.5 |
|
|
Chagodoshchensky |
748 |
33.4 |
683 |
30.5 |
60.9 |
|
|
Nyuksensky |
774 |
35.6 |
585 |
26.9 |
55.0 |
|
|
Kharovsky |
960 |
37.5 |
1186 |
46.4 |
59.3 |
|
|
Cherepovetsky |
2272 |
50.5 |
3115 |
69.2 |
49.7 |
|
* Excluding small businesses and organizations with average number of employees up to 15 people, not related to small businesses; sorted by ascending order of the share of employed workers.
Source: Trud i zanyatost’ v razreze raionov i gorodov Vologodskoi oblasti v 2014 godu: stat. byulleten’ [Labor and employment in districts, cities and town of the Vologda Oblast in 2014: statistics newsletter]. Vologdastat. Vologda, 2015. 62 p. P. 37.
statistical data makes it difficult to analyze the phases of distribution of labor potential, especially at the municipal level. To solve this problem, it is necessary to resort to sociological polls, and in some cases with a certain degree of conditionality it is possible to use the data for the region as a whole.
According to the results of the monitoring of the quality status of labor potential in the Vologda Oblast, a specific feature of labor mobility of working population compared with residents of large cities consists in a lower prevalence of the practice of work in the same place and in a greater proportion of those who changed jobs at least four times (Tab. 9). Thus as the reason due to which they changed jobs, the employed residents of districts more often indicate low wages (47% vs. 41% in urban districts) and are less likely to complain about hard work (4% vs 8% in Cherepovets and 11% – in Vologda).
When searching for employment, district residents are much less likely to turn to recruitment agencies (in particular, because of their low prevalence), and instead they prefer to seek employment independently or through the state employment service. So, according to the 2014 survey, 13.5% of working population of municipal districts of the Vologda Oblast found a job with the help of the state employment service, while in Vologda this method of job search was used by 12.7% of workers and in Cherepovets – by 10.2% (Tab. 10) .
Table 9. Labor mobility of the working population of working age in municipal districts and urban districts of the Vologda Oblast in 2014, %
|
Territory |
Did you change your place of employment during your working life? |
||||
|
No, I’ve always been in one and the same profession |
I changed one place of employment |
I changed two places of employment |
I changed three places of employment |
I changed four and more places of employment |
|
|
Vologda |
29.6 |
16.0 |
18.3 |
20.4 |
15.7 |
|
Cherepovets |
33.2 |
19.7 |
18.4 |
15.1 |
13.5 |
|
Districts |
27.6 |
14.3 |
15.3 |
14.1 |
28.8 |
Source: Monitoring of the qualitative condition of labor potential of the population in the Vologda Oblast. ISEDT RAS.
Table 10. Distribution of the working population of working age by way of finding a job in municipal districts and urban districts of the Vologda Oblast in 2014, %
|
Territory |
How did you find you present job? |
||||
|
Through the state employment service |
Through a recruiting agency |
With the help of friends and acquaintances |
On my own, without any intermediaries |
Other |
|
|
Vologda |
12.7 |
4.1 |
31.7 |
50.3 |
1.2 |
|
Cherepovets |
10.2 |
10.9 |
36.5 |
41.4 |
1.0 |
|
Districts |
13.5 |
1.6 |
28.6 |
55.1 |
1.2 |
Source: Monitoring of the qualitative condition of labor potential of the population in the Vologda Oblast. ISEDT RAS.
If we consider the distribution of workers according to forms of ownership, we will notice the following feature: currently, only 35% of workers are employed at state or municipal enterprises in the districts. For comparison: in Vologda the figure is 10% higher – 45%, in Cherepovets – 34%. This similarity between the districts and the city of Cherepovets is not the only one. There is another one: the proportion of working professions in Cherepovets and districts is 48%, while in Vologda – only 27%. Thus, regardless of territory, the proportion of people working within their obtained specialty in the districts and urban districts of the Vologda Oblast is approximately 60% of the number of employees who have obtained a specialty. That is, about 40% of employees work not within their obtained specialty. This indicated the presence of significant problems in the formation and allocation of labor resources, and raises a question of efficiency of labor potential utilization.
Use of labor potential. The use (or implementation) is the final phase of the reproductive movement of labor potential. The rate of registered unemployment (Tab. 11) is often wrongly applied as an indicator of the rate of utilization of labor potential of the territory.
Actually, this figure reflects not the level of utilization of labor capacity of society, but the level of under-utilization of labor force. The estimate of employment rate of working age population – the main indicator of the degree of utilization of the quantitative aspect of labor potential – is not carried out for the municipal districts by the Federal State Statistics Service.
In order to assess the extent to which the people implement their qualities and skills in a specific labor activity in the framework of the monitoring of labor potential we have developed a special methodology based on the unit of questions, “How much do you “commit yourself” to work? To what extent do you use your qualities and skills?” Having applied this methodology, we obtained an indicator that reflects the percentage by which the quality of labor potential is implemented – a kind of equivalent of the level of employment showing the percentage by which the amount of labor potential is implemented. The indicator calculated in this way was conventionally called the level of implementation of labor potential quality [15].
Currently, the population of the Vologda Oblast mostly uses social skills in (Tab. 12) , which, in our opinion, is connected with the development of the services sector. Creativity (resourcefulness, ability to solve unfamiliar tasks, etc.) and the need for achievement (desire for promotion, initiative and entrepreneurship) are used least of all according to people’s assessments.
Among the oblast’s territories, its municipal districts have the lowest level of implementation of the majority of components of labor potential quality. That is, in the regions of the Vologda Oblast,
Table 11. Registered unemployment rate in municipal districts and urban districts of the Vologda Oblast, in % to economically active population*
|
Municipal district / urban district |
2000 |
2005 |
2009 |
2010 |
2011 |
2012 |
2013 |
2014 |
|
|
Sheksninsky |
2.2 |
1.5 |
2.1 |
1.7 |
1.0 |
0.8 |
0.7 |
0.6 |
|
|
Vologodsky |
3.0 |
2.5 |
3.0 |
2.3 |
1.8 |
1.2 |
0.9 |
0.9 |
|
|
Vologda |
1.3 |
0.9 |
3.1 |
2.0 |
1.4 |
1.1 |
0.8 |
0.9 |
|
|
Totemsky |
1.9 |
2.2 |
3.2 |
2.5 |
1.6 |
1.4 |
1.1 |
1.1 |
|
|
Cherepovetsky |
0.3 |
0.7 |
3.5 |
1.8 |
1.3 |
1.2 |
1.1 |
1.1 |
|
|
Cherepovets |
0.9 |
0.7 |
4.1 |
2.0 |
1.4 |
1.1 |
1.1 |
1.1 |
|
|
Nyuksensky |
1.7 |
1.7 |
2.9 |
2.6 |
1.1 |
1.0 |
1.5 |
1.3 |
|
|
Babaevsky |
1.5 |
2.4 |
2.8 |
2.2 |
1.4 |
1.1 |
1.0 |
1.4 |
|
|
Babushkinsky |
1.1 |
1.9 |
2.7 |
2.0 |
1.4 |
1.6 |
1.9 |
1.4 |
|
|
Ust-Kubinsky |
7.4 |
2.0 |
2.5 |
2.2 |
1.7 |
1.3 |
1.6 |
1.6 |
|
|
Kharovsky |
2.5 |
4.0 |
3.1 |
4.4 |
3.4 |
2.0 |
1.8 |
1.6 |
|
|
Vozhegodsky |
2.7 |
4.3 |
3.5 |
3.7 |
2.9 |
1.9 |
1.3 |
1.7 |
|
|
Nikolsky |
1.5 |
1.8 |
2.3 |
1.9 |
1.9 |
1.5 |
1.7 |
1.7 |
|
|
Sokolsky |
1.6 |
1.8 |
5.6 |
2.8 |
2.0 |
1.5 |
1.1 |
1.7 |
|
|
Verkhovazhsky |
1.3 |
3.6 |
3.6 |
2.8 |
2.2 |
2.6 |
2.0 |
1.8 |
|
|
Kaduysky |
2.5 |
2.9 |
3.9 |
2.9 |
2.4 |
1.8 |
1.4 |
1.8 |
|
|
Tarnogsky |
1.5 |
2.2 |
2.5 |
1.8 |
1.6 |
1.5 |
1.7 |
1.8 |
|
|
Gryazovetsky |
3.7 |
3.1 |
5.9 |
3.8 |
2.6 |
2.0 |
1.7 |
1.9 |
|
|
Kichm.-Gorodetsky |
1.3 |
1.9 |
3.3 |
2.0 |
2.2 |
2.4 |
1.7 |
1.9 |
|
|
Syamzhensky |
3.0 |
3.6 |
3.9 |
3.8 |
2.6 |
2.0 |
1.7 |
1.9 |
|
|
Vashkinsky |
2.7 |
4.2 |
3.6 |
3.3 |
2.6 |
1.5 |
1.7 |
2.0 |
|
|
Kirillovsky |
2.0 |
3.5 |
3.3 |
3.9 |
2.7 |
2.2 |
1.8 |
2.0 |
|
|
Velikoustyugsky |
2.1 |
4.4 |
5.3 |
3.2 |
2.2 |
3.1 |
2.5 |
2.3 |
|
|
Ustyuzhensky |
4.0 |
3.7 |
3.4 |
3.4 |
3.2 |
2.6 |
2.0 |
2.4 |
|
|
Chagodoshchensky |
3.6 |
6.6 |
4.9 |
3.2 |
2.9 |
2.5 |
6.5 |
2.4 |
|
|
Vytegorsky |
1.4 |
3.9 |
3.5 |
2.6 |
2.7 |
2.6 |
2.3 |
2.5 |
|
|
Belozersky |
3.0 |
2.9 |
4.3 |
3.6 |
3.0 |
2.5 |
2.4 |
2.6 |
|
|
Mezhdurechensky |
2.6 |
3.0 |
4.4 |
3.7 |
3.4 |
3.2 |
2.7 |
2.6 |
* Sorted by the data for 2014 by increase in unemployment level.
Source: Munitsipal’nye raiony i gorodskie okruga Vologodskoi oblasti. Sotsial’no-ekonomicheskie pokazateli. 2000–2014: stat. sb. [Municipal districts and urban districts of the Vologda Oblast. Socio-economic indicators. 2000-2014: statistics collection]. Vologdastat.
Vologda, 2015. 307 p. P. 24.
there is such a situation when the low quality of labor potential is accompanied by low level of its implementation in work activity, that is, in our opinion, a very negative phenomenon. Residents of the city of Cherepovets are leaders in the implementation of labor potential.
As we seen, the low level of labor potential utilization in municipal districts of the Vologda Oblast is a natural result of problems that have accumulated in the formation and distribution of labor potential. The source of these problems and their underlying causes should be
Table 12. Level of implementation of labor potential quality in municipal districts and urban districts of the Vologda Oblast in 2014, %
|
Territory |
Property |
Average |
|||||||
|
Physical health |
Mental health |
Cognitive potential |
Creative potential |
Social skills |
Cultural level |
Moral level |
Need for achievement |
||
|
Vologda |
78.0 |
81.7 |
80.1 |
71.5 |
83.2 |
82.5 |
81.8 |
71.0 |
78.7 |
|
Cherepovets |
79.4 |
82.0 |
82.3 |
71.3 |
84.2 |
80.7 |
81.5 |
73.0 |
79.3 |
|
Districts |
76.6 |
76.6 |
74.7 |
72.6 |
82.0 |
81.2 |
81.4 |
73.1 |
77.3 |
Source: Monitoring of the qualitative condition of labor potential of the population in the Vologda Oblast. ISEDT RAS.
searched at both the macro- and microlevels. The analysis of behavior of individual human agents living in the territory of a particular municipality is no less important than the analysis of the macroeconomic conditions and the environment for functioning of labor potential.
The analysis of labor potential reproduction and the consideration of the three successive phases of this process allow us to conclude that the structure of labor potential and trends in its formation, distribution and use in the municipal districts of the Vologda Oblast are extremely unfavorable. Since 2000, the population of working age in half of the districts of the oblast has reduced by more than a quarter. There is no full recovery and resumption of the functioning of labor potential: we are witnessing its narrowed reproduction. A feature of labor potential reproduction in the municipal districts consists in the substantial differentiation in age structure and rate of change of the number of working age population. Along with the decline in the amount of labor potential, the main problems of its reproduction in the districts include the reduction of creative potential and a significant gap between the actual level of development of qualities of working age population and job requirements. The reasons for these adverse changes require further research, but the main reason, in our opinion, is accurately formulated by scientists of the National Research University Higher School of Economics: “In the period of systemwide transformation a significant part of human capital inherited from the previous era has undergone partial or complete erosion, because under the new market conditions it actually turned out to be useless”. [12, p. 24].
References Research into the conditions and drivers of labor potential reproduction in the Vologda oblast municipal districts
- Gorshkov M.K. Rossiiskii mentalitet v sotsiologicheskom izmerenii . Sotsiologicheskie issledovaniya , 2008, no. 6, pp. 100-114..
- Gulin K.A., Shabunova A.A., Chekmareva E.A. Trudovoi potentsial regiona . Vologda: ISERT RAN, 2009. 84 p..
- Rimashevykaya N.M., Kopnina V.G. (Eds.). Kachestvo naseleniya . Moscow: ISEPN, 1993. 185 p..
- Ilyin V.A., Smirnova N.A., Timofeeva Ya.B Kachestvo trudovogo potentsiala naseleniya Vologodskoi oblasti . Vologda: VNKTs TsEMI RAN, 1998. 76 p..
- Kontseptsiya ustoichivogo razvitiya sel'skikh territorii Rossiiskoi Federatsii na period do 2020 goda: utv. rasporyazheniem Pravitel'stva Rossiiskoi Federatsii ot 30 noyabrya 2010 g. № 2136-r Available at: http://www.mcx.ru/documents/document/show/14914.77.htm..
- Leonidova G.V., Chekmareva E.A. Opyt otsenki kachestva trudovogo potentsiala na regional'nom urovne . Chelovek i trud , 2009, no. 12, pp. 30-33..
- Marshalova A.S., Novoselov A.S. Problemy upravleniya sotsial'no-ekonomicheskim razvitiem munitsipal'nykh obrazovanii . Region: ekonomika i sotsiologiya , 2009, no. 1, pp. 167-179..
- Maslova I.S. Trudovoi potentsial sovetskogo obshchestva: voprosy teorii i metodologii issledovaniya . Moscow, 1987. 32 p..
- Pankratov A.S. Trudovoi potentsial: sotsial'no-ekonomicheskie aspekty upravleniya protsessom ego vosproizvodstva: dis. v vide nauch. dokl. na soisk. uch. st. d.e.n.: 08.00.05 . Moscow, 1993. 60 p..
- Shabunova A.A. (Ed.), Leonidova G.V., Ustinova K.A., Popov A.V., Panov A.M., Golovchin M.A., Solov'eva T.S., Chekmareva E.A. Problemy effektivnosti gosudarstvennogo upravleniya. Chelovecheskii kapital territorii: problemy formirovaniya i ispol'zovaniya: monografiya . Vologda: ISERT RAN, 2013. 184 p..
- Rimashevskaya N.M. O metodologii opredeleniya kachestvennogo sostoyaniya naseleniya . Demografiya i sotsiologiya , 1993, no. 6, pp. 7-21..
- Gimpel'son V.E., Kapelyushnikov R.I. Rossiiskii rabotnik: obrazovanie, professiya, kvalifikatsiya: monografiya . Moscow: GU-VShE, 2011. 574 p..
- Toksanbaeva M.S. Sotsial'no-ekonomicheskie faktory vosproizvodstva trudovogo potentsiala v sovremennoi Rossii: avtoref. dis. na soisk. uch. st. d.e.n.: 08.00.05 . Moscow, 2007. 40 p.
- Ilyin V.A., Gulin K.A., Leonidova G.V., Davydova V.V. Trudovoi potentsial regiona: sostoyanie i razvitie . Vologda: VNKTs TsEMI RAN, 2004. 107 p..
- Chekmareva E.A. Povyshenie urovnya realizatsii trudovogo potentsiala: rol' zarabotnoi platy . Ekonomicheskie i sotsial'nye peremeny: fakty, tendentsii, prognoz , 2011, no. 2(14), pp. 165-172..
- Acemoglu D., Autor D. Lectures in Labor Economics. MIT, 2011. 299 p.
- Becker G. S. Human Capital: Theoretical and Empirical Analysis with Special Reference to Education. Chicago: University of Chicago Press, 1964.
- Mincer J. Schooling, Experience and Earnings. New York: National Bureau of Economic Research, 1974. 152 p.
- Schultz T.W. Investment in Human Capital: The Role of Education and of Research. New York: Free Press, 1971.
- Schultz T.W. The Economic Value of Education. New York: Columbia University Press, 1963.
