Retrieval of Complex Named Entities on the Web: Proposals for Similarity Computation

Author: Armel Fotsoh, Christian Sallaberry, Annig Le Parc Lacayrelle
Journal: International Journal of Information Technology and Computer Science @ijitcs
Article in issue: 11 Vol. 11, 2019.
Free access
As part of the Cognisearch project, we developed a general architecture dedicated to extracting, indexing and searching for complex Named Entities (NEs) in webpages. We consider complex NEs as NEs represented by a list of properties that can be single values (text, number, etc.), "elementary" NEs and/or other complex NEs. Before the indexing of a new extracted complex NE, it is important to make sure that it is not already indexed. Indeed, the same NE may be referenced on several different web platforms. Therefore, we need to be able to establish similarity to consolidate information related to similar complex NEs. This is the focus of this paper. Two issues mainly arise in the computation of similarity between complex NEs: (i) the same property may be expressed differently in the compared NEs; (ii) some properties may be missing. We propose several generic similarity computation approaches that target any type of complex NEs. The two issues outlined above are tackled in these proposals. We experiment and evaluate these approaches with two examples of complex NEs related to the domain of social events.
Complex Named Entities, Similarity Computation, Machine Learning, Web Mining
Short address: https://sciup.org/15017082
IDR: 15017082 | DOI: 10.5815/ijitcs.2019.11.01
Text of the scientific article Retrieval of Complex Named Entities on the Web: Proposals for Similarity Computation
Published Online November 2019 in MECS
The web has become one of the main information sources. The number of contributors to this data source is increasing very rapidly and the published content is usually unstructured. Therefore, many tools or research works targeting the querying of the web content for easy access to this large volume of information have been developed.
Indeed, the information contained on the web generally refers to real-world objects such as people, places, businesses or even events: in the state of the art, these objects correspond to Named Entities (NEs) [35]. A Named Entity (NE) is defined as a linguistic unit of a referential nature which refers to people, organizations, places, dates, etc. In other words, a NE can be defined as a linguistic unit (phrase), uniquely identifiable in a specific context and referring to a real-world object [6, 11]. When a NE is represented by a single phrase, it is consider as an elementary NE. Otherwise, a NE such as an event can be described by a list of properties: its title, its venue, its date and its category. We call this kind of NE a complex NE.
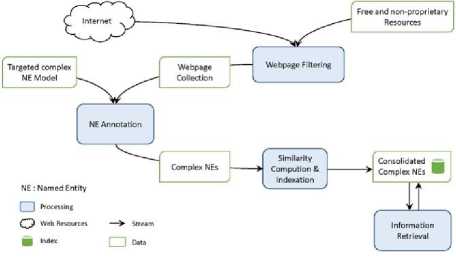
As part of the Cognisearch project, our goal is to build information retrieval services which target complex NEs. These services must be fed with data from the web. We have developed a general architecture of services (see section II) for this purpose. It includes four main modules: (i) the web filtering module is dedicated to the identification of relevant webpages for the extraction of the processed complex NEs; (ii) the information extraction module focuses on the analysis of the corpus built in the previous module for extracting NEs; (iii) the indexation module integrates the extracted NEs in the index; (iv) and the information retrieval module takes as input an information need and parses the index to retrieve the relevant complex NEs.

tkketmaster Recherche? tin spectacle, tin evenwnent, une safc . и
MLISIQUE ARTS $ SPECTACLES SPORT ГДМ1ЦЕ S LO1S«S ЯЁ@ЮН5 SONS PLANS A ■ A.M4

MAIN SQUARE FESTIVAL 2017 - PASS 1 JOUR
5^7Tti** Apart"du
Ofjjuin
-
7. DMAW ',
3 SQUARE J
FE5W4 - FESTIVAL Wfi«
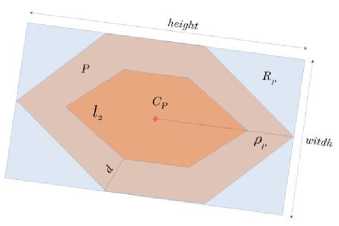
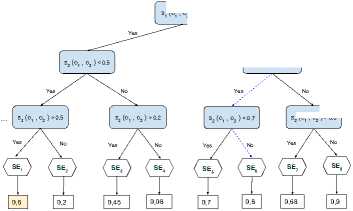
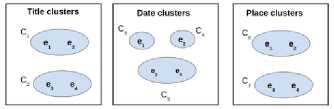
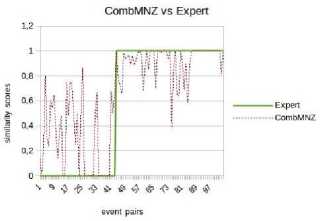
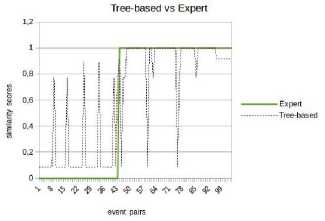
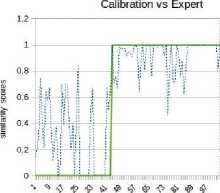
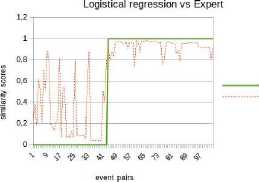
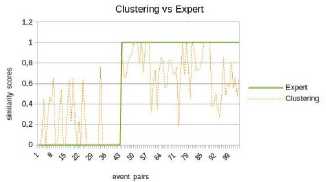
*1и» wx>«mzER.«MW>e LA CITAOELlf - QUARTIER DC TURENNE 9 frvtl Cm GENE Rai И GAui If №X*>ahW-EMNCE ^№; DISPONlhlt POOR «I EVtNEMim Fig.1. “Main Square Festival” description within two different web platforms. However, information about the same NE can be referenced on multiple platforms on the web. This is illustrated by Fig. 1 where the same event is referenced within two distinct ticketing platforms: infoconcert.com and ticketmaster.com. Thus, the extraction module will identify two distinct NEs, one on each platform, even if they are the same. We do not want to index it twice. Therefore, before indexing, we must establish the similarity between the NEs in the index and the new extracted one. In this paper, we will only focus on the indexation module and more particularly on computation of the similarity between complex NEs. Using the example in Fig. 1, this similarity computation raises two main issues: • the same property can be expressed differently on both platforms. This is the case, for example, of the event's titles which are not identical (“Main Square” vs “Main Square Festival 2017”). We also encounter this issue for the event's venue: on infoconcert.com, it is given by the city name (“Arras”), which can be represented by a polygon, but on ticketmaster.com we have an address (“La Citadelle - Quartier de Turenne, Bvd du Général de Gaulle, 62000 Arras”) that can be represented as a point. These two places are not expressed at the same granularity level; • some properties may be missing in the extracted complex NEs. Indeed, the category (“Festival – Music”) is clearly given on ticketmaster.com, but not on infoconcert.com. The challenge is to be able to evaluate the similarity at the complex NE level, taking into account this lack of information. For the first issue, we propose a similarity computation function for two places: one represented by a point and the other by a polygon. For the second, we propose four new approaches for computing similarity between complex NEs. All our approaches allow similarity computation even when some properties are not entered. The paper is presented as follows. We describe our general architecture framework in section 2. We look at previous works carried out on NE similarity computation in section 3. Section 4 details our approaches to complex NE similarity computation, while section 5 focuses on our experimentation with these approaches on two types of complex NEs. Section 6 concludes the paper and proposes new research prospects. Our generic processing architecture (Fig. 2) is composed of four main modules, configured according to the type of processed complex NEs. Therefore, it is important to define models for their representation. We have already used it to process social event and company NEs. Fig.2. Our generic processing chain. The Webpage Filtering module uses free and nonproprietary resources to process Web content and build a webpage collection. Its purpose is to filter the relevant subset of webpages for the extraction of targeted NEs. For example, for social events, this module targets ticketing websites. The corresponding webpages are then classified, via supervised learning, in order to retain only webpages describing an event. The Named Entities Annotation module processes the previously selected webpages. Our annotation process is generic and takes as input the representation model describing the processed complex NE. The originality lies in the fact that we process webpages in three steps. An initial supervised learning-based tagging operation identifies webpage blocks potentially containing the properties of complex NEs. A second tagging operation is dedicated to the detailed analysis of these blocks using specific patterns, resources or learning-based approaches for property annotation in blocks. Finally, properties are aggregated in order to build the corresponding complex NE (e.g. social event). The Similarity Computing & Indexation module corresponds to the storage of each annotated NE in the index. As we have seen in Fig. 1, two different pages can describe the same NE. So, a preliminary check must be performed to make sure that an extracted NE is not already included in the index. If this is the case, it may be necessary to complete the indexed NE by adding a value for a property that has not yet been entered. Taking the example of Fig. 1, the extraction of the category on ticketmaster.com would help to complete the information extracted on infoconcert.com. The main issue in this point is the similarity computation. The Information Retrieval module corresponds to the querying of the index. The query may be considered as a complex NE, where some properties may be missing. Here also, the main issue is the computation of the similarity between the complex NE corresponding to the query and those contained in the index. The focus of this paper is how to calculate the similarity between two complex NEs? We propose several approaches for this purpose, detailed in section IV. The NE similarity computation approaches differ depending on whether the processed NEs are elementary or complex. Regarding elementary NEs, these approaches depend on their representations: textual, semantic or numerical. On the other hand, regarding complex NEs, the similarity computation is usually achieved according to two steps: (i) the first one computes intermediate similarity scores between properties of the same position; (ii) and the second one aggregates these intermediate scores to deduce the overall similarity. A. Computation Of Similarity Between Properties The computation of similarity between two properties, p1 and p2, generally consists of using metrics based on textual, semantic or numerical representations. With regard to similarity computation based on textual representations of the properties, there are three main categories of approaches. Character-based approaches take account of the order of characters and use the number of elementary operations required to obtain one string from the other one (Jaro [21], Jaro-Winkler [40] and Levenshtein [25]). Word-based approaches count the number of identical words present in both strings but without taking account of the word order (Jaccard [20], TFIDF [32]). Finally, Hybrid-based approaches represent each string of words in meta-characters and apply character comparison methods to them (Monge-Elkan [26], softTFIDF [8], LIUPPA [27]). As far as similarity computation based on semantic representations of properties is concerned, there are three main approaches that exploit knowledge of the domain, which is generally described in the form of a graph of concepts. Evaluating the similarity between two concepts consists of plotting them on the knowledge graph and then measuring the path between the two nodes representing them: the Rada measure [29], and the Bulskov measure [5]. Another category of approaches takes account of the nearest common ancestor and the respective depth of each of the two nodes in relation to the root of the graph: Wu and Palmer [41]. Regarding similarity computation based on numerical representations of properties, we consider that it is interesting to exploit a representation of space or time, respectively, on a map or a time line. Evaluating the similarity between two places or two dates consists of plotting them on a map or an axis, for example, and then exploiting the corresponding distance computation metrics. Several distances are proposed in order to evaluate the proximity between points (places): the Euclidian distance [42], the Hausdorff distance [13], and the Haversine distance [7]. There are other metrics based on the overlapping of geometric shapes: the Hill similarity [19], the Walker et al. similarity [38], the Beard and Sharma similarity [3], and the Sallaberry et al. similarity [31], or otherwise between time intervals: the Le Parc-Lacayrelle et al. similarity [23]. Table 1 summarizes previous works and their application to elementary NE similarity computation. Table 1. Works related to elementary NE similarity computation (social NEs stand for Persons and Organizations) Works Property Representation NEs Textual Semantic Numerical Time Place Social Char. Words Hybrid Path Depth Axis Plane Space Bahram et al. (2013) ѵ ѵ Becker et al. (2010) ѵ ѵ Bulskov et al. (2002) ѵ Hill et al. (1990) ѵ ѵ Le Parc-Lacayrelle et al. (2007) ѵ ѵ Majulashenoy et al. (2012) ѵ ѵ Mckensie et al. (2014) ѵ ѵ Moreau et al. (2008) ѵ ѵ ѵ ѵ Nguyen et al. (2013) ѵ ѵ Rueben et al. (2013) ѵ ѵ Sallaberry et al. (2008) ѵ ѵ Teissèdre et al. (2010) ѵ ѵ Wang et al. (2014) ѵ ѵ Finally, properties can also be multivalued. Each can be represented as a set of elements, and the challenge here is to evaluate the degree of similarity between two sets. A first approach is to use the Jaccard metric [20] to evaluate this similarity. Note that when the difference in cardinality between the two sets is large, even if one is included in the other, the Jaccard measure gives low scores. Halkidi et al. [18] proposed a metric of similarity dedicated to the computation of sets of ontology concepts, whenever the difference in cardinalities between the sets to be compared is large. This approach exploits the similarities in the pairs of concepts constructed from the Cartesian product of these sets. B. Aggregation Of Intermediate Similarity Scores It is recalled that the computation of similarity between two complex NEs, ec1 and ec2, consisting of a list of properties, is generally carried out in two stages [37]: side-by-side property similarity computation and the combination of the obtained intermediate scores to deduce the global similarity. In the multi-criteria Information Retrieval (IR) field, Fox and Shaw [15] proposed several simple and widely used combiners: CombMax, CombMin, CombSUM, CombANZ and CombMNZ. We can also mention the "Prioritized Aggregation" combiners proposed by Da Costa Pereira et al. [9]. Table 2 summarizes works dedicated to complex NE similarity computation according to the different approaches. Table 2. Works related to complex NE similarity computation (social NEs stand for Persons and Organizations) Works Aggregation Approaches Targeted NEs Linear Combination Logic Empirical Heuristic Time Place Social POI Event Becker et al. (2010) ѵ ѵ Khrouf et al. (2014) ѵ ѵ Kim et al. (2017) ѵ ѵ Railean et al. (2013) ѵ ѵ Scheffler et al. (2012) ѵ ѵ Serrano et al. (2013) ѵ ѵ ѵ ѵ ѵ Zhu et al. (2017) ѵ ѵ Wongsuphasawat et al. (2012) ѵ ѵ However, leaving aside these works relating to IR, the most widespread aggregation technique remains linear combination, which consists of computing the final score by calculating the weighted sum of the different intermediate scores. In practice, associated weights are generally determined empirically. This is applied to the proposal of Serrano et al. [36] which focuses on the computation of similarity between fact-type events. Zhu et al. [44] also used the linear combination with empiric weigths for computing the similarity between Geospatial data, represented as Complex NEs. There is another aggregation technique, also based on linear combination, but with weights determined using meta-heuristics. Khrouf et al. [22], for example, exploit the meta-heuristic by particle swarm [12] for optimizing the weights of the intermediate similarities in the linear combination. This is applied in a context of consolidation of events coming from different platforms. It is important to note that this technique is effective only when the number of NE properties is very large. A last aggregating approach is the one based on logical functions. Indeed, a logical expression is constructed for each property, and logical operators (AND, OR, NO, etc.) are used to merge them. Sheffer et al. [34] use such an approach to evaluate the similarity between POIs. If the two spatial properties are not in the neighborhood of each other (distance greater than a threshold), the nonsimilarity is directly established. If they are, we also check that the other properties match or are close. Current work focuses on specific categories of complex NEs. Our goal is to propose a similarity computation approach applicable to all categories of complex NEs. In order to properly integrate the extracted NEs into the indexes, we have developed four approaches to compute similarity between complex NEs. They are organized into two groups. The first one is composed of three approaches that compute complex NE similarity in two steps, as in the state-of-the-art: evaluation of property similarities, and their aggregation. Our contribution for this group focuses on the second step. The second group includes an approach which combines clustering techniques with vector models. Consider two complex NEs, o1 and o2 defined with n properties (n > 1) by: o1 = < p11, p12, ..., p1n > o2 = < p21, p22, ..., p2n > Regarding the computation of intermediate similarities si(p1i, p2i), we have selected or defined new functions according to the type of properties (text, semantic concept, numeric values) and their specificities (mono or multivalued). We will present these functions in a first step, and thereafter we will detail each of our complex NE similarity computation approaches. A. Metrics For Property Similarity Computation Consider that Ti is the type of the property pi. We denote fTi the function used to evaluate the similarity between elements of type Ti. fTi is formally defined by: : Tt х7^[0,1] Т1 " (Pii,№д ^s^Pii,р2) Similarity computation between simple type properties In this case, Ti may correspond to short texts, semantic concepts or numerical values (places, dates or times). fshort_text - To compare two short texts (consisting of no more than 15 words), we use the softTFIDF metric [8], for two reasons. Firstly, softTFIDF compares the words, but also the characters, which makes it more flexible with regard to spelling mistakes. Secondly, it does not take account of the word order and thus it leads to a high similarity score for two strings such as "Main Square Festival" and "Festival Main Square". fsemantic - We use the Wu and Palmer measure [41] for comparing two semantic concepts. This choice is justified by the fact that the Wu and Palmer measure makes it possible to take into account the ontology taxonomy when computing the similarity between two concepts. ftemporal - Let t1 and t2 be two dates (two respective times). To compute their similarity, we represent them on a timeline or time axis. We denote by 0 the threshold (in terms of interval length on the axis) at which t1 and t2 start to differ. Based on the proposal of Becker et al. [4], we define ftemporal by: ftemporal ( tl , ^2)={ - | ^2~^1 | if | tl - tl|>9 else. (2) Note that the value of 9 is set according to the type of processed entities (dates or times). fplace - The places are represented either by points (latitude, longitude), or by polygons (a list of points). Indeed, a place can be given as an address, so it is represented by a point. A place can also be given as a council name or an area that we represent by a polygon. So, the comparison of places l1 and l2 corresponds to one of the following three scenarios: (1) comparison of two points, (2) comparison of two polygons, (3) comparison of a point with a polygon. Let H be the Haversine function [7] used for measuring the distance between two points on the surface of the Earth. • Comparing two points - Let Y be the threshold distance from which two points are considered to be totally different. Based on Becker et al. [4], we define fplace by: 0 if H(к,к)>У fplace(к,к)={1- (4,к) else. • Comparing two polygons - Consider area the function that helps to evaluate the area of a polygon. We define fplace based on the overlapping area between l1 and l2 and their union. fplace(к,к) area(1г∩к) area (к∪к) • Comparing a point l1 and a polygon l2 - For this scenario, we want to evaluate the similarity by integrating the fact that the point may be contained in the outskirts of the polygon. The proposal of Rueben et al. [30] does not tackle this issue, so we propose a new similarity function. We defined a buffering polygon P which is the extension of l2 (Fig. 3) and we denote by CP its centroid. P is obtained by applying a translational movement to the vertices of l2 according to a given distance d (d is a parameter of the process). Let Рр be the maximal distance between cP and P's vertices. Рр = max(н( Ср , point) / point∈Р) fplace is defined by: fplace(к,к)={1 - 0 if к∉р н(к,СР × else. РР V (0 < V < 1) is a coefficient which makes it possible to take into account the stretch (in height or width) of P in the similarity computation. This coefficient is computed based on the enclosing rectangle RP of P (see Fig. 3). RP is selected so that the residual area between RP and P is minimal. Consider height and width to be respectively the height and the width of RP (width ≤ height). We calculate V based on the following formula: / width. V v= . / \height/ Fig.3. Buffering polygon and bounding box for polygon l2. Similarity computation between set type properties Some properties of a complex NE may be multi-valued, therefore they are represented as sets. There may be sets of texts, sets of semantic concepts, sets of places, sets of temporal entities or sets of complex NEs. To compute the similarity between two sets, we use the function proposed by Halkidi et al. [18]. We choose this function (defined in section III.B.) because it takes into account the cardinalities of the sets in the computation, unlike other functions (Jaccard). In fact, the Halkidi function was initially defined to compare sets of semantic concepts based on the Wu and Palmer measure. In our case, we replace the Wu and Palmer measure by a similarity function adapted for the elements of sets [14]. Finally, for the computation of si(p1i, p2i), we re-used existing measures (softTFIDF, Wu-Palmer, etc.). We also adapted some existing measures (Halkidi) or proposed new ones (fplace between a point and polygon). We will now detail each of our proposals for computing the similarity between complex NEs according to score aggregation or clustering approaches. B. Complex NE similarity computation: score aggregation approaches (group 1) We recall that for two complex NEs o1 and o2 with n properties each, we denote si(p1i, p2i) the similarity score between their properties at position i. si(p1i, p2i) is computed using functions listed in section IV.A. For the approaches in this group, the challenge is to properly aggregate the different intermediate similarities (si(p1i, p2i), i E [ 1, n]). We propose three approaches for this purpose: • the first one, which is called the calibration approach, is based on linear combination; • the second, which is called the logistic regression approach, is also based on linear combination. Differently to the previous one, the weights in the combination are determined using a learning method; • the third approach is called the tree-based approach, it is based on logical functions, those described in decision trees. Calibration approach Given the different intermediate similarities, the similarity score between o1 and o2 is literally defined as: n s(oi,o 2) = 2 wix si( Ри, P 2 i) (8) i=1 wi is the weight of the property at the position i in the complex NEs (o1 and o2) and w1, w2, ..., wn are defined so that: ^Twi 1 AVi, wi > 0 (9) i=1 Unlike in the state of the art, the wi are not defined empirically. We experiment with different combinations of weights generated while respecting the constraint fixed by equation (9) for defining the implementation weights. In fact, a validation set of complex NE pairs is built, so as to cover a large number of property expressions. Then, for each pair in this set, an expert associates a similarity score. Thereafter, each of the combinations of weights generated is used to compute similarity scores on the validation set pairs by applying formula (8). The combination which best reproduces the expert scores on the validation set is selected for the implementation of the approach. When a property is not entered, the weight of the corresponding similarity is equitably distributed among the properties present in the two NEs. Logistical regression approach In this second approach, we also want to process the similarity computation as a linear combination (equation (8)). Unlike with the calibration approach, we no longer want to experiment on all the possible weights. In fact, the number of generated combinations can become exponential when the complex NEs have a large number of properties or when the variation step is small. We opt for logistic regression instead of linear regression in order to avoid edge effects [1]. Indeed, we evaluate the similarity score between o1 and o2 as the conditional probability that the two NEs are similar, given the similarity scores between properties. This literally translates as: s(01,02) = P(1 / X) with X = (si(pi 1,P21), ...,Sn( Pm, P2J) To calculate this probability, logistic regression uses the logit function, which is defined as a linear combination of the elements of the vector X. ( ( , )) ln( S(01,02) ' 1 - S (01,02 / W0 + Wi X S1(P 11, p 21) + — (11) +Wn XSn(P1 n,P2n) As a result, we get: ( , ) 1 + g- (w 0+ W1XS 1(P 11, p 21) +—+W nXS n( p 1 n, p 2 n)) The challenge with this approach is to determine the weights that serve to calculate the logit. Since the logit function makes it possible to define a bijection from [0, 1] to К the conditions of implementation of the linear regression are present. Therefore, we use the learningbased method called gradient descent [16] for optimal weight estimation. In this method, we start with a training set consisting of complex NE pairs for which an expert has given similarity scores. Thereafter, the weights are randomly initialized and a process by iteration is set up. At each iteration, weights are varied following the gradient of the overall estimation error on the training set. The maximum number of iterations, the permissible error and the variation step are the parameters of the process. When a property is not entered, the associated similarity is set to -0.5. This helps to train the logistic regression model whilst taking into account the information about non-entered properties. Tree-based approach The linear combination does not take into account eventual dependencies between intermediate similarities. This is why we propose a new approach for aggregating intermediate similarities. This approach is based on a supervised learning method used in predictive analysis: decision trees [39]. The advantage of this approach is that it remains valid in all cases (correlation between properties or not). The choice of decision trees rather than other learning algorithms such as neural networks is justified by the fact that decision trees are built according to a boolean logic. As a result, it is possible to simply interpret and adjust the obtained tree for efficiency. In addition, neural networks require a large quantity of training data to work properly. As with the logistic regression approach, the constitution of a training set containing complex NE pairs is necessary to build the decision tree. Indeed, the complex NE pairs in this training set are grouped into homogeneous subsets. Each of these subsets contains complex NE pairs whose similarity scores between properties at the same position satisfy the same conditions. The similarity score between pairs of NEs that are in the same homogeneous subset is deduced from those given by the expert. In this proposal, we use the average of these scores. Fig. 4 illustrates an excerpt of a decision tree. The subset SE1 contains pairs of NEs for which the similarity scores of the properties at positions 1, 2 and 3 are respectively less than 0.8, less than 0.5 and greater than 0.5. The similarity score of the complex NE pairs in this subset will be 0.6. s (o , o2 ) < 0,8 s3 (o1 , o2 ) < 0,75 3 (o1 , o2 ) > 0,2 o ) < 0,7 Fig.4. Example of a decision tree for similarity computation. s2 (o1 , o2 ) > 0,6 Once constructed, the tree is then used to estimate the similarity score for a pair of complex NEs for which we already know intermediate similarities. We start by going through the tree in order to determine the homogeneous subset to which it belongs. Then we associate the corresponding score as the similarity between NEs constituting the pair. Regarding the segmentation of the training set's pairs in homogeneous subsets, we use the algorithm ID3 [28]. The only parameter of the algorithm is the maximum number of complex NE pairs in each homogeneous subset. As with logistic regression, we associate a score of -0.5 to intermediate similarities when we have nonentered properties. C. Complex NE similarity computation: clustering-based approach (group 2) We called the only approach in this group the clustering approach. Unlike the first group, the similarity computation process does not consist of comparing the property values side-by-side and then aggregating the scores obtained to deduce the overall similarity. Here, the process is organized into three main steps: • the first step is dedicated to the partitioning of the complex NE set into clusters according to the different properties; • the second step focuses on the representation of each complex NE as a vector of all clusters built previously; • the last step makes it possible to evaluate the similarity score between two complex NEs as the cosine of the angle formed by the vectors representing them. We consider that we are dealing with a set O consisting of four complex NEs corresponding to events. Each event is defined by a title, a date and a place. Events in O are defined as follows: e1 = < Main Square, 06:30:2017, Arras > e2 = < Main Square Festival 2017, 07:02:2017, Citadelle Arras > e3 = < FRANCE vs AUSTRALIA, 06:16:2018, Kazan City > e4 = < FRANCE - AUSTRALIA, 06:16:2018, Kazan Arena > Partitioning step This first step draws on Becker et al.'s work [4]. The cluster constitution is based on the Single Pass algorithm [17]. For each property pi of a complex NE ∈ , we built mi clusters , ,…, . Each cluster contains the complex NEs for which pis are similar. The cluster corresponds to the j's cluster for the i's property, it is formally defined as follows: = { , ,…, ⁄∀ , ,1≤ , ≤ , ≠ , ( , )> } > 0 is the similarity threshold for property pi. It is set so as to optimize the partitioning of O. For the n properties of each complex NE of O, we obtain dim clusters: n dim = ^ mi i =1 For the example of a set comprising e1, e2, e3 and e4, we consider that two events are in the same title's cluster if and only if the similarity score between their titles is greater than 0.7. For date and place, we fix the thresholds to 1.0 and 0.8 respectively. Finally, we obtain 7 clusters, as shown in Fig. 5: 2 for titles, 3 for dates and 2 for places. Fig.5. Partitioning of the set of events. Vectorial representation step The idea here is to represent each complex NE ∈ as a vector of dim length. Let be the weight of cluster in o. Therefore, o can be represented as: c^ c- =( … ) Regarding the computation of , we define a function which is an adaptation of TFIDF [33]. Let N and be respectively the cardinalities of O and Cj . We denote by Cj the centroid of cj ; Ctj is computed using the following formula: a' =log( ■^ ) × Si (Pi , Cj ) Cj for short texts is the union of all the texts. The cluster C1 in our example contains e1 and e2, therefore its centroid is “Main Square Festival 2017”. For semantic concepts, Cj is the nearest common ancestor. For dates and times, it is the centroid of the different points on the timeline. Cj for places is the centroid of points representing the processed property. Indeed, for polygons, we use their centroid for Cj computation. And last, Cj for sets is their union. Taking our example of e1, e2, e3 and e4, the corresponding vectors are given below: Cj c2 Q c. Cj G о ei £ 0.51 0.01 138 0 0 0.50 0 ) 62 ( 0.69 0.02 0 1.38 0 0.51 0 ) 8з ( 0.03 0.69 0 0 0.69 0 0.50 ) 8- = 003 0.69 0 0 0.69 0 0.51 ) ( Similarity computation Consider a pair of complex NEs (Oi, 02)∈0×0 represented respectively by the following vectors: 01=( «1 ,…,(Zm ,…, «j ,…,(Zm) 02 =(Pl,…,Pm ,…,Pj,…,Pm) Their similarity score is computed as the cosine of the oriented angle they formed. Literally, it is the ratio between the scalar product of the vectors and the product of their respective Euclidean norms. S(01, 02 ) n л Л — °1 ×02 cos(^1, )= , ‖ 01‖×‖02 ‖ ∑. × £j / √∑ af ×√∑ /?f Applying this to compute s(e1, e3) and s(e3, e4), we obtained the following results : s(e1, e3) = 0.014 and s(e3, e4) = 0.999. In this section, we experiment with our different similarity computation approaches. These experiments are carried out in the indexing stage of our general architecture, when we want to store a new extracted complex NE. We recall that in this context, we have two possible cases. If there is a complex NE in the index which is similar to the one extracted, we merge information in order to enrich the NE in the index. Otherwise, we simply index the new complex NE. For this decision-making purpose, we apply our similarity computation approaches to social events. We start this section by defining what an event complex NE is. A. Event Model According to [43], an event is "something that happens somewhere, at a given time and involves a certain number of actors". Two types of events are generally distinguished in the state of the art: facts and social events. Facts correspond to historical events, current topics, or even the episodes of a story. Social events refer to events such as to concerts, festivals, conferences, sport events, etc., with which a schedule and an audience are associated. In these experiments we deal with social events. The UML class diagram of our social event model is described in [14]. In our experiments, we compute the similarity between two event NEs based only on three properties: the title t, the set of categories Cate and the set of main performers APe. Furthermore, we will use the venue v, the date d and the time t for the similarity computation between two performances of an event. As a result, an event e and a performance pr in our experiments are formally represented by: e= <t, Cate, •^P > and pr = < 17 ,d,t> B. Setting of the property similarity computation We consider that two places represented by points which are more than 20 km apart are necessarily not similar ( Y=20km). Moreover, for the comparison of two places, one represented by a point and the other by a polygon (l2), we define d (polygon extension) proportionally to the largest distance between the centroid of the polygon and its vertices (Pl ). For our experiments, we set the coefficient of proportionality to 2/5, like [31] (d=× , where Pl is the centroid of the polygon l2). For temporal NE similarity computation, we consider that two dates are identical if and only if they correspond to the same day ( 6=1day ). We also consider that two times with more than 60 minutes difference are distinct (0=60minutes). C. Evaluation protocol The objective of our experiment is to compare our similarity computation approaches with each other, but also with one of the most widely used approaches in the state of the art as baseline: CombMNZ. More precisely, we use the normalized CombMNZ [24] to ensure similarity scores between 0 and 1. We also want to compare our approaches according to whether the processed NEs contain non-entered properties. Indeed, an analysis of the 8000 events extracted by a first prototype implementing our general architecture shows that 75% of the extracted NEs have missing information. This is either because they have not been filled in on the analyzed webpages, or because they have not all been detected by our extraction system. Scenarios The two main scenarios in our evaluation process are the following cases: • scenario 1: all properties are fully entered in the compared NEs; • scenario 2: at least one of the compared NEs has missing properties. We make assumptions as prerequisites for the computation of the similarity between events and between event performances. For events, it is the title which is required, and for performances, it is the venue. As a result, if the required property is not entered in a complex NE, it is not similar to any other. From these assumptions, we have formed families of complex NE pairs. For the events, we have the following families. • Family 1: all properties are fully entered in both NEs e, =< tv Catev APei > e2 =< t2,Cate2, AP^ > • Family 2: a property is not entered in one of the NEs er = e, =< t,, Catei, AP > e2=< 2,,Cate2,—> • Family 3: the same property is not entered in each of the two NEs ei =< 1,,—,Ap61 > e2 =< 2,,—,Ape2 > eY = • Family 4: a property is not entered in each of the two NEs, but it is not the same ei =< 1V Caeei, —> e2 =< t2, —,APe2 > • Family 5: two properties are not entered in at least one of the compared Nes e, =< 1,, Caeiv APei > e2 =< t2, —, —> e1 =<21,—,APei> e2 =< t,,—,—> e, =< 1,, a t t(,— —> e2 =< t2,—,—>ei =< 1ii~i~> e2 =< t2,—,—> Scenario 1 corresponds to Family 1 and scenario 2 to the others (2, 3, 4 and 5). In the case of event performances, we also have three properties and the families remain the same. We just need to replace the title by the venue, as well as the set of performers and categories by the date and time respectively. Evaluation metrics To compare the different approaches and according to the different scenarios, we will use four metrics: precision P, recall R, F1-measure and accuracy E [10]. Threshold selection We need to define thresholds in order to decide on the similarity or not of two complex NEs. Therefore, we have defined a process in two stages: • the first stage represents, on a graph, the similarity scores of the expert and those of each approach for all pairs in the evaluation corpus. These pairs are ranked in ascending order of the expert's scores. The obtained graphs can be used to glimpse visually in which intervals the thresholds of each of the approaches are; • the second stage explores the intervals supposed to contain the thresholds to determine the value that optimizes the results on a validation set (F1-measure and accuracy). The exploration step of each interval is set to 0.01. D. Experiments with the similarity computation between events Evaluation corpus This consists of 100 pairs of complex NEs covering the 5 families observed. Table 3 gives the proportions of each family in the evaluation corpus. For each of them, we have couples whose complex NEs are similar as well as those that are not, in fairly equivalent proportion. Table 3. Proportion of the different families throughout the entire evaluation corpus Families Family 1 Family 2 Family 3 Family 4 Family 5 Number of pairs 23 22 23 13 19 We also implemented Barlett's sphericity test [2] to verify the overall independence among the property similarities across the evaluation corpus. This test confirmed to 95\% this independence, which legitimizes the experimentation with the approaches based on the linear combination. Settings of approaches and threshold determination Concerning the calibration approach, the optimal weights are as follows: wt = 0.5, wCat = 0.3 and wAp = 0.2. For logistic regression and tree-based approaches, we trained our models using a corpus of 85 pairs with 50 of them similar. We took just 85 pairs because they were representative of all the cases, due to the fact that we only have 3 properties in our complex NEs. For the clustering approach, we built the clusters from a set of 300 event NEs. The optimal partitioning thresholds are the following: = 0.5 , = 0.3 and = 0.2 . We obtained 102 clusters for titles, 18 and 41 for categories and main performers respectively. Fig. 6, 7, 8, 9 and 10 present the graphs of the expert's scores and those obtained by each of the evaluated approaches. Fig.6. Variations in expert's scores and those of CombMNZ. Fig.9. Variations in expert's scores and those of the tree-based approach. —— Expert ..............Calibration event pairs Fig.7. Variations in expert's scores and those of the calibration approach. Fig.8. Variations in expert's scores and those of the logistic regression approach Fig.10. Variations in expert's scores and those of the clustering approach. From these different graphs, we can glimpse a similarity threshold between 0.6 and 0.8 for all the approaches. After exploring the interval [0.6, 0.8], the optimal thresholds for each of the approaches are given in Table 4. Results and analysis The results concerning scenario 1 are given in the upper part of Table 5. Table 4. Thresholds for similarity or non-similarity decision: event case Approaches CombMNZ Calibration Logistical Tree Reg. based Clustering Threshold 0.64 0.62 0.75 0.77 0.64 Table 5. Results for the two CombMNZ Calibration evaluation scenarios Logistical Reg. Tree-based Clustering P 92.86 86.67 100 92.86 93.33 R 92.86 92.86 85.71 92.86 100 Scenario 1 F1 92.86 89.66 92.31 92.86 96.55 E 91.30 86.96 91.30 91.30 95.65 P 75.00 77.08 86.05 81.82 81.85 Scenario 2 R 81.82 84.09 84.09 81.82 68.89 F1 78.26 80.43 85.06 81.82 74.70 E 74.03 76.62 83.12 79.22 72.73 We can observe that the clustering approach leads to the best results. This is explained by the fact that when two complex NEs are similar, the vectors representing them are close to one another and therefore the angle between them is small. The CombMNZ and calibration approaches lead to the same recall. Indeed, CombMNZ is a special case of the calibration approach where all weights are equal. On the other hand, the calibration weights are calculated on all validation sets, independently of the fact that some properties may be missing. In addition, the approach setting gives higher weights for title and category (0.5 and 0.3 respectively). Therefore, if two non-similar events have close titles (“F1 Grand Prix De France” and “Grand Prix De France Moto”) and the same category (“Motor sports”) but different main actors, then the calibration approach will tend to compute a similarity score above the threshold. Additionally, the results of the logistic regression and tree-based approaches are quite similar to those of the baseline. Table 6. Results for the pair families of scenario 2: event case CombMNZ Calibratio Logistical Tree-based Clusterin P 85.71 92.31 86.67 91.67 85.71 R 85.71 85.71 92.86 78.57 80.00 F1 85.71 88.89 89.66 84.62 82.76 E 81.81 86.36 86.36 81.81 77.27 P 80.00 85.71 85.71 76.47 86.67 R 85.71 85.71 85.71 92.86 92.86 F1 82.76 85.71 85.71 83.87 89.66 E 78.26 82.61 82.61 78.26 86.96 P 62.50 62.50 83.33 83.33 75.00 R 83.33 83.33 83.33 83.33 50.00 F1 71.43 71.43 83.33 83.33 60.00 E 69.23 69.23 84.62 84.62 69.23 P 63.64 61.54 87.50 77.78 60.00 R 70.00 80.00 70.00 70.00 30.00 F1 66.67 69.57 77.78 73.68 40.00 E 63.16 63.16 78.95 73.68 52.63 For scenario 2 (at least one missing property), the corresponding results are given in the lower part of Table 5. The logistic regression gives the best results in this case, and is directly followed by the tree-based approach. These good results for learning-based approaches can be explained by the fact that they use the information about missing properties in addition to the intermediate similarities for the training of the models. The Clustering approach that was the best for the previous scenario is the one that gives the worst results for scenario 2. Indeed, when a property is absent, all associated clusters have a weight of 0 in the vector representing the complex NE. As a result, the scalar product is weak compared to the product of the vector norms: hence the score below the threshold. We did further analyses according to the different families of scenario 2. The corresponding results are presented in Table 6. When we have only one missing property that is the same in both events (Family 3), the clustering approach gives the best results. In all other cases, the logistic regression approach is the best. It is closely followed by the tree-based approach. We also observe that when the number of non-entered properties increases, the results of approaches which are not learning-based deteriorate quickly. E. Experiments with the computation of similarity between event performances When the similarity between an event in the index and the one extracted is established, we then need to compare the performance sets in order to merge them or to append new ones to the existing event. As with events, the evaluation corpus consists of 100 performance pairs covering the 5 families observed. The particularity of the performances is that all the properties are numerical. Barlett’s test served to legitimize the experimentation with the approaches based on the linear combination. The different approach settings and threshold determination are carried out exactly as for events. Results and analysis Table 7 presents the results obtained for each of the two scenarios. We can observe that the CombMNZ, calibration and clustering approaches lead to the same results for scenario 1. Indeed, as all the properties are numerical, when two performances with all the properties entered are identical, their values coincide or are very close. This explains the ability of these approaches to clearly establish similarity (100% recall). Table 7. Results for the two evaluation scenarios: performance case CombMNZ Calibration Logistical Reg. Tree-based Clustering P 91.67 91.67 91.67 91.67 91.67 Scenario 1 R 100 100 91.67 91.67 100 F1 95.56 95.56 91.67 91.67 95.56 E 95.24 95.24 90.48 90.48 95.24 P 80.43 73.91 84.78 82.61 84.62 Scenario 2 R 80.43 85 84.78 84.44 63.46 F1 80.43 79.07 84.78 83.52 72.53 E 77.22 77.22 82.28 81.01 68.35 For scenario 2, the observed trends are similar to those in the experiments with event NEs. The two learningbased approaches stand out from the others and the clustering approach is the poorer of the two. We can also observe that, as with events, when both of the compared NEs have the same property not entered, the clustering approach always gives a good recall. However, when the number of non-entered properties increases, the results of approaches which are not learning-based deteriorate quickly. At the end of these two experiments, we can formulate the following conclusions: • the experiments with event performance similarity computation confirm the trends observed for event NEs; • depending on the case, some approaches are more appropriate than others: (i) when all properties are entered, the clustering approach is more appropriate; (ii) when some properties may be missing, learning-based approaches are the most suitable. However, if the dependency between intermediate similarities is guaranteed, we recommend using logistic regression; otherwise, it is preferable to use the tree-based approach. As part of the Cognisearch project, we developed a general service architecture dedicated to the extraction of complex NEs on the web to supply information retrieval services. One of the main issues in this architecture is related to the consolidation of extracted information. The main problem raised by this is the computation of similarity between complex NEs. This similarity computation usually consists in two stages: (i) the first one computes the similarity between property values side-by-side; (ii) the second aggregates the obtained scores. Our contribution targets mainly this second stage. We propose three aggregation techniques: the first uses the linear combination for which the weights of the intermediate similarities were determined by calibration; the second implements logistic regression on a learning set to build a model to evaluate overall similarity from similarity scores between properties; the third uses decision trees to infer a learning model, making it possible to determine the overall similarity score from those of the different properties. We also propose a new approach which exploits the work of [4], to partition all the NEs into clusters. Each complex NE is then represented as a vector in the basis constituted by all the clusters. Finally, the vectorial model of [32] is used to calculate the similarity between these entities, by evaluating the cosine of the angle formed by their vectors. We experimented on all these approaches for the computation of similarity between events and between event performances in the indexing phase. In these two different contexts, the obtained results show that our approaches perform better than the state-of-the-art one used as a baseline (CombMNZ), and more specifically in the case where these Complex NEs may have missing properties. Therefore, this result presents a real impact in the information consolidation domain. As a matter of fact, the consolidated information often have missing properties. This is notably the case of the events extracted with our general architecture where 75% of them have non-entered properties. One short-term prospect will be to experiment these different approaches on larger datasets in order to confirm the observed trends and evaluate the approaches in terms of performances (computing resources). Another prospect will be the experimentation of similarity computation approaches in an information retrieval context. In particular, we will observe the behavior of these approaches when the number of nonentered search criteria is high, as well as the time needed to match the query to the NEs of the index in real use.II. General Architecture Framework
III. Related Work: NE Similarity Computation Process
IV. Propositions for Complex NE Similarity Computation

V. Experimentations
VI. Conclusion
References Retrieval of Complex Named Entities on the Web: Proposals for Similarity Computation
- A. Agresti and M. Kateri. Categorical Data Analysis. Springer, Berlin, Heidelberg, 2011. M. S. Bartlett. A note on the multiplying factors for various χ 2 approximations. Journal of the Royal Statistical Society. Series B (Methodological), 1954.
- K. Beard and V. Sharma. Multidimensional ranking for data in digital spatial libraries. International Journal on Digital Libraries, pages 153–160, 1997.
- H. Becker, M. Naaman, and L. Gravano. Learning similarity metrics for event identification in social media. In 3th ACM International Conference on Web search and data mining, pages 291–300. ACM, 2010.
- H. Bulskov, R. Knappe, and T. Andreasen. On measuring similarity for conceptual querying. In International Conference on Flexible Query Answering Systems, pages 100–111. Springer, 2002.
- N. Chinchor and P. Robinson. Muc-7 named entity task definition. In 7th Conference on Message Understanding, volume 29, 1997.
- N. R. Chopde and M. Nichat. Landmark based shortest path detection by using a* and haversine formula. International Journal of Innovative Research in Computer and Communication Engineering, 1(2):298–302, 2013.
- W. Cohen, P. Ravikumar, and S. Fienberg. A comparison of string metrics for matching names and records. In KDD Workshop on data cleaning and object consolidation, volume 3, pages 73–78, 2003.
- C. Da Costa Pereira, M. Dragoni, and G. Pasi. Multidimensional relevance: Prioritized aggregation in a personalized information retrieval setting. Information Processing & Management, 48(2):340–357, 2012.
- J. Davis and M. Goadrich. The relationship between precision-recall and ROC curves. In 23th International Conference on Machine Learning (ICML 2006), Pittsburgh, Pennsylvania, USA, 2006.
- Y. Dupont. La structuration dans les entités nommées. PhD thesis, Paris 3, 2017.
- R. Eberhart and J. Kennedy. A new optimizer using particle swarm theory. In 6th International Symposium on Micro Machine and Human Science, pages 39–43. IEEE, 1995.
- H. Federer. Geometric measure theory. Springer, 2014.
- A. Fotsoh, C. Sallaberry, and A. Le Parc-Lacayrelle. Named entity similarity computation: The case of social event entities. In 11th Workshop on Geographic Information Retrieval, (GIR 2017), Heidelberg, Germany, 2017.
- E. A. Fox and J. A. Shaw. Combination of Multiple Searches. In D. K. Harman, editor, 1st Text REtrieval Conference, pages 243–252, Gaithersburg, MD, USA, 1993.
- J. Friedman and B. E. Popescu. Gradient directed regularization for linear regression and classification. Technical report, Citeseer, 2003.
- C. Gupta and R. Grossman. Genic: A single pass generalized incremental algorithm for clustering. In International Conference on Data Mining (SIAM). SIAM, 2004.
- M. Halkidi, B. Nguyen, I. Varlamis, and M. Vazirgiannis. Thesus: Organizing web document collections based on link semantics. International Journal on Very Large DataBases (VLDB), 2003.
- L. Hill. Access to Geographic Concepts in Online Bibliographic Files: effectiveness of current practices and the potential of a graphic interface. PhD thesis, University of Pittsburgh, USA, 1990.
- P. Jaccard. Bulletin de la société vaudoise des sciences naturelles. Etude comparative de la distribution florale dans une portion des Alpes et des Jura, 37:547–579, 1901.
- M. A. Jaro. Advances in record-linkage methodology as applied to matching the 1985 census of tampa, florida. Journal of the American Statistical Association, 84(406):414–420, 1989.
- H. Khrouf and R. Troncy. De la modélisation sémantique des événements vers l’enrichissement et la recommandation. Revue d’Intelligence Artificielle, 2014.
- A. Le Parc-Lacayrelle, M. Gaio, and C. Sallaberry. La composante temps dans l’information géographique textuelle. Document Numérique, 2007.
- J. H. Lee. Analyses of multiple evidence combination. In ACM SIGIR Forum, volume 31, pages 267–276. ACM, 1997.
- V. I. Levenshtein. Binary codes capable of correcting deletions, insertions, and reversals. In Soviet physics doklady, volume 10, pages 707–710, 1966.
- A. E. Monge and C. Elkan. The field matching problem: Algorithms and applications. In KDD-96, pages 267–270, 1996.
- V. T. Nguyen, C. Sallaberry, and M. Gaio. Mesure de la similarité entre termes et labels de concepts ontologiques. In 10th Conference en Recherche d’Infomations et Applications (CORIA 2013), pages 415–430, Neuchâtel, Suisse, 2013.
- J. R. Quinlan. Induction of decision trees. Machine learning, 1(1):81–106, 1986.
- R. Rada, H. Mili, E. Bicknell, and M. Blettner. Development and application of a metric on semantic nets. IEEE Transactions on Systems, Man, and Cybernetics, 19(1):17–30, 1989.
- S. Rueben and G. Jakobson. Digital maps displaying searchresulting points-of-interest in user delimited regions, 2013. US Patent 8,510,045.
- C. Sallaberry, M. Gaio, D. Palacio, and J. Lesbegueries. Fuzzying GIS topological functions for GIR needs. In 5th ACM Workshop On Geographic Information Retrieval (GIR 2008), Napa Valley, California, USA, 2008.
- G. Salton. Introduction to modern information retrieval. McGraw-Hill, 1983.
- G. Salton and C. Buckley. Term-weighting approaches in automatic text retrieval. Information processing & management, 24(5):513–523, 1988.
- T. Scheffler, R. Schirru, and P. Lehmann. Matching points of interest from different social networking sites. Conference on Artificial Intelligence - KI 2012: Advances in Artificial Intelligence, 2012.
- S. Sekine, K. Sudo, and C. Nobata. Extended named entity hierarchy. In 3rd International Conference on Language Resources and Evaluation, Las Palmas, Canary Islands, Spain, 2002.
- L. Serrano, M. Bouzid, T. Charnois, S. Brunessaux, and B. Grilhères. Events extraction and aggregation for open source intelligence: From text to knowledge. In 25th International Conference on Tools with AI, Herndon, VA, USA, 2013.
- K. Sun, Y. Zhu, and J. Song. Progress and challenges on entity alignment of geographic knowledge bases. ISPRS International Journal of Geo-Information, 8(2):77, 2019.
- D. Walker, I. Newman, D. Medyckyj-Scott, and C. Ruggles. A system for identifying datasets for gis users. International Journal of Geographical Information Systems, 1992.
- J. Wang, K. Chen, E. Kayis, G. Gallego, J. Guerrero, R. Wang, and S. Jain. Tree-based regression, 2013. US Patent App. 13/528,972.
- W. E. Winkler. The state of record linkage and current research problems. Technical report, Statistical Research Division, US Census Bureau, 1999.
- Z. Wu and M. Palmer. Verbs semantics and lexical selection. In 32nd Annual Meeting on Association for Computational Linguistics, ACL ’94, pages 133–138, Stroudsburg, PA, USA, 1994.
- L. Yu, P. Qiu, X. Liu, F. Lu, and B. Wan. A holistic approach to aligning geospatial data with multidimensional similarity measuring. International journal of digital earth, 11(8):845– 862, 2018.
- C. Zhang, G. Zhou, Q. Yuan, H. Zhuang, Y. Zheng, L. Kaplan, S. Wang, and J. Han. Geoburst: Real-time local event detection in geo-tagged tweet streams. In 39th International Conference on Research and Development in Information Retrieval (ACM SIGIR), pages 513–522, 2016.
- Y. Zhu, A.-X. Zhu, J. Song, J. Yang, M. Feng, K. Sun, J. Zhang, Z. Hou, and H. Zhao. Multidimensional and quantitative interlinking approach for linked geospatial data. International Journal of Digital Earth, 10(9):923–943, 2017.
