
Rhizome Yield and Secondary Metabolite Production Implications of Growth Stimulants in Curcuma longa cv. Alleppey Supreme
Journal: Journal of Stress Physiology and Biochemistry @jspb
Article in issue: 3 т.22, 2026.
Free access
Curcuma longa cv. Alleppey Supreme is a high yielding turmeric variety. With the objective of further improving the yield, this plant was treated with various concentrations of seashell powder, fish compost, cow urine, coconut water, salicylic acid, and zinc sulphate. The study evaluated the effect of these substances on the morphological features, rhizome yield parameters, chlorophyll content, oleoresin and essential oil content and HPTLC fingerprints of powdered rhizome samples. There was a significant increase in vegetative growth, chlorophyll content, and yield of plants by the foliar application of 10% cow urine and 15% coconut water. The plants treated with 15% coconut water produced more curcuminoids. The plants treated with 0.1% salicylic acid were found to be eustressed in terms of vegetative growth, rhizome yield and secondary metabolite production. Seashell powder (150g/kg) and fish compost (150g/kg) were found as eustresses since the treated plants showed a moderately positive response in terms of biomass and rhizome yield, and a strongly positive response in terms of secondary metabolite production. The study proves that the use of low-cost substances like sea shell powder, fish compost, cow urine and coconut water help improve the yield and quality of Alleppey Supreme variety of turmeric.
Short address: https://sciup.org/143186167
IDS: 143186167
Text of the scientific article Rhizome Yield and Secondary Metabolite Production Implications of Growth Stimulants in Curcuma longa cv. Alleppey Supreme
Turmeric ( Curcuma longa L.) became a vital plant for humans due to its interesting array of biological qualities. Besides having the properties of spice condiment colouring and cosmetic agent and food preservative the plant got attention as a mighty cure for various ailments (Prasad & Aggarwal 2011). India provides about 80% of the world’s supply of commercial turmeric (Tholkappian & Devi 2013). The plant is a perennial herb having large alternate leaves and a rhizomatous underground stem. The rhizomes are rich in secondary metabolites which mainly consist of nonvolatile polyphenolic compounds called curcuminoids and volatile essential oils (Nasri et al. 2014). Although the medicinal properties of turmeric were known to ancient people for centuries modern plant phytochemical studies have paid particular attention to it in recent decades. Institutes like ICAR-IISR adopt scientific methods to expand farm-based cultivation of high-yielding and short-duration varieties of turmeric in vast areas in different parts of India (Sasikumar et al. 2005). Alleppey supreme variety of turmeric is one such variety that is popularised among farmers due to its beneficial features.
During its cultivation turmeric is exposed to many chemical and nutritional substances. A balanced supply of nutrients is necessary for the production of rhizomes and secondary metabolites in turmeric. Growth stimulants trigger plant response in a dose-dependent manner. Nutrient supply may become eustress (beneficial to plant growth) or distress (detrimental to plant growth) during the period of its growth and development (Vargas-Hernandez et al. 2017). During its growth every crop plant is subjected to a variety of physical chemical and biological conditions. Nutritional stimulants excess or deficient seriously influence plant morphological expression yield and secondary metabolite production (Akamine et al. 2007). As the popularity and acceptance of organic food production are increasing worldwide several growth stimulants are being used as nutrients for maintaining the sustainability of crop production. Less environmental damage better food quality and cost-effectiveness in usage make such nutrients popular among farmers. However the investigations regarding the stress impact of such substances imparted on plant growth and productivity are less evaluated compared to other chemical fertilizers (Calabi-Floody et al. 2018). The present study was conducted to identify the influence of soil application of sea shell powder and fish compost as well as the foliar application of coconut water cow urine salicylic acid and ZnSO4 in plant growth yield and production of secondary metabolites in turmeric (Curcuma longa cv. Alleppey Supreme).
MATERIALS AND METHODS
Plant material
The IISR Alleppey Supreme variety of Turmeric ( Curcuma longa cv. Alleppey Supreme) was the plant material selected for the present study. Fresh rhizomes of IISR Alleppey Supreme variety of C. longa were obtained from the Indian Institute of Spices Research Kozhikode Kerala. Finger rhizomes of approximately 30g weight were selected as propagules.
Experimental setup
The propagules of the IISR Alleppey Supreme variety were planted in grow bags containing potting mixture during the first week of June. The potting mixture for the study was prepared using soil cocopeat and cow dung which were mixed in a 3:1:1 ratio. 3kilograms of potting mixture was filled in grow bags having 44 cm*24cm size. Twelve replicates of turmeric propagules for different concentrations of each stress were kept along with the control. These were arranged in Randomised Block Design manner under a poly house. The temperature rainfall and relative humidity during the period of study (June to January) were 30.5 ± 0.820C 13.98 ± 9.49 cm and 86.24 ± 5.01 % respectively.
Physicochemical parameters of soil
An analysis of soil physicochemical properties and nutrient content was conducted at the CWRDM Kozhikode Kerala. Soil used for the experiment was having pH 5.50 EC 0.397mS/cm. TDS 211.0mg/L OC 2.05% available Nitrogen 229.63kg/ha Phosphorus 182kg/ha Potassium 385.10kg/ha Calcium 330.50mg/kg Magnesium 737.44mg/kg Sulphur 51.36mg/kg and Boron 2.78mg/kg.
Stress application
Three different concentrations of seashell powder (50g/kg 100g/kg and 150g/kg each) and fish waste compost (50g/kg 100g/kg and 150g/kg each) were added separately to 1kg of the potting mixture before planting the propagules. The foliar application of 5% 10% and 15% of cow urine 5% 10% and 15% of coconut water 0.1% 0.2% and 0.3% of Salicylic acid and 0.1% 0.2% and 0.3% ZnSO 4 was carried out in alternative days from 60 to 120 days of plant growth. 200ml of each growth stimulant was applied as foliar sprays per plant.
Plant growth
Morphological expressions of the plants in terms of plant height leaf length leaf breadth number of tillers and number of leaves per tiller were observed and evaluated after 120 days of maturity.
Chlorophyll content of leaves
The chlorophyll content of leaves was estimated using Arnon’s (1949) method. One gram of finely cut fresh leaves was taken and ground with 20 – 40ml of 80% acetone. It was then centrifuged at 5000 –10000 rpm for 5mins. The supernatant was transferred and the procedure was repeated till the residue becomes colourless. The absorbance of the solution was read at 645nm and 663nm against the solvent (acetone) blank. Following equations were used to calculate chlorophyll a chlorophyll b and total chlorophyll concentrations: Total Chlorophyll: 20.2(A645) + 8.02(A663)
Chlorophyll a: 12.7(A663) – 2.69(A645)
Chlorophyll b: 22.9(A645) – 4.68(A663)
Rhizome yield
Rhizomes were harvested after 200 days of maturity washed and the fresh weights of rhizomes obtained from each grow bag were measured using a digital weighing balance. The yield-related characters like the number of mother rhizomes number of primary fingers number of secondary fingers the total weight of rhizomes weight of mother rhizomes the weight of primary fingers and weight of secondary fingers were recorded. Then these rhizomes were sliced using a hand slicer and kept under open sunlight for 5 days. The dry weights were then recorded. The percentage yield of dried samples was calculated by the following equation:
The percentage yield of dried samples = Fresh weight of sample/Dry weight of sample ×100 Extraction of oleoresin and essential oil
Dried and finely powdered rhizome samples of different stress treatments meshed in 0.64 mm2 mesh size and oleoresins of the samples were extracted by the Soxhlet extraction method using methanol as the solvent (Ali et al. 2015). Essential oils of the samples were extracted by hydrodistillation method using the Clevenger apparatus (Silva et al. 2005). The unit percentage of oleoresin and essential oil in 100g of each sample was estimated (Priyadarsini 2014).
HPTLC
The phytochemical analysis of the oleoresins obtained from the samples was done by the HPTLC method. The HPTLC profiles of the samples were developed in CAMAG Twin Trough Chamber 20 * 10cm. The sample application was done on a plate size (X*Y) 10.0 * 10.0cm in which silica gel 60F was used as the stationary phase. Toluene: ethyl acetate: methanol (7:3:1) was used as the mobile phase. CAMAG automatic TLC sampler 4(ATS4) of syringe size 25μl was used for the sample application. On each plate there were five tracks of which tracks 1 2 and 3 loaded with samples of three different concentrations of single stimulant and 4 and 5 loaded with control and marker respectively. The TLC plates were dried and analysis was performed on a CAMAG TLC Scanner. The area percentage of the compounds separated was recorded using winCATS planar chromatography manager.
Statistical analysis
Statistical analysis of the data was conducted using the software SPSS Version 25. One-way ANOVA and Duncan’s multiple range tests were conducted to analyze if there were significant differences between various treatments. Values are represented as means ± standard error of 12 replicates (n=12).
Statistical analysis of the data was performed with Statistica 6.0 program. Data were expressed as means ± SE the Student’s t-test was used for detection of statistical difference.
RESULTS AND
The morphological parameters of growth stimulant-treated plants improved compared to control plants with the exception of 0.2% and 0.3% salicylic acid-treated plants. The plants treated with coconut water as well as cow urine had the highest values for plant height leaf length leaf width and tiller number. Soil treatments of 150g/kg seashell powder and 150g/kg fish compost at the time of planting also showed high plant growth compared to control plants. The highest number of leaves per tiller was produced by plants treated with 0.1% of salicylic acid. Values representing the morphological parameters at 60 90 and 120 days of growth were represented in Tables 1 2 and 3 respectively.
Chlorophyll content
The plants treated with 15% coconut water and 0.3% salicylic acid had the highest content of chlorophyll a and chlorophyll b respectively. Total chlorophyll content was found to be highest in plants treated with 15% cow urine. Plants treated with coconut water cow urine Salicylic acid and fish compost exhibited high amount of total chlorophyll content in leaf samples. Plants treated with ZnSO 4 showed a significant reduction in chlorophyll content compared to control plants (Figure 1).
Rhizome yield
Rhizome yield was found to be in proportion with morphological characters except for ZnSO 4 -treated plants. The highest number of primary fingers was produced by plants treated with 15% coconut water and highest number of secondaries by plants treated with 10% cow urine. The number of mother rhizomes the weight of mother rhizomes and the weight of primaries and secondaries were also higher in these plants. The average fresh weight and dry weight of the harvested rhizomes were found highest in plants treated with 10% cow urine and the percentage yield in terms of dry weight was found highest in plants treated with 100g/kg fish compost (Tables 4 & 5).
Oleoresin and essential oil content
According to IISR standard value the unit percentage of oleoresin in the Alleppey Supreme variety is 16%. From the given treatments 100g/kg and 150g/kg seashell powder 100g/kg fish compost 10% cow urine and 10% coconut water treated plants yielded above 16% of oleoresin. The unit percentage of essential oil was found highest in plants treated with 0.1% ZnSO4 which is 3.75 and in all other treatments essential oil content was more or less in line with the IISR standard value of 2.7. A clear positive result was found only in 150g/kg seashell powder 10% cow urine and 10% coconut water treated plants in terms of morphological expression biomass production and secondary metabolite production. However no such relation was found in ZnSO4-treated plants as it negatively influenced biomass production and chlorophyll content of leaves (Table 6).
HPTLC Analysis
Several literatures reported extensive studies of curcuminoid separation by HPTLC which prove that the sample bands at the range of Rf 0.8 0.5 and 0.3 corresponded to curcuminoids 1 2 and 3 that is curcumin demethoxycurcumin and bisdemethoxycurcumin respectively (Pathania et al. 2006). The HPTLC profile of Curcuma longa treated with three different concentrations of seashell powder (50g/kg 100g/kg and 150g/kg) control and standard marker are grouped as profile 1. All tracks showed a similar pattern of curcuminoids separated as three bands. Track 3 (150g/kg seashell powder treated plants) presented a larger area of curcuminoids compared to other treated plants and control. The visualization of bands under 254nm 366nm and at 550nm showed similar results i.e. the area percentage of compounds separated in track 3 showed significant increase in the production of curcuminoids. The total area of compounds separated in tracks 1 2 and 3 was higher compared to the control. So the soil application of seashell powder prior to planting significantly influenced the production of secondary metabolites (Figure 2).
The HPTLC profile of turmeric rhizome extracts of plants treated with 50g/kg 100g/kg and 150g/kg fish compost along with control and marker were grouped under profile 2. The area percentage of compounds between Rf 0.2 to 0.3 indicate bisdemethoxycurcumin which was strongly significant in track 1 (50g/kg fish compost) and 2 (100g/kg fish compost) and demethoxycurcumin and curcumin in track 3 (150g/kg fish compost). The area percentage of separated compounds in all treatments was higher compared to control plants (Figure 3).
Five tracks of profile 3 represent rhizome extracts isolated from plants treated with 5% 10% and 15% cow urine control and marker respectively. The area percentage of compounds of Rf values in the range of 0.7 to 0.92 indicate curcuminoid 1 which was higher in control plants compared to treated plants. Rf values from 0.4 to 0.50 indicating curcuminoid 2 was also highest in control plants. The area percentage of compounds in the range of 0.1 to 0.3 indicate curcumin 3 which was found higher in all treated plants compared to control plants. From the results it was clear that the foliar application of cow urine has no significant effect on the production of curcumin and demethoxycurcumin even though it enhanced the vegetative growth and rhizome yield in turmeric. But it was clear that the production of bisdemethoxycurcumin gets elevated by the application of cow urine. The increase in total area of separated compounds at different Rf values in all treated plants compared to control indicated a significant positive result in the production of secondary metabolites (Figure 4).
Figure 5 represents HPTLC profile of 5% (Track 1) 10% (Track 2) and 15% (Track 3) coconut water treated plants control plants (Track 4) and marker (Track 5). From the HPTLC profiles it was clear that the area percentage of separated compounds at the range of Rf values 0.3 0.50 and 0.80 were significantly higher in all treated plants T1 T2 and T3 compared to control plants. Strong significance was found in plants treated with a foliar application of 15% coconut water. So the results of the present study support the use of coconut water for enhancing the vegetative growth yield and secondary metabolite production in the Alleppey Supreme variety of turmeric (Figure 5).
HPTLC Profile 5 which comprises tracks 1 2 and 3 represents extract isolated from plants treated with foliar application of salicylic acid 0.1% 0.2% and 0.3% respectively. Tracks 4 and 5 represent control and marker respectively. From the area percentage of compounds at different Rf values it was clear that curcuminoids 1 at the range of Rf 0.70 to 0.97 has no significant presence in all the treatments compared to the control plants. But the production of curcuminoid 3 was highly significant in all treatments compared to control plants (Figure 6).
Table 1 Effect of various treatments on the morphological parameters of plants at 60 days of growth
|
Treatments |
Plant Height (cm) |
Leaf Length (cm) |
Leaf Breadth (cm) |
Number of Tillers |
Number of Leaves/Tiller |
|
Control |
43.55 ± 2.61cd |
26.85±1.32d |
9.60±0.60c |
1.00±0.00c |
5.20±0.33d |
|
SSP 50g/kg |
59.05±2.47 a |
29.37±2.02b |
11.17±0.65a |
1.10±0.10b |
6.70±0.30a |
|
SSP100g/kg |
55.04±2.37 ab |
29.05±0.95b |
10.16±0.45b |
1.00±0.00c |
6.40±0.22b |
|
SSP150g/kg |
59.75±2.32a |
29.08±1.55b |
11.78±0.43a |
1.00±0.00c |
6.20±0.24b |
|
FC 50g/kg |
46.28±3.22c |
25.27±1.37d |
8.97±0.78d |
1.00±0.00c |
5.60±0.33c |
|
FC 100g/kg |
50.88±2.93b |
27.08±1.83c |
10.51±0.75b |
1.00±0.00c |
5.40±0.30d |
|
FC 150g/kg |
54.95±2.36ab |
29.32±1.42b |
10.85±0.51b |
1.00±0.10b |
6.30±0.26b |
|
CU 5% |
56.87±2.79ab |
31.68±1.56a |
11.24±0.43a |
1.00±0.00c |
5.50±0.16c |
|
CU 10% |
54.25±2.37ab |
31.05±1.56a |
11.16±0.67a |
1.00±0.00c |
6.10±0.37b |
|
CU 15% |
50.24±4.01b |
29.40±2.40b |
11.02±0.84a |
1.10±0.10b |
5.40±0.30d |
|
CW 5% |
59.61±1.39a |
31.18±1.15a |
11.80±0.57a |
1.20±0.13a |
6.30±0.21b |
|
CW 10% |
54.33±2.65ab |
27.90±1.45c |
11.65±0.62a |
1.10±0.10b |
5.80±0.20c |
|
CW 15% |
55.08±3.58ab |
30.50±2.35ab |
11.65±0.90a |
1.00±0.00c |
5.50±0.22c |
|
SA 0.1% |
56.74±1.73ab |
30.99±1.67ab |
11.62±0.63a |
1.00±0.00c |
5.90±0.23c |
|
SA 0.2% |
42.77±3.04cd |
24.70±1.62e |
8.83±0.45d |
1.20±0.13a |
5.50±0.22c |
|
SA 0.3% |
44.30±3.66cd |
24.46±1.59e |
9.42±0.56c |
1.00±0.00c |
5.40±0.26d |
|
ZnSO 4 0.1% |
48.95±3.92bc |
26.89±2.23d |
9.40±0.52c |
1.10±0.10b |
5.50±0.16c |
|
ZnSO 4 0.2% |
47.00±3.20bc |
25.86±1.60d |
10.10±0.30b |
1.00±0.00c |
5.30±0.26d |
|
ZnSO 4 0.3% |
40.85±4.25d |
25.15±2.27d |
8.85±0.72d |
1.00±0.00c |
5.30±0.26d |
Values are represented as mean ± SE (n=12). The different letters following the values in the same columns indicate a significant difference between various treatments (Duncan’s test p ≤ 0.05). SSP –Sea shell powder FC-Fish compost SA- Salicylic acid CU-Cow urine CW- Coconut water treated plants
Table 2 Effect of various treatments on the morphological parameters of plants at 90 days of growth.
|
Treatments |
Plant Height (cm) |
Leaf length (cm) |
Leaf Breadth (cm) |
Number of Tillers |
Number of Leaves /Tiller |
|
Control |
65.24±1.62de |
31.91±1.11f |
11.16±0.39c |
1.30±0.15f |
7.50±0.16c |
|
SSP 50g/kg |
73.67±2.29bc |
39.68±1.28a |
12.51±0.51b |
1.80±0.13cd |
9.10±0.27a |
|
SSP100g/kg |
76.65±2.95b |
39.10±0.67a |
13.09±0.59a |
1.90±0.10c |
8.90±0.23b |
|
SSP150g/kg |
79.95±1.94b |
39.88±0.85a |
13.35±0.43a |
1.70±0.15d |
8.70±0.21b |
|
FC 50g/kg |
64.08±4.40e |
33.35±2.14e |
10.78±0.53d |
1.30±0.15f |
7.90±0.37c |
|
FC 100g/kg |
66.70±3.03de |
32.04±1.67ef |
10.75±0.60d |
1.10±0.10g |
7.30±0.36c |
|
FC 150g/kg |
71.99±3.20c |
35.60±1.04d |
11.72±0.47c |
1.40±0.16ef |
7.80±0.21c |
|
CU 5% |
76.53±2.97b |
37.46±1.10b |
12.78±0.42b |
1.70±0.15d |
7.20±0.20c |
|
CU 10% |
73.02±4.55bc |
36.19±1.42c |
12.75±0.44b |
1.80±0.13cd |
8.20±0.53b |
|
CU 15% |
68.93±3.42cd |
37.36±1.30b |
12.57±0.74b |
1.90±0.10c |
7.30±0.21c |
|
CW 5% |
74.57±2.05bc |
38.41±1.25ab |
12.70±0.36b |
2.60±0.16a |
6.90±0.23d |
|
CW 10% |
74.90±2.27bc |
37.38±0.51b |
12.98±0.45b |
2.10±0.17b |
7.30±0.21c |
|
CW 15% |
80.96±2.11a |
36.80±1.75c |
12.65±0.58b |
1.70±0.21d |
6.60±0.16d |
|
SA 0.1% |
70.04±3.33cd |
37.13±1.28b |
12.82±0.48b |
1.60±0.16de |
7.80±0.13c |
|
SA 0.2% |
54.89±2.91f |
29.70±1.36g |
10.27±0.51d |
1.90±0.10c |
7.30±0.26c |
|
SA 0.3% |
58.47±2.30ef |
30.59±1.36fg |
10.95±0.48d |
1.50±0.16e |
7.00±0.25c |
|
ZnSO 4 0.1% |
64.80±2.68e |
35.65±1.37d |
11.55±0.34c |
1.70±0.15d |
6.90±0.17d |
|
ZnSO 4 0.2% |
67.20±2.02d |
32.94±0.97ef |
10.58±0.26d |
1.50±0.22e |
6.80±0.20d |
|
ZnSO 4 0.3% |
67.05±2.40d |
30.95±1.45fg |
10.75±0.30d |
1.40±0.16ef |
7.20±0.13c |
Values are represented as mean ± SE (n=12). The different letters following the values in the same columns indicate a significant difference between various treatments (Duncan’s test p ≤ 0.05). SSP –Sea shell powder FC-Fish compost SA- Salicylic acid CU-Cow urine CW- Coconut water treated plants
Table 3 Effect of various treatments on the morphological parameters of plants at 120 days of growth
|
Treatments |
Plant Height (cm) |
Leaf Length (cm) |
Leaf Breadth (cm) |
Number of Tillers |
Number of Leaves/Tiller |
|
Control |
80.59±1.53d |
38.20±0.70de |
12.88±0.20c |
1.90±0.23c |
8.60±0.22c |
|
SSP 50g/kg |
84.25±1.84c |
43.3±0.68b |
14.33±0.31a |
2.10±0.10b |
9.20±0.16b |
|
SSP100g/kg |
84.25±1.32c |
41.55±0.79c |
13.93±0.35b |
2.00±0.00b |
9.20±0.13b |
|
SSP150g/kg |
89.75±2.37ab |
44.8±0.69ab |
14.53±0.24a |
2.60±0.16b |
9.20±0.20b |
|
FC 50g/kg |
83.24±2.68cd |
39.30±1.03d |
12.20±0.41d |
1.80±0.24c |
8.20±0.24d |
|
FC 100g/kg |
84.2±1.54c |
43.3±0.68b |
14.3±0.31a |
2.10±0.10b |
9.20±0.16b |
|
FC 150g/kg |
89.9±3.10ab |
41.6±0.77c |
12.49±0.54c |
2.00±0.14b |
9.00±0.25b |
|
CU 5% |
90.50±2.97ab |
44.00±1.07ab |
14.05±0.44a |
2.20±0.20b |
8.80±0.29c |
|
CU 10% |
91.00±3.21ab |
42.13±1.16bc |
13.71±0.41b |
2.20±0.20b |
9.20±0.48b |
|
CU 15% |
90.05±2.21ab |
44.20±1.67ab |
14.08±0.51a |
2.70±0.21b |
9.30±0.26b |
|
CW 5% |
94.50±3.24a |
44.30±1.91ab |
14.45±0.30a |
3.90±0.27a |
8.90±0.23c |
|
CW 10 % |
92.20±3.28ab |
44.45±1.35ab |
14.11±0.45a |
3.20±0.44a |
8.60±0.16c |
|
CW 15% |
95.30±1.77a |
46.90±0.65a |
14.60±0.16a |
3.00±0.42a |
8.40±0.16d |
|
SA 0.1% |
88.00±1.52b |
43.65±1.28b |
13.73±0.40b |
3.00±0.39a |
9.80±0.24a |
|
SA 0.2% |
72.91±3.80e |
37.6±1.15e |
11.53±0.54d |
2.20±0.13b |
8.60±0.33c |
|
SA 0.3% |
72.30±2.91e |
39.34±1.20d |
11.69±1.20d |
2.20±0.24b |
8.80±0.38c |
|
ZnSO 4 0.1% |
87.70±1.98b |
41.13±0.50c |
13.06±0.24b |
2.40±0.16b |
8.40±0.30d |
|
ZnSO 4 0.2% |
83.25±2.68cd |
39.40±1.03d |
12.19±0.41d |
1.80±0.24c |
8.20±0.24d |
|
ZnSO 4 0.3% |
85.86±1.36bc |
39.32±1.20d |
12.70±0.38c |
2.10±0.34b |
8.20±0.13d |
Values are represented as mean ± SE (n=12). The different letters following the values in the same columns indicate a significant difference between various treatments (Duncan’s test p≤0.05). SSP –Sea shell powder FC-Fish compost SA- Salicylic acid CU-Cow urine CW- Coconut water treated plants
Table 4 Effects of various treatments on yield related parameters of Alleppey Supreme variety
|
Sl No. |
Treatments |
NoMR |
NoP |
NoS |
WMR |
WP |
WS |
|
1 |
Control |
1.10±0.10c |
4.1±0.27b |
8.30±0.53e |
27.18±2.12e |
75.00±7.56ef |
141.5±13.84d |
|
2 |
SSP 50g/kg |
1.20±0.20c |
3.5±0.22c |
10.30±0.73d |
35.05±3.31d |
100.75±5.51de |
120.8±15.51de |
|
3 |
SSP 100g/kg |
1.10±0.10c |
4.1±0.54b |
12.60±1.00c |
31.80±2.58d |
109.10±14.90de |
147.7±24.67cd |
|
4 |
SSP 150g/kg |
1.30±0.15c |
4.5±0.42b |
13.50±1.40bc |
49.00±4.59b |
135.10±19.94cd |
198.00±37.49bc |
|
5 |
FC 50g/kg |
1.00±0.00c |
4.6±0.49b |
9.90±0.90de |
33.50±5.05d |
136.00±18.39cd |
164.5±19.81cd |
|
6 |
FC 100g/kg |
1.20±0.13c |
4.5±0.58b |
11.40±1.92cd |
37.80±8.94d |
120.50±38.16d |
192.6±43.87bc |
|
7 |
FC 150g/kg |
1.20±0.13c |
4.0±0.33b |
12.30±1.08c |
41.50±5.47c |
111.50±13.22de |
179.00±23.30c |
|
8 |
CU 5% |
1.50±0.22b |
5.2±0.75a |
11.50±0.85cd |
44.10±8.86c |
140.90±31.57c |
210.50±49.28b |
|
9 |
CU 10% |
1.80±0.38b |
5.3±0.53a |
17.00±2.27a |
43.50±5.16c |
188.70±17.14a |
252.70±52.23a |
|
10 |
CU 15% |
1.60±0.16b |
5.2±0.77a |
14.20±1.49b |
42.95±4.42c |
164.35±17.82b |
224.10±30.78ab |
|
11 |
CW 5% |
1.40±0.22c |
5.6±0.40a |
10.80±0.74d |
47.90±9.68b |
146.40±34.85bc |
211.30±46.11ab |
|
12 |
CW 10% |
1.30±0.15c |
5.6±0.42a |
14.90±0.80b |
42.10±3.08c |
140.90±13.33c |
231.95±10.74ab |
|
13 |
CW 15% |
2.30±0.21a |
5.5±0.76a |
13.40±1.89bc |
63.70±5.09a |
158.60±27.24bc |
227.10±47.94ab |
|
14 |
SA 0.1% |
1.30±0.15c |
4.5±0.34b |
11.80±0.82cd |
50.25±4.14b |
126.96±14.18cd |
182.60±18.55bc |
|
15 |
SA 0.2% |
1.70±0.21b |
3.5±0.30c |
9.80±1.03de |
42.45±6.64c |
98.70±7.43e |
130.20±20.18de |
|
16 |
SA 0.3% |
1.10±0.10c |
3.7±0.44c |
9.60±0.70de |
30.15±3.72d |
104.30±8.31de |
119.75±9.19e |
|
17 |
ZnSO 4 0.1% |
1.00±0.00c |
4.4±0.40b |
8.90±0.70e |
37.00±2.00d |
82.50±7.28ef |
129.33±13.62de |
|
18 |
ZnSO 4 0.2% |
1.00±0.00c |
3.4±0.30c |
9.30±1.32de |
26.40±2.45e |
76.35±5.20ef |
154.40±22.96cd |
|
19 |
ZnSO 4 0.3 % |
1.00±0.00c |
4.0±0.42b |
8.20±0.64e |
24.00±2.60e |
73.10±9.14f |
87.75±12.29f |
Values are represented as mean ± SE (n=12). The different letters following the values in the same columns indicate a significant difference between various treatments (Duncan’s test p≤0.05). SSP –Sea shell powder FC-Fish compost SA- Salicylic acid CU-Cow urine CW- Coconut water treated plants
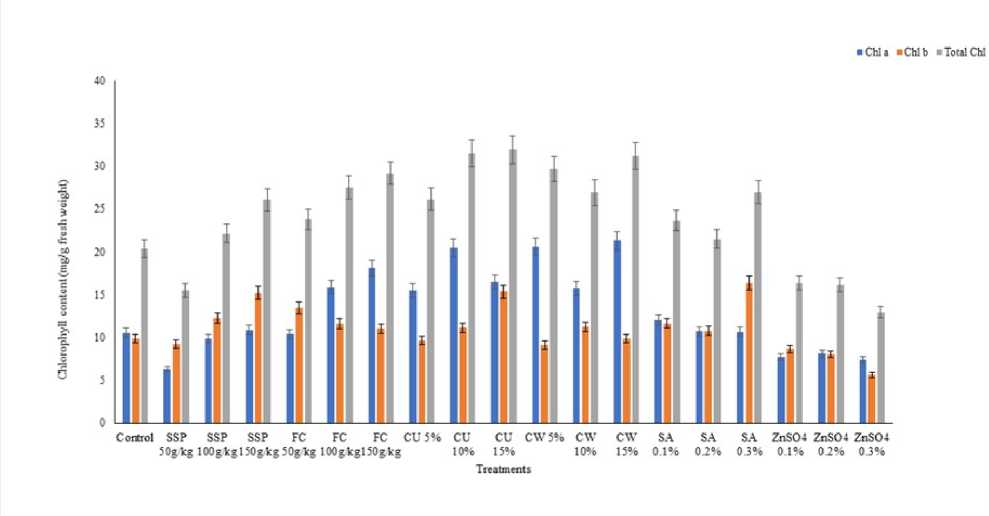
Figure 1. Effect of various treatments on the chlorophyll content of Alleppey Supreme variety
Table 4 Effects of various treatments on yield related parameters of Alleppey Supreme variety
|
Sl No. |
Treatments |
NoMR |
NoP |
NoS |
WMR |
WP |
WS |
|
1 |
Control |
1.10±0.10c |
4.1±0.27b |
8.30±0.53e |
27.18±2.12e |
75.00±7.56ef |
141.5±13.84d |
|
2 |
SSP 50g/kg |
1.20±0.20c |
3.5±0.22c |
10.30±0.73d |
35.05±3.31d |
100.75±5.51de |
120.8±15.51de |
|
3 |
SSP 100g/kg |
1.10±0.10c |
4.1±0.54b |
12.60±1.00c |
31.80±2.58d |
109.10±14.90de |
147.7±24.67cd |
|
4 |
SSP 150g/kg |
1.30±0.15c |
4.5±0.42b |
13.50±1.40bc |
49.00±4.59b |
135.10±19.94cd |
198.00±37.49bc |
|
5 |
FC 50g/kg |
1.00±0.00c |
4.6±0.49b |
9.90±0.90de |
33.50±5.05d |
136.00±18.39cd |
164.5±19.81cd |
|
6 |
FC 100g/kg |
1.20±0.13c |
4.5±0.58b |
11.40±1.92cd |
37.80±8.94d |
120.50±38.16d |
192.6±43.87bc |
|
7 |
FC 150g/kg |
1.20±0.13c |
4.0±0.33b |
12.30±1.08c |
41.50±5.47c |
111.50±13.22de |
179.00±23.30c |
|
8 |
CU 5% |
1.50±0.22b |
5.2±0.75a |
11.50±0.85cd |
44.10±8.86c |
140.90±31.57c |
210.50±49.28b |
|
9 |
CU 10% |
1.80±0.38b |
5.3±0.53a |
17.00±2.27a |
43.50±5.16c |
188.70±17.14a |
252.70±52.23a |
|
10 |
CU 15% |
1.60±0.16b |
5.2±0.77a |
14.20±1.49b |
42.95±4.42c |
164.35±17.82b |
224.10±30.78ab |
|
11 |
CW 5% |
1.40±0.22c |
5.6±0.40a |
10.80±0.74d |
47.90±9.68b |
146.40±34.85bc |
211.30±46.11ab |
|
12 |
CW 10% |
1.30±0.15c |
5.6±0.42a |
14.90±0.80b |
42.10±3.08c |
140.90±13.33c |
231.95±10.74ab |
|
13 |
CW 15% |
2.30±0.21a |
5.5±0.76a |
13.40±1.89bc |
63.70±5.09a |
158.60±27.24bc |
227.10±47.94ab |
|
14 |
SA 0.1% |
1.30±0.15c |
4.5±0.34b |
11.80±0.82cd |
50.25±4.14b |
126.96±14.18cd |
182.60±18.55bc |
|
15 |
SA 0.2% |
1.70±0.21b |
3.5±0.30c |
9.80±1.03de |
42.45±6.64c |
98.70±7.43e |
130.20±20.18de |
|
16 |
SA 0.3% |
1.10±0.10c |
3.7±0.44c |
9.60±0.70de |
30.15±3.72d |
104.30±8.31de |
119.75±9.19e |
|
17 |
ZnSO 4 0.1% |
1.00±0.00c |
4.4±0.40b |
8.90±0.70e |
37.00±2.00d |
82.50±7.28ef |
129.33±13.62de |
|
18 |
ZnSO 4 0.2% |
1.00±0.00c |
3.4±0.30c |
9.30±1.32de |
26.40±2.45e |
76.35±5.20ef |
154.40±22.96cd |
|
19 |
ZnSO 4 0.3 % |
1.00±0.00c |
4.0±0.42b |
8.20±0.64e |
24.00±2.60e |
73.10±9.14f |
87.75±12.29f |
Values are represented as mean ± SE (n=12). The different letters following the values in the same columns indicate a significant difference between various treatments (Duncan’s test p≤0.05). SSP –Sea shell powder FC-Fish compost SA- Salicylic acid CU-Cow urine CW- Coconut water treated plants
Table 5 Effect of various treatments on total fresh weight dry weight and percentage of dry yield of Alleppey Supreme variety
|
Sl No. |
Treatments |
Total fresh weight (g) |
Total dry weight (g) |
Dry yield (%) |
|
1 |
Control |
245.48 |
45 |
18.3 |
|
2 |
SSP 50g/kg |
257.7 |
48 |
18.6 |
|
3 |
SSP 100g/kg |
288.6 |
56 |
19.4 |
|
4 |
SSP 150g/kg |
382.1 |
73 |
19 |
|
5 |
FC 50g/kg |
334 |
59 |
17.7 |
|
6 |
FC 100g/kg |
350.9 |
76 |
21.7 |
|
7 |
FC 150g/kg |
332 |
70.5 |
21.2 |
|
8 |
CU 5% |
395.5 |
75 |
18.96 |
|
9 |
CU 10% |
484.9 |
85 |
17.5 |
|
10 |
CU 15% |
431.4 |
75.5 |
17.5 |
|
11 |
CW 5% |
405.6 |
70.5 |
17.4 |
|
12 |
CW 10% |
414.95 |
75.3 |
18 |
|
13 |
CW 15% |
449.4 |
68.5 |
15 |
|
14 |
SA 0.1% |
359.81 |
70.5 |
19.6 |
|
15 |
SA 0.2% |
271.35 |
52 |
19.16 |
|
16 |
SA 0.3% |
254.2 |
45.3 |
17.8 |
|
17 |
ZnSO 4 0.1% |
235.9 |
42 |
17.8 |
|
18 |
ZnSO 4 0.2% |
257.15 |
47.6 |
18.5 |
|
19 |
ZnSO 4 0.3% |
184.85 |
35 |
18.9 |
SSP –Sea shellpowder FC-Fishcompost SA- Salicylicacid CU-Cowurine CW- Coconut water treated plants
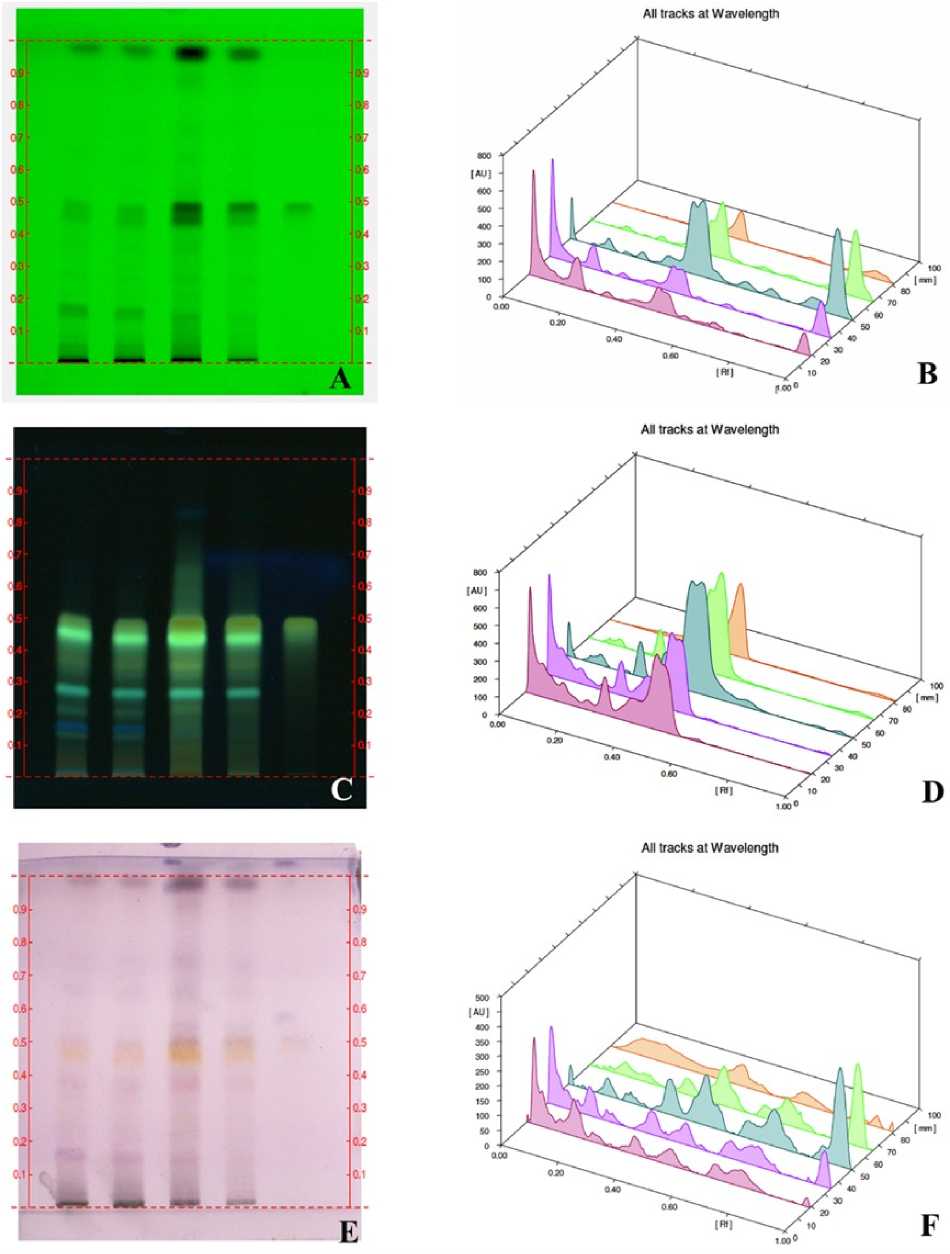
Figure 2. HPTLC Profile of methanolic extracts of Alleppey supreme variety treated with seashell powder. A&B: HPTLC chromatogram and densitometric scanning image under 254nm respectively. C&D: HPTLC chromatogram and densitometric scanning image under 366nm respectively. E&F: HPTLC chromatogram and densitometric scanning image under 550nm respectively. Track-1: 50g/kg Track-2: 100g/kg Track-3: 150g/kg Track-4: Control Track-5: Marker.
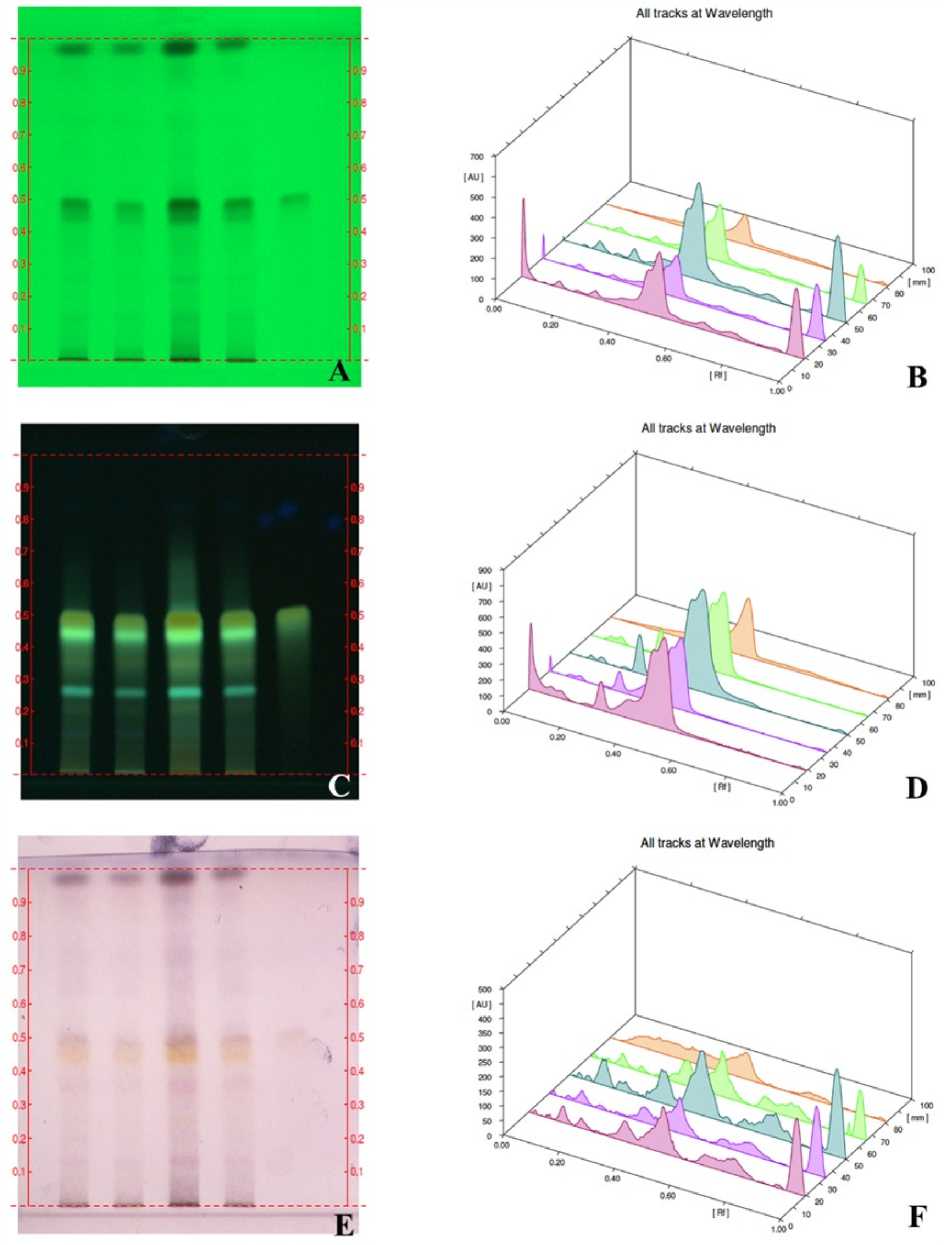
Figure 3. HPTLC Profile of methanolic extracts of Alleppey supreme variety treated with fish compost. A&B : HPTLC chromatogram and densitometric scanning image under 254nm respectively. C&D : HPTLC chromatogram and densitometric scanning image under 366nm respectively. E&F : HPTLC chromatogram and densitometric scanning image under 550nm respectively. Track-1: 50g/kg Track-2: 100g/kg Track-3: 150g/kg Track-4: Control Track-5: Marker.
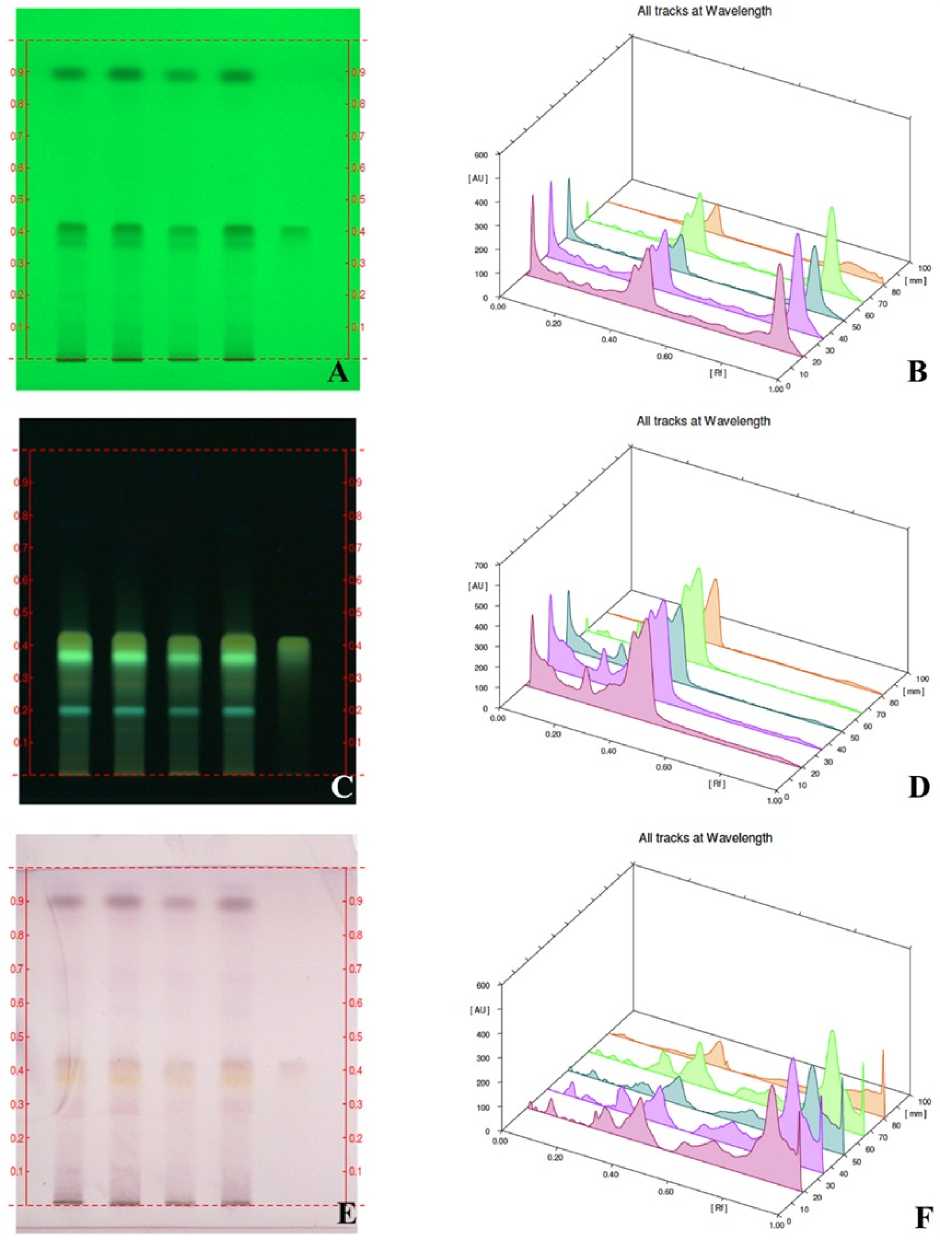
Figure 4. HPTLC Profile of methanolic extracts of Alleppey supreme variety treated with cow urine. A&B: HPTLC chromatogram and densitometric scanning image under 254nm respectively. C&D: HPTLC chromatogram and densitometric scanning image under 366nm respectively. E&F: HPTLC chromatogram and densitometric scanning image under 550nm respectively. Track-1: 5% Track-2: 10% Track-3: 15% Track-4: Control Track-5: Marker.
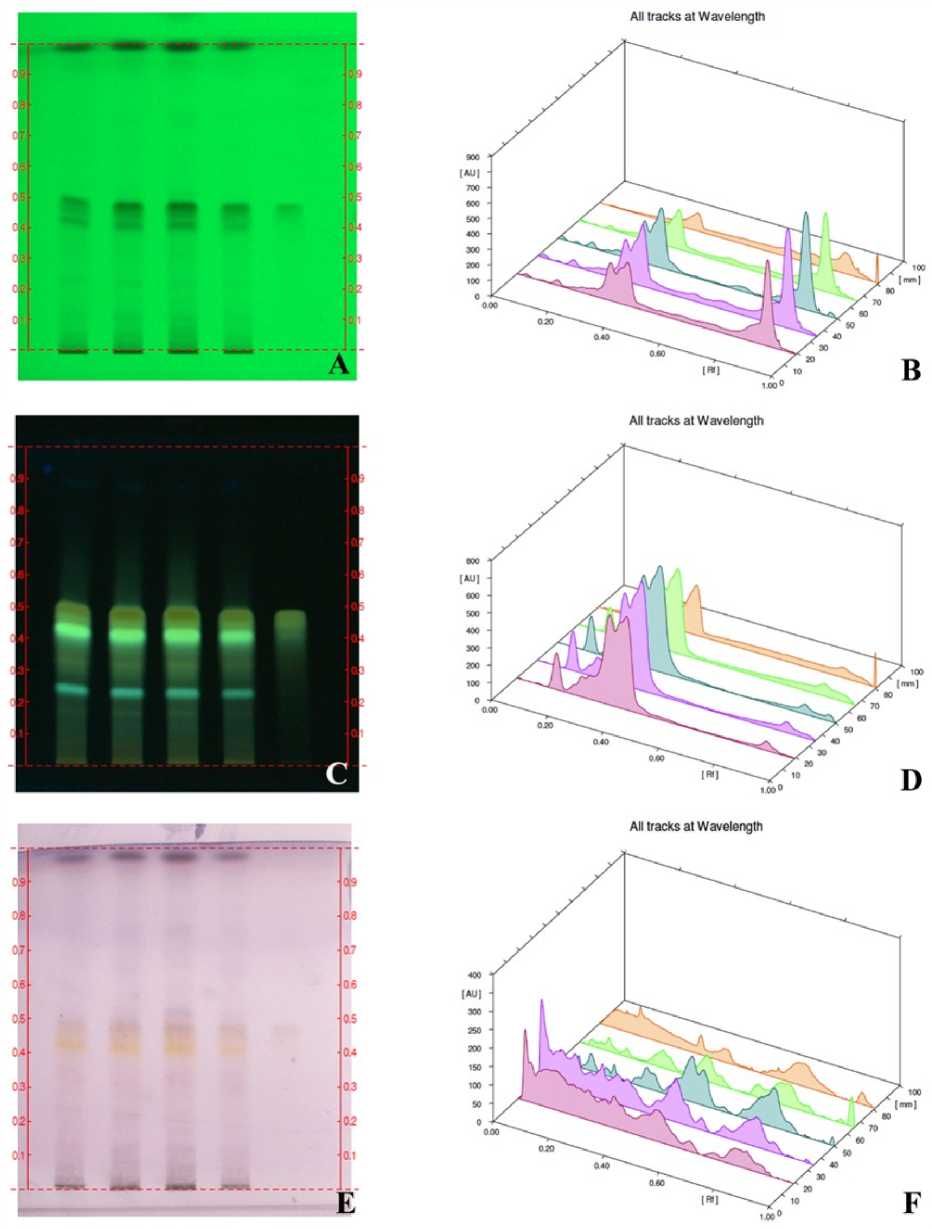
Figure 5. HPTLC Profile of methanolic extracts of Alleppey supreme variety treated with coconut water. A&B: HPTLC chromatogram and densitometric scanning image under 254nm respectively. C&D: HPTLC chromatogram and densitometric scanning image under 366nm respectively. E&F: HPTLC chromatogram and densitometric scanning image under 550nm respectively. Track-1: 5% Track-2: 10% Track-3: 15% Track-4: Control Track-5: Marker.
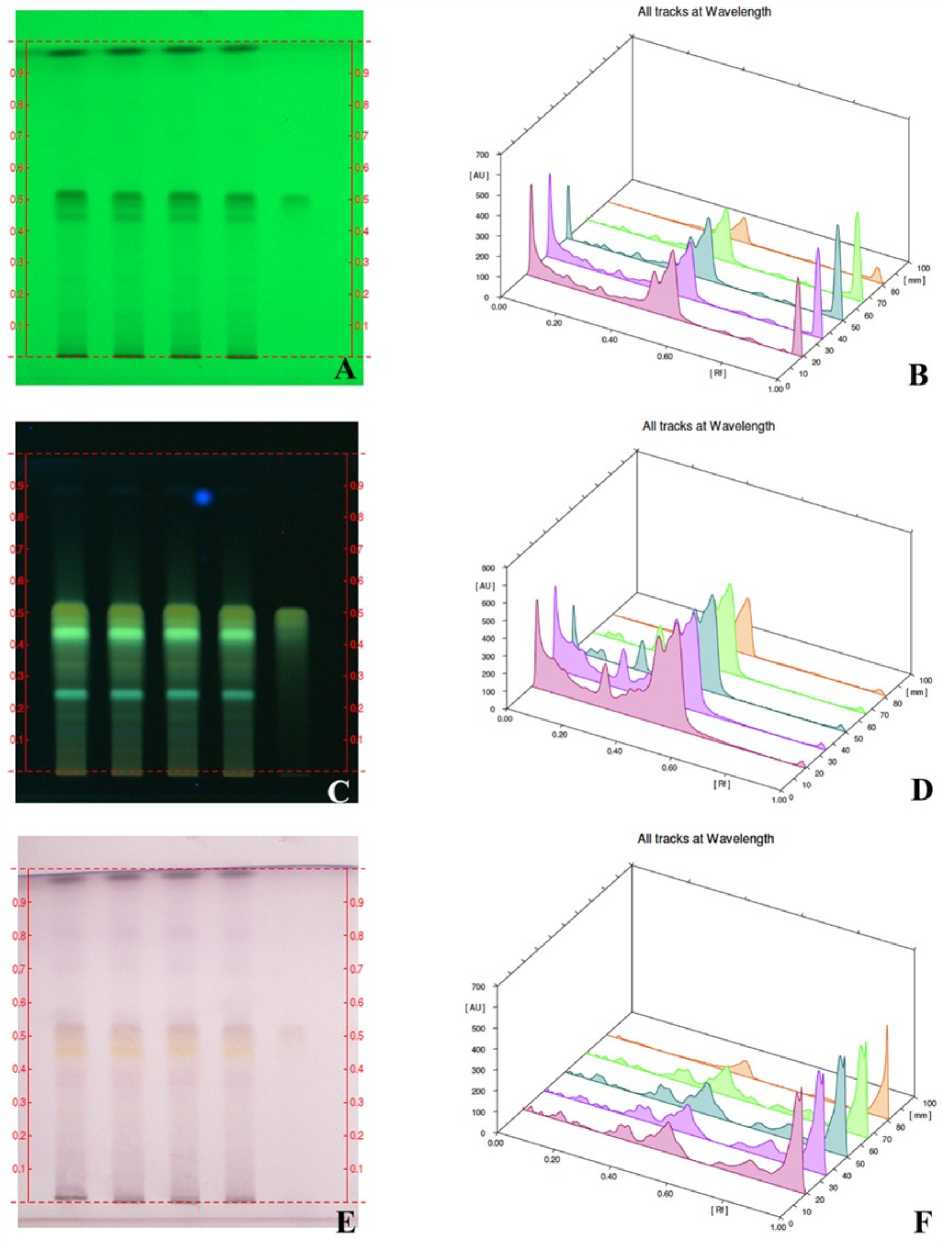
Figure 6. HPTLC Profile of methanolic extracts of Alleppey supreme variety treated with salicylic acid. A&B: HPTLC chromatogram and densitometric scanning image under 254nm respectively. C&D: HPTLC chromatogram and densitometric scanning image under 366nm respectively. E&F: HPTLC chromatogram and densitometric scanning image under 550nm respectively. Track-1: 0.1% Track-2: 0.2% Track-3: 0.3% Track-4: Control Track-5: Marker.
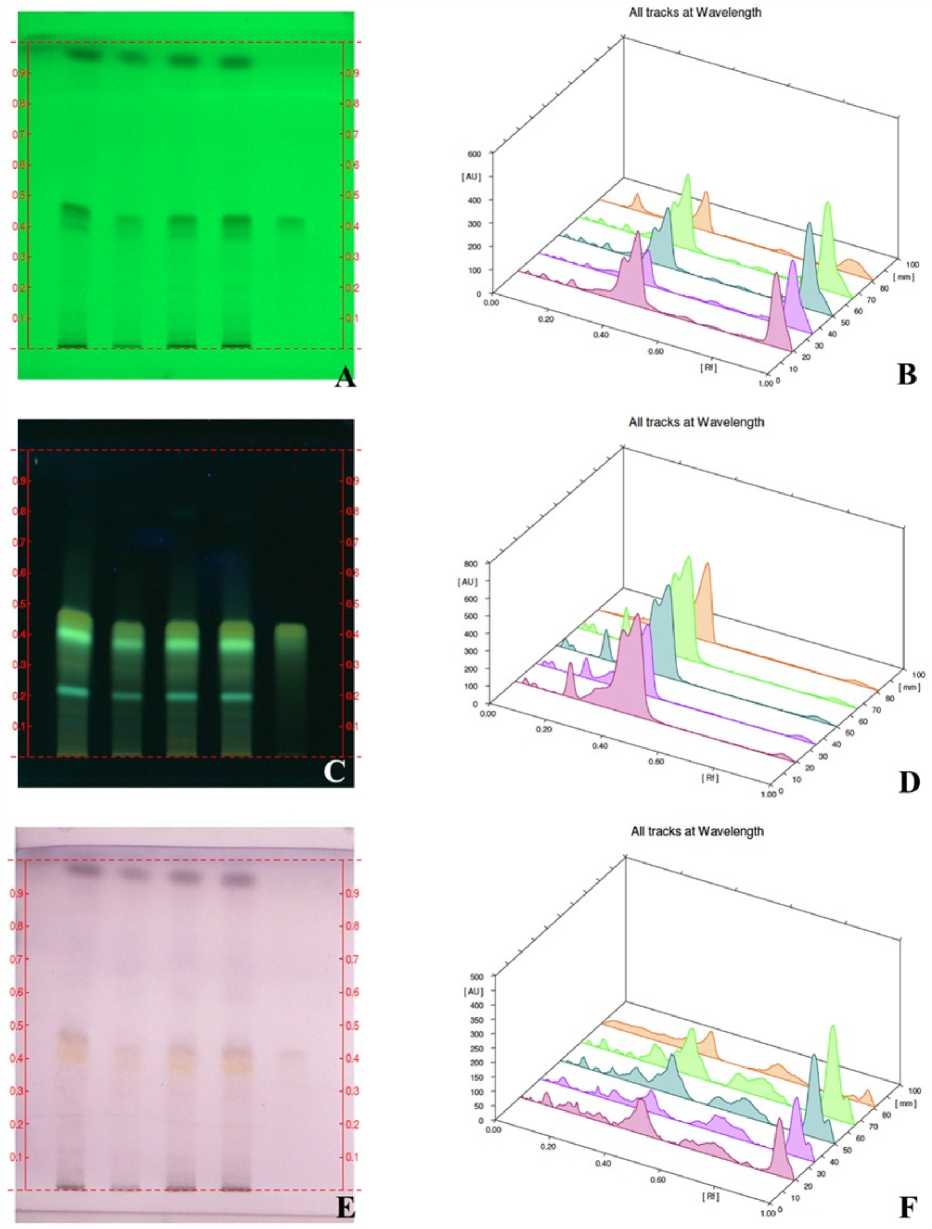
Figure 7. HPTLC Profile of methanolic extracts of Alleppey supreme variety treated with ZnSO 4. A&B: HPTLC chromatogram and densitometric scanning image under 254nm respectively. C&D: HPTLC chromatogram and densitometric scanning image under 366nm respectively. E&F: HPTLC chromatogram and densitometric scanning image under 550nm respectively. Track-1: 0.1% Track-2: 0.2% Track-3: 0.3% Track-4: Control Track-5: Marker.
Table 6 Effect of various treatments on unit percentage of oleoresin and essential oil content in Alleppey Supreme variety
|
Sl No |
Treatments |
Oleoresin (unit % in 100g) |
Essential oil (unit % in 100g) |
|
1 |
Control |
14.01 |
3 |
|
2 |
SSP 50g/kg |
15.39 |
3.4 |
|
3 |
SSP 100g/kg |
16.87 |
2.8 |
|
4 |
SSP 150g/kg |
17.53 |
2.6 |
|
5 |
FC 50g/kg |
14.84 |
3 |
|
6 |
FC 100g/kg |
15.53 |
2.6 |
|
7 |
FC 150g/kg |
16.64 |
3 |
|
8 |
CU 5% |
14.7 |
2.8 |
|
9 |
CU 10% |
16.41 |
2.6 |
|
10 |
CU 15% |
14.66 |
2.6 |
|
11 |
CW 5% |
13.4 |
2.4 |
|
12 |
CW 10% |
16.01 |
2.8 |
|
13 |
CW 15% |
15.29 |
3.4 |
|
14 |
SA 0.1% |
14.64 |
2.8 |
|
15 |
SA 0.2% |
14.66 |
2.6 |
|
16 |
SA 0.3% |
13.55 |
2.6 |
|
17 |
ZnSO 4 0.1% |
14.35 |
3.75 |
|
18 |
ZnSO 4 0.2% |
14.25 |
2.75 |
|
19 |
ZnSO 4 0.3% |
12.52 |
2.75 |
SSP –Sea shellpowder FC-Fishcompost SA- Salicylicacid CU-Cow urine and CW- Coconut water treated plants
0.1% 0.2% and 0.3% ZnSO 4 treated samples control and marker are shown in profile six. From the results it was clear that track 3 representing rhizome extracts of plants treated with 0.3% ZnSO4 enhanced the production of curcuminoids 1 and 2 and track 1 representing 0.1% ZnSO 4 enhanced the production of curcuminoid 3. But the total area of separated compounds at different Rf values was found to be low in ZnSO 4 treated plants compared to control plants (Figure 7).
DISCUSSION
The use of synthetic chemical fertilizers as growth stimulants has exponentially increased throughout the world and is causing various environmental hazards. As a result of the widespread use of these synthetic fertilizers heavy metals and radionuclides have accumulated in the environment. Such substances accumulate in living organisms through the food chain and cause several diseases. The use of harmless natural fertilizers as growth stimulants help to overcome the adverse effects of synthetic chemical fertilizers. The present study evaluated the effect of soil application of sea shell powder and fish compost and the foliar application of coconut water cow urine salicylic acid and zinc sulphate.
MORPHOLOGY
Morphological characteristics like plant height leaf length leaf breadth and the number of tillers were significantly higher in plants treated with different concentrations of cow urine and coconut water. Out of these treatments 10% cow urine and 15% coconut water were found to be more effective. The current study endorses the use of these growth stimulants for enhancing plant growth. It was reported that the vegetative growth and seed yield in mustard plants were also enhanced by the application of cow urine (Pradhan et al. 2018). A field experiment conducted during 201819 in rice to study the growth and yield attributes of rice by the foliar application of cow urine-based derivatives also reported that 10% cow urine has significant positive effects in rice plant regarding plant height no. of tillers and no. of leaves (Sadhukhan et al. 2019). All these reports highlighted the significance of cow urine as a growth stimulant in agriculture. The present study also revealed the efficacy of this low-cost and easily available liquid fertilizer to enhance the vegetative growth of turmeric.
Various substances of organic origin are increasingly being used in their crude form to determine their biostimulating effects on plant growth and development. Coconut water is a rich supplement of natural cytokinin and is one of the wonderful organic substances which stimulates cell division and rapid growth of plants. The foliar application of coconut water along with Moringa leaf extract was reported to increase the nutrient content of capsicum (Sadiq et al. 2020). In the present study coconut water treatment was significantly superior to the rest of the treatments in improving the vegetative growth of Alleppey Supreme variety of turmeric. So the present study strongly supports the use of this cost-effective easily adopted and environment-friendly substance to enhance vegetative growth and secondary metabolite production in turmeric.
0.1% salicylic acid was found to be helpful in increasing the number of leaves per tiller. The influence of 150g/kg seashell powder and 150g/kg fish compost were also significant in this study as these substances enhanced plant growth. The surface application of lime or other calcareous materials is a common practice to ameliorate soil acidity. Seashell powder can be used as an adequate substitute for this. Application of sea shell to acidic soil resulted in the increase of soil pH soil organic matter available phosphorous exchangeable cation concentration and improved soil chemical and biological properties and increased plant productivity (Jović et al. 2019). The use of compost from fish waste as a fertiliser for agriculture is becoming a popular practice among farmers. The effect of fish compost and the degree of phytotoxicity such substances impart needs to be evaluated. It was reported that the addition of fish compost to soil caused an increase in fresh and dry matter of lettuce pants (Radziemska et al 2019) and also had significant effects in tomato (Illera-Vives et al. 2015). The present study in Alleppey Supreme variety of turmeric recommends the use of 150g of fish compost in 1kg of soil as a growth stimulant. The influence of this eco-friendly substance as a fertilizer should be evaluated in diverse range of plants. 0.1% 0.2% and 0.3% of ZnSO4 showed mild positive responses compared to control plants. Further studies are required in this area to assess the role of this substance in plant growth and development.
CHLOROPHYLL CONTENT OF LEAVES
There is only very little information in literature about the effects of applying cow urine to plants via foliar spraying. The chlorophyll content of the leaves of pigeon peas was found significantly enhanced by the foliar application of cow urine (Deotale et al. 2017). The chlorophyll content of methi and bhindi was also increased with foliar spraying of cow urine (Choudhary et al. 2017). In the present study in Alleppey supreme variety of turmeric total chlorophyll content was found highest in plants treated with 10% and 15% cow urine. The increment in chlorophyll content of leaves was noticed in broccoli by the application of coconut water as a foliar spray (Salman and Abdulrasool 2022). The current study also supports the foliar application of 15% of coconut water for enhancing chlorophyll content in Alleppey Supreme variety of turmeric. 150g/kg of seashell powder 100g/kg and 150g/kg fish compost also exhibited positive responses in chlorophyll content compared to control plants. But 0.1 0.2 and 0.3% of ZnSO 4 showed a strong negative impact on leaf chlorophyll content and showed symptoms of leaf yellowing. So the study strongly discourages the foliar feeding of ZnSO 4 in Alleppey supreme variety of turmeric.
RHIZOME YIELD
Fresh weight
The present study identified a positive relation between plant growth and rhizome yield in coconut water and cow urine-treated plants. The foliar application of 15% coconut water and 10% cow urine promotes rhizome yield in terms of primaries secondaries and mother rhizomes in the Alleppey Supreme variety of turmeric. 150g/kg seashell powder 100g/kg and 150g/kg fish compost and 0.1% salicylic acid treated plants showed an increase in rhizome yield compared to control plants. Plant height of turmeric pseudostem is very important morphological character for which selection for yield could be made (Kandiannan et al. 2015). In the present study it was found that tall plants with longer and broader leaves with more tillers could be an ideal type of plant for rhizome production.
Percentage yield of dry weight
The total fresh weight of rhizomes was found high in plants treated with 15% coconut water and 10% cow urine. Average dry weight and percentage of the dry yield of rhizomes were found highest in plants treated with 100g/kg of fish compost.
Oleoresin and essential oil content
The biosynthesis of plant secondary metabolites oleoresin and the essential oil content of turmeric rhizomes were also affected by the treatments of growth stimulants. Unit percentage of major secondary metabolites oleoresin and essential oil extracted from 100g/kg of powdered samples of different treatments indicate that few of such substances act as exogenous elicitors for the bioaccumulation of oleoresin and essential oils. Plants treated with 150g/kg seashell powder for oleoresin and 0.1% ZnSO 4 for essential oils showed the most significant results.
HPTLC analysis
The most accurate simple and improved method for the separation of curcuminoids was achieved by employing HPTLC fingerprinting (Paramasivam et al. 2008). The HPTLC results of the present study clearly indicated that the soil applications of nutritional substances stimulate the production of more curcuminoids compared to foliar applications. The area percentage of curcuminoids in different Rf values of plants treated with 150g/kg seashell powder and 150g/kg fish compost expressed significant results compared to other treatments. Out of the foliar treatments 10% coconut water showed clear positive results in the area percentage of curcuminoids at different Rf values. 0.1% 0.2% and 0.3% of ZnSO 4 showed mild responses in curcuminoid production and showed deteriorated results in vegetative growth and rhizome yield.
CONCLUSIONS
The present study throws light on the impact of growth stimulants such as seashell powder fish compost cow urine coconut water salicylic acid and
ZnSO 4 on the growth yield and production of secondary metabolites in turmeric and the findings would enable the farmers to use such cost-effective measures in cultivation to reduce their expense and make better yield. The foliar applications of 10% cow urine and 15% coconut water were most suitable for increasing vegetative growth and yield of Alleppey Supreme variety of turmeric. Plants treated with 10% cow urine and 15% coconut water showed a positive effect on curcuminoid production. 0.1% Salicylic acid-treated plants showed high vegetative growth and secondary metabolite production. 150g/kg seashell powder and 150g/kg fish compost treated plants expressed minimal positive impact on vegetative growth and yield and maximum positive impact in curcuminoid production. The present study has successfully compared the impacts of selected substances and identified the most suitable and efficient growth stimulants that farmers can afford in their regular cultivation practices.
ACKNOWLEDGEMENTS
The authors acknowledge the St. Joseph’s College (Autonomous) Devagiri Kozhikode Kerala India and University of Calicut Malappuram Kerala India for providing the facilities to conduct the research work. Funding declaration
This research received no specific grant from any funding agency.
Declarations
-
• Data Availability Statement: All data generated or analysed during this study are included in this published article
-
• Ethics and Consent to participate: The plant propagules used in this study were obtained from the Indian Institute of Spices Research (IISR) Kozhikode Kerala India. The plant material was supplied by the institute under standard institutional guidelines. The authors did not collect any plant material from natural habitats or protected areas. All relevant local and national guidelines for plant material use were followed and no specific collection permits or licences were required.
-
• Consent to publish: Not applicable
CONFLICTS OF INTEREST
All authors declare that they have no conflicts of interest.
