Russia’s spatial policy in the 21st century: Problems of effective public administration in the face of growing threats to national security

Author: Ilyin V.A., Kozhevnikov S.A.
Journal: Economic and Social Changes: Facts, Trends, Forecast @volnc-esc-en
Section: Editorial
Article in issue: 2 т.19, 2026.
Free access
In the context of escalating geopolitical confrontation and increasing dynamism of the external environment, ensuring Russia's national security largely depends on the effective use of internal development factors, which include a significant, but currently insufficiently utilized spatial potential. This article, based on official statistics, our own monitoring studies, the results of all-Russian and regional sociological surveys, an analysis of the results of the practical implementation of strategic documents in this area, as well as the opinions of leading experts, presents an assessment of the effectiveness of public management of spatial development in Russia. It is shown that the market reforms of the 1990s, as well as the country's development in the following decades within the framework of the liberal model, led to the locational compression of developed socio-economic space, depopulation and degradation of the potential of small / medium-sized cities, rural areas, a decrease in the quality of life in peripheral territories, which poses a serious risk to national security. The objective facts presented in the work and subjective assessments of residents indicate an urgent need to improve the effectiveness of strategic public management of spatial development. This primarily concerns abandoning the approach of understanding the country's space as a "burden" and the need to increase the accountability of government bodies at all levels for achieving the targets of state strategies and development programs. The paper substantiates key areas for improving federal and regional public policy and demonstrates that their effective implementation requires the "nationalization" of the ruling elites. Their activities should be guided by the pursuit of a sovereign development course amidst intensifying economic, military, and sociocultural confrontation, thereby ensuring the consolidation of power and society in the face of emerging challenges. The author's contribution lies in expanding approaches to assessing the country's spatial development in the context of the growing role of territorial communities in these processes and substantiating strategic priorities for transforming Russia's state spatial policy in the context of intensifying contemporary challenges.
Geopolitical turbulence, spatial development, locational compression of space, liberal model, ruling elites, national security
Short address: https://sciup.org/147253860
IDR: 147253860 | UDC: 354 | DOI: 10.15838/esc.2026.2.104.1
Text of the scientific article Russia’s spatial policy in the 21st century: Problems of effective public administration in the face of growing threats to national security
Moscow: Philosophical Society of the USSR. 240 p.
The current stage of global development is marked by an intensifying crisis of the global capitalist (neocolonial) system, which has escalated into an open confrontation between countries and their blocs along the “West versus Non-West” divide 1 .
The hot phase of this confrontation has included the events in Ukraine 2 , the military clash between the United States, Israel, and Iran (June 2025, February–April 2026), as well as a series of other regional military conflicts (2024–2026: Venezuela, Cuba, and Latin American countries).
“…the events of 2022, when the United States launched a proxy war with Russia on the territory of Ukraine, triggered the the gradual destruction of the modern system of neocolonialism. The resulting confrontation initiated the creation of geopolitical alliances of countries, and delimited the zones of influence of such regional centers of power as the United States, China, Russia, Iran, etc. These processes have disrupted the original neocolonial model and launched the formation of a multipolar world model”3.
It is essential to understand that, despite their regional nature, we are now dealing with global tectonic shifts : this is not merely a geopolitical clash but a global civilizational conflict over the shape of the emerging world order 4 . According to experts, Russia’s current special military operation is only an episode in this broader confrontation (the Arctic could become the next flashpoint of geopolitical tension) 5 .
These tectonic changes in the world order have an objective foundation, linked to the emergence of new global centers of power over the past three decades. In 1992, the G7 countries 6 78 accounted for 45.7% of global GDP (at purchasing power parity),
“The present political turbulence continues to shape the coming decades through a confrontation between Russia and the West at all levels—from geopolitical to spiritual and moral. The current Special Military Operation (SMO) is merely one episode in this large-scale civilizational conflict. This must be understood”7.
“Many analysts now suggest that a Third World War has already begun and that we are in its first stage... This is a war between unipolarity and multipolarity over a new world architecture—over whether sovereign decision-making centers will be located exclusively in the West or distributed among rising civilization-states”8.
while the BRICS nations (even without accounting for its expansion) 9 represented just 16.5%. By 2022, the G7 share had fallen to 30.3%, while the BRICS share had risen to 31.5%. Projections suggest that by 2028 the balance will shift further in BRICS’ favor: this bloc is expected to account for 36.6% of global GDP, against 27.8% for the G7 10 .
According to experts 11 , a new multipolar world is taking shape in the course of this confrontation. Russia, as a historically formed Civilization-State (as it was during the Russian Empire and the USSR), can and must – alongside China and India – aspire to the role of an organizing center for one of these emerging macro-zones , i.e., spatial complexes of production and exchange with a population of no less than 250–300 million people 12 .
“A multipolar world is being created by default, as a matter of fact. We can accelerate this process, or someone may try to slow it down... But its creation is inevitable. It is happening on its own, driven by the growing potential of many countries – not least the rising potential of the People’s Republic of China. India is growing in Asia, Indonesia is growing, and many other states as well; in Latin America, Brazil; Russia is getting back on its feet and gaining strength”13.
To meet this challenge, however, Russia must become a strong and developing economic and socio-cultural center for friendly nations. This task has been strategically significant throughout modern Russia’s history. As early as his first pre-election article, “Russia at the Turn of the Millennium” (1999), President Vladimir Putin stressed the need to pursue a course toward building a strong state capable of ensuring security and defending national interests on the international stage. In his view, this requires the consolidation of state power and all strata of Russian society, the achievement of civic accord and unity, and the formation of an effective national economy.
“Russia needs strong state power and must possess it. For a Russian, a strong state is not an anomaly, not something to be fought against, but rather a source and guarantor of order, an initiator and the main driving force of any change”14.
Delivering on these strategic priorities remains crucial given the specific nature of the current historical moment: a great turning point of an acute, pivotal, and fateful character for our country , which leading experts, in our view, rightly compare to the state of the global community on the eve of the First and Second World Wars. This is a time of intensified ideological confrontation, the erosion of international law, and the formation of opposing blocs of countries asserting their interests by force.
“We proceed from the premise that there are deep parallels between the approaching era and the 1930s–1940s. Observing such parallels, one sometimes cannot help thinking that the world system is somehow doomed to repetitions, becoming bogged down in obsessive ‘eternal returns’”15.
“We are living in wartime – a double wartime... Alongside the hot war, parallel to it and sometimes intertwined with it, another form is unfolding and gaining strength: organizational warfare... It is precisely this sphere that is gradually becoming the main theater of action...”16
For contemporary Russia, the acuteness of this moment has an additional dimension: it is not merely a transition from a unipolar to a multipolar world, with all the attendant consequences, but a struggle for sovereignty, which the country largely lost in 1991 with the dissolution of the USSR – the final act that symbolized the West’s victory in the Cold War and the establishment of a unipolar world order.
“Above all, it must be acknowledged – and I have said this before – that the collapse of the Soviet Union was the greatest geopolitical catastrophe of the century. For the Russian people, it became a genuine drama”17.
To secure a rightful place in the emerging vision of the future, Russia must ensure its internal resilience , since the country simply cannot survive in a “semi-colonial” state. Such resilience is determined not only by military might but also by an effective economy, technological sovereignty, and a high standard and quality of life for its population.
Amid external geopolitical confrontation, Russia’s sustainability as the world’s largest country by territory also depends, to a great extent, on the effective use of other internal development factors, chief among them its immense spatial potential – which, however, remains insufficiently harnessed in the context of national security and the development of a robust domestic market.
In our understanding, and drawing on the views of leading Russian experts, the country’s spatial potential should be interpreted broadly, encompassing not only the degree of economic and settlement development and habitability of the territory but also the population, with its historical experience, traditions, and other civilizational and socio-cultural characteristics19. Thus, A.S. Panarin, one of Russia’s foremost specialists and critics of globalism and consumer society, regarded the country’s spatial potential as a “synthesis of geopolitical position, civilizational identity, and human capital”20. A similar position was held by V.L. Tsymbursky, who noted that Russia’s geopolitical and spatial potential is determined “not only by control over vast territories but also by a unique combination of civilizational identity, historical experience in mastering ‘difficult spaces’, and socio-cultural specificity”. Thus, the population, with its historical experience, traditions, and value-based passionarity, is viewed as a key component of the country’s spatial potential21.
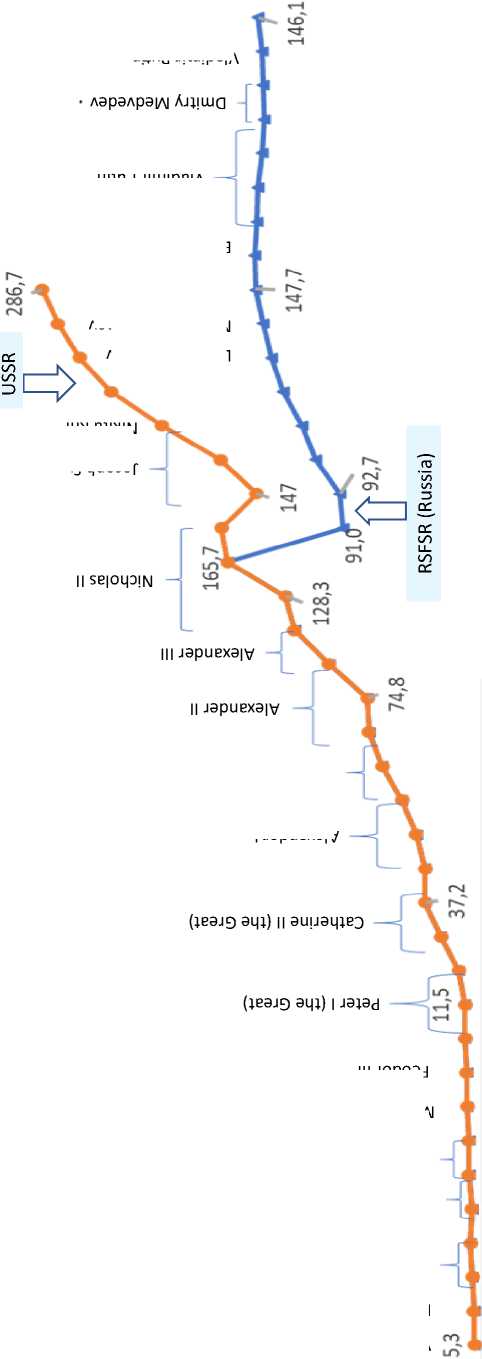
History itself attests to the same pattern: the growth of our country’s might as a CivilizationState (under Peter the Great, Catherine the Great, Alexander II, etc.) has always proceeded in parallel with the expansion of its developed space, population growth, and the formation of stable territorial communities 22 . During its period of rapid growth in 1860–1910, the Russian Empire ranked first in Europe in terms of population growth (the number of inhabitants increased from 74 million to 165.7 million; the urban population grew especially rapidly, Fig. 1 ).
However, this positive vector of development was “broken” by the First World War, the 1917 Revolution, and the subsequent Civil War, as a result of which the country not only suffered millions of human losses but also lost its western borderlands – Finland, Estonia, Latvia, Lithuania, the western part of Belarus, Poland, and Bessarabia – whose population in 1914 had numbered 35.9 million people.
During the Soviet period, the population overall once again grew quite rapidly (the population of the RSFSR increased from 92.7 million in 1926 to 147 million in 1990), but market reforms reversed this vector of development. As a result, in the 1990s mortality in the Russian Federation came to exceed the birth rate by a factor of 1.5, and for the first time since the Great Patriotic War, natural population growth gave way to population decline.
uand JiwipeiA uisjisa suog
I SEioqoiN
III Jopoaj лоившоу ||Eq>|!i/\| saiqnojijo эшц лоипрод suog
(aiqujaiaqj)AI ueai
(jsojg aqj) ш ueai
и png J|WipE|A
AaqoEqjog ||Eq>|!iAl
Aouqzajg piuoaq
A3q3qsnjq>| ejqiN
ui|Ej$ qdasof
I japuExaiy
»zoz *102 гтог 8oo г soo г too с ооо г
Т66Т 0661 S86T 6Z6T 0Z6T 6S6T 6Е6Т 9Z6T ZT6T VT6T Z68T
*68 Т
T8ST
Е98Т 8S8T 9*8 Т SZ8T
6Т8Т 008 Т S6ZT
08ZT SZZT 00ZT
2891 8Z9T S*9l
ЕТ9Т
S09T 66ST
*8ST OSSI DOST OOOT
(uns JiEd aqj) I-11Ш1РЁ1Л

During the planned-economy period, the development of vast spaces was ensured by the comprehensive nature and scale of state programs and projects. However, the collapse of the USSR became a turning point that triggered negative economic and demographic processes across the country.
“The concentration of economic activity in a limited number of urban agglomerations implies a compression of the space of human activity; under such an approach, the territory of the Russian Federation truly becomes a burden rather than a factor of development”23.
“The spatial ‘compression’ of Russia is not a natural process but the result of policies that have ignored the spatial factor as an autonomous category of governance”24.
“Post-Soviet transformations, combined with depopulation trends, have brought the problem of the “shrinking” of developed space to the forefront. The liberal model has offered no instruments for curbing this process”25.
The approach to Russia’s spatial development has changed, becoming “ point-focused ” – oriented toward the growth of a limited number of economic centers that are poorly integrated both with one another and with the country’s spatial periphery, a problem that has not been fully resolved to this day 26 ( Insert 1 ).
At the same time, it should be noted that most of the documents adopted during this period contained no quantitative development targets, which not only makes it difficult to conduct an objective assessment of their implementation but also testifies to a formal approach to strategizing, without assigning responsibility to participants for fulfilling the tasks set. For example, the General Scheme of Settlement on the Territory of the Russian Federation (approved by the Government of the Russian Federation, Protocol 31 dated December 15, 1994) only identified the task of stabilizing the population size in the Far East, without specifying a target value. In practice, however, the population of the Far Eastern Federal District shrank from 8.1 million to 5.9 million people between 1994 and 2024.
In Presidential Decree 803 of June 3, 1996 “On the Basic Provisions of Regional Policy in the Russian Federation” (the document was repealed by Presidential Decree 13 of January 16, 2017), one of the benchmarks was the reduction of the interregional gap in GRP per capita. Yet in reality, this gap between the ten leading and ten lagging regions widened from 4.9 times to 12.3 times between 1995 and 2017.
The ambitious targets for innovative socioeconomic development set forth in the Concept for the Long-Term Socio-Economic Development of the Russian Federation to 2020 (approved by RF Government Resolution 1662-r dated November 17, 2008) proved overall unattainable, owing to the global financial and economic crisis, subsequent sanctions, and the absence of effective mechanisms for practically implementing the declared priorities. Specifically, annual GDP growth was expected to average around 6–7%, so that GDP would have risen by a factor of 2.25 over the period 2008–2020. In reality, however, the economy grew by only 15.1% in comparable terms over this period. This was largely due to weak investment activity: the real increase in fixed capital investment over the period amounted to just 19.5% ( Tab. 1 ).
|
й 8 о d а Он ел ел ■2 'ел СЛ О О S Й О О ад |
Я Р Р Р Я О а -Г О ел ей n .я ад ей й й я ей й Й О $ ёз^'й-3°-тад га 2 й га д д д й S д ^ з § 8 « ° а щ о д д и 2 2 Й я ° я о 1 1 Ш’3И? Hieing ° о й “0 й га щ~ йа2 °£а'£я ° * НИШ й i 1! СЙ О г—! Е " О Л ^'o^&igs^* |
2 2 « § £ 2 й 2 д О га га о а а о о 2 о ПИ Я я Я Я S я 3 2 ° Я га ~ 45 а . 2 0 2 д ° га О а й Л й ® н Й 2 'ад д 8 ° « О 00 2 2 Й ей а 3 3 о а а а а S та 8 Й 2 ^ 0 0 . О Я 2 — Н а § 2 |
я <Я Ь* 0 0 3 0 га и — га СЛ та 2 2 Я Я та О га а й а а 8 й Я 1 ел ^ Й S О 3 з й а 5-1 ^ Й § й о 2 3 .2 з я С П о й 1 Я । s а 3 О О ел 2 я 9 8 ад 0 й d й ° ,« ■" £ 0 а £» D
й 8 2 3 -S 2 8 Ю й м. Й Й та- g 'S Я &
2 -та та га 00 2 & о a g Р На а а оо 8 |
й д о « я ел га Я -ГН ё ^ 8 а ^ 2 о ^ 2 S § 5 га £ 2 д >, 2 а g S ё Я g а та- а ” £ 8 § ^ ^ ^ й ё та 2 -та й g Й я га ° “ та 2 К О га и Д й 8 й та Й о ■ё ^* й а .2 й 8 2 S ^2 Я "га 'та g 2 гам- 15 2 Н й 2 15 га о |
|
СЛ Он & ад 5 Й О и |
« О Я Л ^^28 (D "Й £ 1 0 я 8 8 0 о О 8 1 'а 0 0 0 а £ §22“ а 0 2 а й .8 2 2 8 й й ° ° д о 3 3 ‘ад D И р Ш СЛ 5а Я 5а |
8 §* 8 8 .£ g Й Д й 3 С § & .2 0 я ад d 8 S 2 а а Д ^ а & а 45 -4 й Я Ча с О Р ел г 7 о § а ё 2 ° а та -га a a D 2 ■2 о я £ £ 2 £ а 2 ё ° га 2 га n ■£₽ 7 а 15 £aV I! s ° Я Д Я 00 О га й2 £ 8 с о Й « 0 3 2 ■га га 2 О .-й га Й ■й ё £ £ 8 -я а я 75 2 а о а га ‘й та о Я 2 га £ 8 <2 бз -2 £ а Й |
'о "S о 2 & я 75 £ е а а а га 0 й ^ ° га га га ■тага И g 2 я 2 3 0 2 ° -Я о О 2 5 8 |
£ а а 45 'о Й га й й а £ 2 75 g1 Та й о “8й 0^8 |
|
£ |
1—1 |
1—1 |
40 07 07 1—1 |
I СП ^ о 07 о |
|
й .о 'ел 'о Q й й Q |
^аи^/та^ймет^ 2 а ел д и О о й 2 а ^ | £ ^ * | п^^га^^^^^ g^o°oo<^^S £^О2°§Й2§ а D - га S -та "д "g а Тга'Й-татаОщЯщЙвд •я й чо 0 а а о 0 я -га U 2 45 /га — -та " — ~21j-£-O'Z7Jj — ^ а | -g 0 § й я 2 Щ б а -та D “ Я та a^Z^.eQ^S.S2 |
Я й й 73 _ Я 3 Й 2 3 ^ о о и . й 3 2 Й § - D 8 3 ча ел 2 ° 3 § а 0^00^ 8 я й g я t £ я 2 u О га й 0 $ 8 см £ 2- 2 Q |
о 2 Й 2 й g га 2 2 .2 ’Й 45 ё а с 4= .й а см 8 ^ 2 и ® ,Н 45 д о 2 "га й м a g та -гаЙ О Щ ■а ° 75 я 2 2 ел О а 2 ё ста ста О a Q |
д оо 'о .8 « ^ 'о g3 Я ел Я^нел Он Я ел О О О g ад 2 g ^ ^ 0 8 ^=S£^8Q-ад а и а л л 2 2 2 a C . . -та 45 С -с га — ^ да Й 8 2 2 ё ^ Э й д и g "4 Л- 0 Те 45 -та 2 £ е J Я « 3 2 8 ^ 8 га я< Tj Ю й Й Я ^ ^Ь2о£О?Й0 |
Окончание вкладки 1
|
й о и а Он со со ■2 'со СО О О S СО Й О О ад о Z |
2 й тз о со й й " 8 д 3 8 ” ® Й ад = -У "З 1 8 8 й £ й ® й ■& .2 ■ & g ё 3 '^ 2 $ Й д й о д S Й й ° ° ад а о м а та а ад а 1 о -д й £ д й О ^ g 2 8 ^ ^ £ й S ° а ' £ g § « u и U Д щ Д g Д Д д д а д о я я S О и 8 ^ « ° л Д д д та та Д о м 8 д вд 2 " О ад о о Н о га а га |
ад й ^ ■Д ^ ^ йога 3 8 3 д л .2 й Й Д -Н Р Омой вд £ 2 а щ га -д и -д 8 д о .s-е &вд I s -s р 2 “ й ° со ^ О „ 'Д СО Й о и 8 ё д а вд а Ё .8 2 £ |
Й ' й 3 д д & 2 .2 з 3 ^ Й .й Д i а а ■д а а д о £ £ 2 ^ 8 S д д а й тз о .2 3 Й СО ^ '-нН П О g .2 2 - ё ^ £ .S д g Н до га 2 а га 2 д о £ а и а ‘вд о а Н Й ^н н О н а ■—1 СО ой й о ^ h 1 h а га о д Ой '3 Й .8 вд £ Т о й й д со о О н Й Р и й д 1 а о £ ^ о о ^ о Д Д О й Q ।—। О О О со |
о о ■g .8 S S д 8 S & 8 .2 8 га 2 .Д .2 ада £ ° „ а 8 > 2 й & й ■° -га д & га ■д 2 8 й\2 со О 1 й § ^ да И -б ■ra u Д га га Д 2 8 О р о о Д g a S & д д д я .2 8 8 "и а 8 д о д ° га д ВД о a S .2 2 а1 Д Щ ° < д£ а ^ 8 |
3 О о О а д о о а а О “ о и а Й О вд 5й . « Я а 8 .8 2-2 2 га О о а ■^ -^ о со о со Й и ‘Й "О
Й “ 1 ° goo h ^ |
|
СО Он & ад 5 Д О и |
ад о т 3 3 й £ а 8 2 а а а д д § а й Й ^ а ё 1 § 8 Он - О сл Й СО Й га £ и ? д а 'со Н со Й 3 я & о а д и W s Д |
ч—> .со S а со О 1 -S О а |
Й Й ад й 2^1^ О га а ° "8 - .8 ^ £ £ | .8 ^^ вд 8 2 м 2 g „м о £ ° h 3 ^ □ h т ? 8 8 ° 8 ■2 В g ^ й о ° вд га а Д Й 5-1 О Й со й О О Д О S 3 о 2 N О М О Й О Он |
8 д' § о | 8 О X га я м га 8 га 'та Д Д 8 а га Д о о о -° 8 ° Й ё га а ё 3 8 й й 8 ° 8 S вд а о о Д а а й л й -та S 2 о ё м а 3 а а га- ^а Д И г-1 ■га м м -2 о-о О Н а Й о S 8 « й а ° • м ~ ~ 8 8а 8 а Й й4 О т й - ° 3 3 ^,ЙО |
3 й ° о £ fli мпзО О та Д ■§ .2 § 8 8 га О 8 а ^ о о >> , й Й ° о й ‘со з со X -ни Й О д § * 2 ■2 2 s & 8 га а а 3 о д 3 О со -й Т5 |
|
й £ |
ОО о гч |
гч о гч |
О 04 |
04 О 04 |
|
|
й 'со Q й й Q |
I Й ь Т5 ■2 3 й »1®: Sua,-!) ё 8 н о £ ад ° а д га а д о д о Д й а „ 8 о £ 2 а сч о оо а о о и о g 8 £ ^ ^ Q ^ ^ ^ & Q Й О Я 8 | .2 8 £ § о д 8 8 с8 ё д д u с а 8 8 ю w а 0 Z |
7 ^ ^ ^ Й (N Й О О 3 ° 2 ^ й ^ о й 2 Ий о о ^ тЗ О ■'—1 ’—1 “ О о д £ о ® г та 3 о и - ■ У ш -а со Й й со , N со ’ д й 2 й о й й ^ ^ га 8 £? s | о ” £ ^ 1и £ « J д ь а а ” я Р Д [н 8 g а ^Г22г| |
а ВД а Д -8 га Д .3 я > ° s a 2 'й д £ а £ £ о - < оо х Й S ^ & 8 Р ^ 'о а о ~ о ° Р 8 £ гаЙ «^ .3 S га § х 8 д <2 а -4 .3 8 д м д 8 2 д а 2 Д о S а з? £ о £ |
а д 8^0 5 га g О Д 8 8 Й s— —■ ё S | ад х Ч Ч й та а ° "2 ОО О <> 04 |
го о Д а1 д 2 ° ° С ё о Р 0 2=^ .5 8 2 он i ^ 2 Й ^ ь g а о rh о ё -й S а <2 3 ;» а >» Й 5 “ “ 8 а S а 2 ^ ^ ^ а ^ <£ 'о га ^ |
Table 1. Target and actual values of Russia’s socio-economic development in 2008–2020, according to Concept-2020
|
Indicator |
Base period (2007) |
Planned value by period (2008–2020) and cumulative totals |
Actual value (2008–2020) |
|
1. Population, million people |
142.1 |
2008–2010: 141.8; 2011–2015: 142.2; 2016–2020: 143.4 |
147.4 (2020) |
|
2. Average annual GDP growth rate, % |
8.1 |
2008–2010: 6.8%; 2011–2015: 6.4%; 2016–2020: 6.3%. Planned total growth over period: 2.25 times |
Increase of 15.1% over the entire period |
|
3. Average annual growth rate of real disposable household income, % |
10.1 |
2008–2010: 10%; 2011–2015: 7%; 2016– 2020: 6.7%. Planned total growth over period: 2.29 times |
Increase of 12% over the entire period |
|
4. Average annual growth rate of investment, % |
21.1 |
2008–2010: 14–14.8%; 2011–2015: 10.3%; 2016–2020: 10%. Planned total growth over period: 3.9 times |
Increase of 19.5% over the entire period |
|
5. Average annual growth rate of retail trade turnover, % |
16.1 |
2008–2010: 12.8%; 2011–2015: 7.5%; 2016–2020: 6.4%. Planned total growth over period: 2.8 times |
Increase of 22.9% over the entire period |
|
Source: own calculations based on Rosstat data. |
|||
Moreover, the Concept-2020 was repeatedly and justifiably criticized by leading experts (S.Yu. Glazyev, M.G. Delyagin, and others) for its weak elaboration: the document was developed during the economic upswing of 2006–2008 and did not account for the possibility of systemic crises, which made it unrealizable from the very start; its forecasts were based on econometric extrapolation of existing trends rather than on modeling a qualitative transition to an innovative trajectory; the opportunities for breakthrough growth through the assimilation of new technologies were underestimated; and there was a fundamental mismatch between the document’s declared goals and actual budgetary policy.
A new stage in state spatial development policy began in 2019 with the adoption of the Strategy for the Spatial Development of the Russian Federation to 2025 (approved by RF Government Resolution 207-r of February 13, 2019). While the initial versions of the document focused on supporting the development of only 42 largest (population over 1 million) and large (over 0.5 million) urban agglomerations, later revisions added 23 urban agglomerations with populations below 500,000 (the “second tier”).
“The loudly and widely advertised ... ‘new growth policy’, in its macroeconomic part, is identical to the restoration of the bankrupt methods of the 1990s, guaranteeing a slowdown in economic growth, stagnation of investment and innovation activity, and the continuation of trends of national economic degradation”27.
“What was the pitiful Strategy-2020 worth, whose authors could not even work out the mechanisms for achieving arbitrarily assembled, uncoordinated, and unsubstantiated goals! Its developers saved themselves from criticism by expanding the document to nearly a thousand pages, rendering it unreadable. The developed ... Strategy-2020 became a symbol of the liberals’ intellectual bankruptcy”28.
For the country’s lagging regions, individual development programs (IDPs) were drawn up and implemented. Thus, a certain mechanism was created to counteract the negative processes of forced resource concentration in cities of over one million. However, these IDPs demonstrated insufficient effectiveness. In particular, a total of 49.4 billion rubles from the federal budget and 1.7 billion rubles from regional budgets were allocated to their implementation over 2020–2024. Yet, according to the Accounts Chamber of the Russian Federation, 36.4% of total federal budget expenditures did not lead to the planned results, and the planned targets for 37 out of 120 IDP measures (30.8%) were not achieved 29 .
At the same time, despite certain difficulties, the target values for two of the three indicators under the inertial scenario of the Strategy for the Spatial Development of Russia to 2025 were, on the whole, achieved ( Tab. 2 ).
According to experts, one of the key reasons for the low effectiveness of strategic documents at the federal, macroregional, and regional levels is the weak practical implementation of the fundamental provisions of the federal law on strategic planning30. Among the main problems are the poor alignment of the documents being developed in terms of goals, objectives, and indicators; a low level of involvement of economic actors in strategic planning, which therefore remains formal in nature, with no real accountability for achieving the stated goals.
“Today, despite having more than 60,000 adopted strategic planning documents, they do not exert a noticeable influence on economic development because they contain no accountability measures for their fulfillment...”31
“...the law has not been fully transposed into the practice of public administration to this day. It has not been possible to create a unified, effectively functioning strategic planning system or to implement the planning principles enshrined in the law, which significantly limits the state’s ability to set and achieve national development goals”32.
Table 2. Indicators of the implementation of the Strategy for the Spatial Development of the Russian Federation to 2025
Target indicator Scenario for 2025 Actual (2023) inertial target Average annual GRP growth rates in the subjects of the Russian Federation where promising large centers of economic growth are located, % in 2017–2025 102.6 103.7 102.8 Ratio of per capita GRP of the subjects of the Russian Federation classified as priority geostrategic territories (excluding the Arctic Zone) to the national average, % 66 70 67 Transport mobility of the population by all transport modes, thousand passenger-km per person per year 9.4 9.7 8.0 Compiled from: Concept of the Strategy for the Spatial Development of the Russian Federation to 2030 with a Forecast to 2036. Available at:
All of this prevents the successful alignment of the interests of regions and private business for the effective implementation of macroregional development strategies.
“Strategic documents are fine. They provide some idea of the directions of development... But there is an immense distance between an idea and practical implementation. The previous strategy was simply a conglomerate of local visions and proposals from the regions. A comprehensive Siberian-wide focus was barely discernible in it”33.
In particular, Academician V.V. Kryukov, describing the problems with the practical implementation of the Strategy for the SocioEconomic Development of Siberia to 2020, notes that the document was effectively a “conglomerate” of local visions and proposals from the regions, poorly linked to solving the strategic tasks of developing Siberia as a vast socio-economic space of critical national-economic and geostrategic importance in the context of ensuring the country’s national security.
At the same time, it should be noted that with the approval of the new Strategy for the Spatial Development of the Russian Federation to 2030, with a forecast to 2036 (approved by RF Government Resolution 4146-r of December 28, 2024), new institutions and mechanisms of state regulation of spatial development have appeared in the areas of productive force location, settlement, and improving the infrastructural connectivity of territories. Considering both internal and external challenges, this is certainly a positive step.
One of the key mechanisms for implementing spatial policy until 2036 is the Unified List of Key Settlements, more than half of which are small towns, urban-type settlements, and villages. In our view, if the development programs for these key settlements are effectively implemented in practice, objective prerequisites can be created for overcoming negative trends in the country’s spatial development.
It must be acknowledged, however, that despite all the measures taken at the federal level (some of which, in our view, are indeed appropriate), the practical implementation of reforms has so far been unable to reverse the negative trends of depopulation and the forced peripheralization of Russia’s developed socio-economic space at all levels (federal, regional, and municipal).
Thus, in the post-Soviet period, the population has grown only in the regions of the Central Federal District (from 37.9 to 40.2 million people, an increase of 6.1%, Tab. 3 ), the Southern Federal District (to a significant extent due to the incorporation of Crimea and Sevastopol: from 13.3 to 16.6 million people, an increase of 25.5%), and the North Caucasus Federal District (from 7.3 to 10.2 million people, an increase of 40.4%, owing to traditionally high birth rates). In contrast, since 1989, the Far East has lost 25.5% of its population (a decline from 8.0 to 5.9 million people), Siberia— nearly 12% (from 21.1 to 18.6 million people), and the Volga Federal District—10% (from 31.8 to 28.6 million).
Table 3. Population size in the Russian Federation by federal district, 1989–2023, million people
Territory / Year 1989 2002 2012 2014 2023 2012 to 1989, % 2014 to 1989, % 2023 to 1989, % Russian Federation (1989 – RSFSR) 147.0 145.3 143.4 146.5** 146.3*** 97.5 99.7 99.5 Central FD 37.9 38.0 38.8 39.3 40.2 102.2 103.5 106.1 Northwestern FD 15.2 14.0 13.7 13.8 13.9 89.9 90.7 90.9 Southern FD 13.3 13.9 13.9 16.3** 16.6*** 104.9 123.2 125.5 North Caucasus FD 7.3 8.9 9.5 9.7 10.2 131.0 132.9 140.4 Volga FD 31.8 31.2 29.8 29.7 28.6 93.7 93.5 90.0 Ural FD 12.5 12.4 12.2 12.3 12.3 97.1 97.8 97.9 Siberian FD (within 1989 boundaries)* 21.1 20.1 19.3 19.3 18.6 91.5 91.6 88.1 Far Eastern FD (within 1989 boundaries)* 8.0 6.7 6.3 6.2 5.9 78.7 78.2 74.5 * Until 2018, the Republic of Buryatia and the Trans-Baikal Territory were part of the Siberian FD; since 2018 they have been part of the Far Eastern FD. ** Including the Republic of Crimea and the City of Sevastopol. *** Excluding the Lugansk and Donetsk people’s republics and the Kherson and Zaporozhye regions. For reference: before the start of the special military operation, an estimated 6.16 million people lived in these territories. Source: What is known about the regions joining Russia. Available at: Compiled from: Rosstat data.
Moreover, these negative trends have affected a significant share of cities (primarily small and medium-sized ones) in the majority of the country’s federal districts. At present, 75.6% of cities in the Far Eastern Federal District, 64% in the Siberian Federal District, and 62.8% in the Northwestern Federal District are classified as significantly depopulating (i.e., with population declines of over 15% between 1989 and 2024) 34 .
As a result, these negative processes have led to the further destruction of the supporting settlement framework and the “denudation” of vast spaces, which represents a threat to national security. This is especially vividly illustrated by data from the Northwestern Federal District. Between 1989 and 2023, practically 90% of the macroregion’s municipalities (168 out of 188 entities) recorded a negative population trend. Moreover, in almost half of these depopulating territories, the decline over this period ranged from 25 to 50% (Insert 2).
In turn, population growth was observed in only 10.6% of municipal formations, primarily municipalities of the Leningrad Region located close to Saint Petersburg – a manifestation of agglomeration processes – as well as a number of territories in the Kaliningrad Region.
Insert 2
|
ел д .о "й ,р "Й д а о Й § х д CS д .о ’ад Й |
Z—X д ’ад й в ел X * ^ а & ^ д °° ^ ■ н X CS Д ^ .2 о Pi X 43 ^ £ ^ S' д о д Ч И й ч х ? д |
й? ■д д й ^ 1 ° 00 нч О ^ Qi ^ 40 X Д о Д S н .2 2 < | д °Rg 0^0 3 3 < х Й X хХ д - ° X д .2 х 3 S Ci ад д 3 X О О > Ри И X ^ ей .2 3 ^ оо й .2 * £ 00 О z—х 3 3 мп х 2 й ад S О ^й |
ей ел о О О 2 -О ел *х '3 с4 о оо * * 2 § й £ ;а х 3 ^ ^ ^ х о ад 2 ^ х 00 Pi ад X а ^ й ~ 00 J 3 з Хох <0X0 ^z х з о |
*J +-о +- О д 3 х ел д 3 .& о 3 ОО ОО i—< О Й О ОО 40 1—< д О д й X |
X д ’ад Pi В 3 д ’ад Pi cS X ад 5 д ’ад Pi X 3 д о .2 д ад о Pi X Pi 2 х 3 ° ей О 3 X |
1—X д ’ад Pi X cS • ^ 3 S д ’ад о Pi X cS 3 Й 3 |
1—X д ’ад Pi X cS 3 Й 3 |
1—X д ’ад Pi X cS 3 X |
1—X д ’ад Pi X cS • ^ 3 X S д ’ад о Pi X cS 3 Й 3 |
"ей -Ч> О ч ч О ^ 40 о ^х д 3 Й .& о а ОО ОО ^х о о еч Д Д & & О Д •^Н |
04 т О О ч Й о оо о х-> o' а S -^ а-» о< X ^ . о m X гм еч О 3 ^ 04 ОО _ 04 О 1-Х •^ X .2 эд ей 5—1 3? ^ X о д ^ 2 й £ .2 о & 2 ел .2 о io "ей ^ .& X •а | 1^з ^н ел ’ТО ° эд .2 3 й X -Т—< ей ел ад Д d 2 й 8 X ел ° О Д Н d ° * X &0 |
|
ел й р д д эд о 3 3 3 Я О й n -^ £ § д ° X ^ |
? СП W ел 3 д |
о о ей Й |
04 мп i—н ел Й О СП |
мп S ел ч •а д еч 1—X |
^ 40 1—X СЛ X 3 д сп |
^ из о^ ч Й 1—X |
^ из О' ч Й 1—X |
^ 40 1—X СЛ X 3 д сп |
|||
|
o' X n У Mi о Д оо & О £ ^ |
04 04 т о о гм |
04 7 о о мп |
04 04 04 о |
04 1—X О О о 1—X |
04 04 1—X О МП гм 1—X |
04 О О МП 1—X |
04 ел 04 1—X О МП 1—X |
О а X CS 3 1 |
Alongside depopulation, another key problem of Russia’s spatial development is the persistent – and in some socio-economic indicators, even increasing – interregional differentiation . Thus, in the post-Soviet period, the ratio of per capita gross regional product (GRP) of the top 10 subjects to that of the bottom 10 subjects rose from 4.9 to 12.8 times (with a particularly substantial increase in differentiation occurring in 2000–2010); in terms of per capita fixed capital investment, interregional disparities grew from 6.7 to 17.9 times ( Tab. 4 ).
The situation with social indicators is somewhat better as a result of the state’s “redistributive” policy. Thus, the differentiation between the top 10 and bottom 10 regions in terms of per capita household income declined from 5.0 to 3.4 times. Since 2000, there has been a reduction in regional differentiation in per capita consolidated budget revenues (from 13.1 to 5.9 times).
At the same time, differences between the leader region and the laggard region in terms of per capita GRP are substantially greater: in 2024, the gap was 69.6 times (Nenets Autonomous Area / Republic of Ingushetia).
For reference:
Differences between maximum and minimum values of per capita GRP:
-
• India – 10 times (28 states, 8 union territories),
-
• Brazil – 5.7 times (26 states, 1 federal district),
-
• China – 4.5 times (34 provincial-level units),
-
• United States – 2.2 and 5.3 times (excluding and including the District of Columbia; 50 states)35.
Table 4. Differentiation of RF constituent entities by key socio-economic indicators
1. GRP per capita, thousand rubles
|
1995* |
2000 |
2010 |
2021 |
2024 |
|
|
National average |
9566.3** |
39.5 |
263.8 |
830.8 |
1276.5 |
|
Average among top 10 regions (Group 1) |
16980.7 |
81.2 |
1026.7 |
3442.5 |
5397.7 |
|
Average among bottom 10 regions (Group 2) |
3437.8 |
12.2 |
88.1 |
254.9 |
419.1 |
|
Group 1 / Group 2, times |
4.9 |
6.6 |
11.7 |
13.5 |
12.8 |
|
2. Fixed capital investment per capita, thousand rubles |
|||||
|
1990 |
2000 |
2010 |
2021 |
2024 |
|
|
National average |
1.7 |
7.9 |
64.1 |
157.3 |
273.2 |
|
Average among top 10 regions (Group 1) |
6.46 |
44.5 |
311.1 |
788.3 |
1376.1 |
|
Average among bottom 10 regions (Group 2) |
0.96 |
1.7 |
22.7 |
51.0 |
80.1 |
|
Group 1 / Group 2, times |
6.7 |
26.3 |
13.7 |
15.4 |
17.9 |
|
3. Per capita household income, thousand rubles per month |
|||||
|
1995* |
2000 |
2010 |
2021 |
2024 |
|
|
National average |
0.5 |
2.3 |
19.0 |
40.3 |
64.0 |
|
Average among top 10 regions (Group 1) |
1.0 |
4.8 |
34.5 |
74.6 |
121.6 |
|
Average among bottom 10 regions (Group 2) |
0.2 |
1.0 |
10.5 |
22.4 |
35.6 |
|
Group 1 / Group 2, times |
5.0 |
4.8 |
3.3 |
3.3 |
3.4 |
|
4. Consolidated budget revenues per capita, thousand rubles |
|||||
|
1992* |
2000 |
2010 |
2021 |
2024 |
|
|
National average |
16.8 |
7.3 |
45.8 |
120.3 |
168.5 |
|
Average among top 10 regions (Group 1) |
42.7 |
31.8 |
151.0 |
449.4 |
497.1 |
|
Average among bottom 10 regions (Group 2) |
8.8 |
2.4 |
26.0 |
68.5 |
84.2 |
|
Group 1 / Group 2, times |
4.8 |
13.1 |
5.8 |
6.6 |
5.9 |
* For the calculation, the period was chosen for which open and complete statistical data are available for all the country’s regions
** Value indicators are presented in current prices.
Source: own calculations.
All of this is a consequence of the policy of market-based organization of space pursued over recent decades, which has focused on supporting a limited number of “locomotive regions” and the largest agglomerations, thereby compressing Russia’s developed socio-economic space. Against this backdrop, the country’s vast territory has often come to be seen as a “burden” on economic growth and sustainable development.
The scale of differentiation is especially acute at the intraregional level. In particular, peripheralization here manifests itself not only in depopulation but also in the erosion of the socioeconomic base of territories remote from large cities, leading to increasing heterogeneity of a region’s socio-economic space. Thus, whereas 68% of the population of the Vologda Region lived in urban agglomerations in 2000, by 2024 this share had risen to 74%. Similar processes of concentration are characteristic of agricultural production (an increase from 55.6 to 58.5%) and fixed capital investment (from 77.6 to 88.4%, Tab. 5).
Against this background, socio-economic activity on the periphery is fading, differentiation along the “urban–rural” divide is growing, and the standard and quality of life of the population is declining. For example, the gap between urban and rural areas in terms of life expectancy at birth widened from 1.5 to 1.8 years between 2000 and 2024; in terms of per capita household disposable resources, it increased from 9.5 to 13.4 thousand rubles per household member.
Table 5. Share of urban agglomerations and other territories in key indicators of socio-economic development of the Vologda Region, 2000 and 2024, %
|
Indicator |
Territory |
2000 |
2024 |
2024 to 2000, p.p. |
|
1. Permanent resident population |
Urban agglomerations, including |
67.5** |
74.2 |
+6.7 |
|
Vologda agglomeration* |
35.6 |
39.9 |
+4.3 |
|
|
Cherepovets agglomeration* |
31.9 |
34.3 |
+2.4 |
|
|
Other municipalities of the region |
32.5 |
25.8 |
-6.7 |
|
|
2. Industrial output |
Urban agglomerations, including |
94.6 |
94.7 |
+0.1 |
|
Vologda agglomeration* |
10.5 |
17.8 |
+7.3 |
|
|
Cherepovets agglomeration* |
84.1 |
76.9 |
-7.2 |
|
|
Other municipalities of the region |
5.4 |
5.3 |
-0.1 |
|
|
3. Agricultural output |
Urban agglomerations, including |
55.6 |
58.5 |
+12.9 |
|
Vologda agglomeration* |
33.9 |
48.9 |
+15 |
|
|
Cherepovets agglomeration* |
21.7 |
19.6 |
-2.1 |
|
|
Other municipalities of the region |
44.4 |
31.5 |
-12.9 |
|
|
4. Fixed capital investment |
Urban agglomerations, including |
77.6 |
88.4 |
+10.8 |
|
Vologda agglomeration* |
26.9 |
29.5 |
+2.6 |
|
|
Cherepovets agglomeration* |
50.7 |
58.9 |
+8.2 |
|
|
Other municipalities of the region |
22.4 |
11.6 |
-10.8 |
|
|
5. Housing completions |
Urban agglomerations, including |
72.7 |
80.6 |
+7.9 |
|
Vologda agglomeration* |
45.9 |
50.9 |
+5.0 |
|
|
Cherepovets agglomeration* |
26.8 |
29.7 |
+2.9 |
|
|
Other municipalities of the region |
27.3 |
19.4 |
-7.9 |
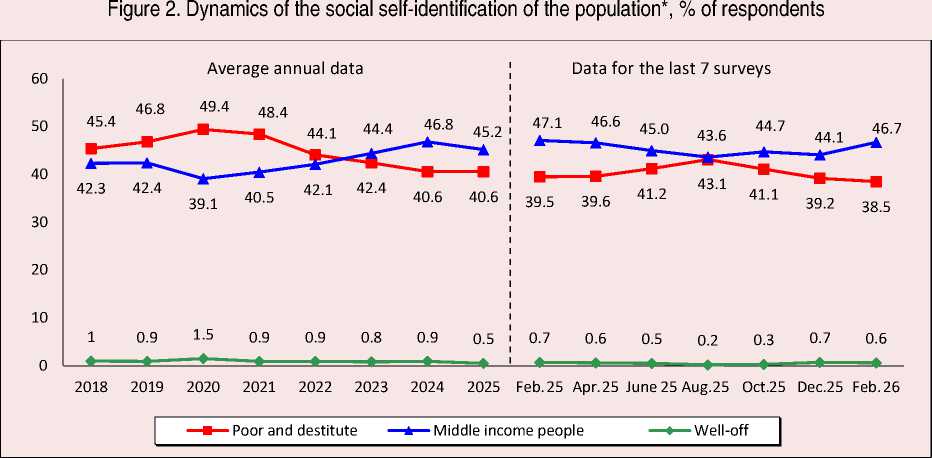
At the same time, after four years of the special military operation, Russian society has accumulated a certain “fatigue from geopolitics and a colossal demand for the normalization of everyday life” 36 . The importance of addressing key social and economic problems is being raised once again with renewed urgency. As noted in studies by VCIOM and VolRC RAS, the public is once again beginning to be troubled by the everyday concerns of the “lifeworld” 37 : living standards, work, place of residence, family, and prices in shops.
In particular, despite some decline in negative assessments since 2018, around 41% of Vologda Region residents still identify themselves as “poor” or “destitute” which makes it more urgent to enhance the effectiveness of public administration in terms of improving the well-being of all sociodemographic groups in the country and the region ( Fig. 2 ).
Another key problem for the majority of residents is uncertainty about tomorrow: in 2025, 54.1% of respondents held this view, which is 4.1 percentage points higher than in 2018 ( Tab. 6 ). This problem is most acute for vulnerable population groups: the least materially secure categories (57.2%), residents of rural areas (55.7%), and people with secondary education (57.3%). All of this reflects a deep-seated uncertainty, a deficit of trust in institutions, and a lack of long-term predictability, which is not compensated for by socio-economic improvements in the place of residence (for 9 out of 10 indicators, an increase in positive assessments has been observed since 2018).
Despite some improvement in the situation, the most acute problems for residents remain the housing problem (in 2025, 23.2% of respondents indicated this, 9.4 p.p. lower than in 2018) and the lack of funds for paid medical treatment (21.3%,
* Distribution of answers to the question: “Which category do you belong to, in your opinion?” Source: VolRC RAS public opinion monitoring data.
Table 6. Which of the following problems have you personally encountered in the past year?, % of respondents
|
Response option |
Year |
Change (+/-), 2025 vs |
||||||||
|
2018 |
2019 |
2020 |
2021 |
2022 |
2023 |
2024 |
2025* |
|||
|
2018 |
2022 |
|||||||||
|
Lack of confidence in tomorrow |
50.0 |
45.9 |
56.7 |
53.9 |
55.8 |
53.8 |
51.1 |
54.1 |
+4.1 |
-2 |
|
Inability to improve housing conditions due to high cost of housing |
32.6 |
31.1 |
29.0 |
27.6 |
25.9 |
23.9 |
22.4 |
23.2 |
-9.4 |
-3 |
|
Lack of funds for paid medical treatment |
29.1 |
32.5 |
32.7 |
29.7 |
27.5 |
25.3 |
22.5 |
21.3 |
-7.8 |
-6 |
|
Reduction in leisure time due to the need to work extra hours |
23.5 |
24.5 |
21.5 |
18.9 |
17.5 |
16.9 |
16.1 |
16.9 |
-6.6 |
-1 |
|
Inability to purchase a package tour due to high cost |
21.2 |
25.6 |
19.1 |
17.0 |
16.9 |
14.3 |
13.3 |
15.9 |
-5.3 |
-1 |
|
Need to seek additional work due to low income |
24.7 |
23.9 |
22.4 |
19.3 |
17.7 |
15.7 |
15.1 |
13.9 |
-10.8 |
-4 |
*Ranked according to 2025 data.
Source: VolRC RAS public opinion monitoring data.
a decline of 7.8 p.p.), the combined assessment of which shapes the population’s holistic perception of living conditions and migration attitudes.
The quality of life in a territory depends to a large extent on the effectiveness of the state policy being pursued and on the successful on-the-ground implementation of strategic projects at the federal and regional levels.
At the same time, the findings of a study conducted by the Vologda Research Center of the Russian Academy of Sciences in May–June 202538 on the provision of infrastructure facilities to the region’s residents and the quality of services delivered indicate that national projects in the spheres of healthcare, education, demography, and roads receive the lowest assessments across all territories of the region (the cities of Vologda and Cherepovets and the municipal okrugs) – i.e., precisely in those areas where residents see the most acute problems that are reducing their quality of life39 (Tab. 7).
In July 2020, a Presidential Decree by Vladimir Putin set out Russia’s national development goals through to 2030, envisaging the creation of conditions for the all-round development of the individual. To achieve these goals, 14 national projects were developed and implemented between 2020 and 2024, aimed at developing the country’s human capital, ensuring economic growth, and creating a comfortable living environment.
Table 7. How do you assess the results of the implementation of the following national projects in 2020–2024? (mean score on a five-point scale: 1 – lowest, 5 – highest)
|
National project |
Vologda |
Cherepovets |
Municipal okrugs* |
Region overall |
|
Digital Economy of the Russian Federation |
3.3 |
3.5 |
4.1 |
3.7 |
|
International Cooperation and Exports |
3.3 |
4.0 |
4.1 |
3.9 |
|
Comprehensive Plan for Modernizing and Expanding Trunk Infrastructure |
3.3 |
4.0 |
4.1 |
3.9 |
|
Labor Productivity |
3.2 |
3.7 |
4.0 |
3.7 |
|
Science and Universities |
3.2 |
3.7 |
4.0 |
3.7 |
|
Small and Medium-Sized Enterprises and Support for Individual Entrepreneurial Initiative |
3.3 |
3.3 |
4.0 |
3.6 |
|
Culture |
3.1 |
3.5 |
3.7 |
3.5 |
|
Ecology |
3.1 |
3.0 |
3.7 |
3.3 |
|
Tourism and the Hospitality Industry |
3.1 |
3.5 |
3.7 |
3.5 |
|
Safe and High-Quality Roads |
3.0 |
3.1 |
3.6 |
3.3 |
|
Demography |
3.1 |
3.2 |
3.5 |
3.3 |
|
Education |
3.0 |
3.4 |
3.6 |
3.4 |
|
Healthcare |
3.2 |
3.1 |
3.4 |
3.3 |
* Sorted in descending order of assessments by residents of municipal okrugs. Source: VolRC RAS public opinion monitoring data.
Another negative trend that was revealed in the latest article by the editor-in-chief40 is the rather persistent gap between residents’ assessments of the general situation in the country (predominantly pessimistic) and of their personal lives (cautiously optimistic). Thus, 26.2% of respondents expect 2026 to be a successful year for the country, whereas the figure for themselves and their families is already 39.6% (13.3 p.p. higher, Tab. 8). In other words, there is a certain polarization – a gap between “the country” and “oneself”.
Table 8. In your opinion, what will the coming year be like?*, % of respondents
|
Response option |
2018 |
2019 |
2020 |
2021 |
2022 |
2023 |
2024 |
2025 |
2026 |
Change (+/-), 2026 vs |
|
|
2025 |
2023 |
||||||||||
|
For Russia |
|||||||||||
|
Very successful, generally good |
35.9 |
35.7 |
36.6 |
31.4 |
29.0 |
24.9 |
25.7 |
27.6 |
26.2 |
-1 |
+1 |
|
Rather difficult, poor, very hard |
38.8 |
36.8 |
37.4 |
42.5 |
44.2 |
49.2 |
47.7 |
46.2 |
46.2 |
0 |
-3 |
|
For the region |
|||||||||||
|
Very successful, generally good |
32.6 |
33.6 |
35.4 |
28.0 |
28.9 |
25.7 |
28.2 |
27.5 |
28.6 |
+1 |
+3 |
|
Rather difficult, poor, very hard |
40.1 |
39.3 |
39.1 |
45.7 |
46.1 |
49.0 |
46.3 |
46.6 |
43.8 |
-3 |
-5 |
|
For you (your family) |
|||||||||||
|
Very successful, generally good |
39.4 |
38.1 |
39.7 |
34.0 |
34.7 |
31.8 |
35.2 |
38.0 |
39.6 |
+2 |
+8 |
|
Rather difficult, poor, very hard |
35.1 |
35.5 |
35.8 |
41.2 |
40.2 |
41.6 |
39.1 |
37.1 |
34.5 |
-3 |
-7 |
|
* The questions were asked in February 2026. Source: VolRC RAS public opinion monitoring data. |
|||||||||||
In such a situation, attention should be drawn to the fact that the adaptation phase of Russian society has, to a certain degree, been completed: it has moved from the shock of 2022–2023 to a “new normality” with a recovery in personal expectations, and future dynamics will depend on the authorities’ ability to convert the stability of personal expectations into positive assessments at the regional and federal levels. The key risk is the deepening of the gap between “life here and now” and “the country’s prospects”.
An unfavorable environment and dissatisfaction with objective living conditions in a territory constitute one of the factors that determine the population’s migration attitudes. According to a VCIOM survey conducted in early 2026, nearly 19% of Russian residents plan to leave their locality 41 .
The findings of our own surveys yield similar results. Thus, 14% of the region’s residents plan to move permanently to another locality within the next 3–5 years; at the same time, the share of those who found it difficult to answer is high (across the region as a whole, around 23% of respondents were unsure, Tab. 9 ), which also testifies to the instability of their migration attitudes and their sensitivity to changes in the economy, social policy, and quality of life.
More entrenched migration attitudes are characteristic of residents of large cities, whose population plans to move outside the region, whereas residents of municipal okrugs plan to move to another (larger) locality within the region.
Official statistics also testify to the predominance of this vector of migration. Furthermore, whereas in 2010 the region’s cities registered a net migration gain (the coefficient was 3.7 per mille), this subsequently turned into a net loss (-0.5 per mille in 2023); in rural areas, the rate of net migration loss over the same period fell from 9.5 to 1.3 per mille owing to a change in the population structure toward older age cohorts characterized by low migration activity 42 .
This attests to the reproduction of centripetal population migration trends, which in the long term represents a risk for the reproduction not only of the rural periphery but also of the region’s major cities.
The greatest migration potential is observed among young people under 30 (20.1% of those surveyed plan to leave, and 28.1% were undecided, i.e., altogether nearly half), residents with higher education (17.9% plan departure and 24.2% were undecided, i.e., do not rule out the possibility of moving), and high-income population groups
Table 9. Distribution of answers to the question “Do you plan to move permanently to another locality within the next 3–5 years?”, % of respondents
|
Response |
Vologda |
Cherepovets |
Municipal okrugs* |
Region overall |
|
No |
51.7 |
63.4 |
70.6 |
63.4 |
|
Yes, including: |
17.4 |
13.8 |
12.1 |
14.1 |
|
to another urban locality in the Vologda Region |
3.3 |
1.5 |
4.8 |
3.5 |
|
outside the Vologda Region |
8.6 |
5.8 |
3.2 |
5.4 |
|
to another rural locality in the Vologda Region |
1.9 |
3.5 |
3.1 |
2.9 |
|
outside the country |
3.6 |
3.0 |
1.0 |
2.3 |
|
Difficult to answer |
30.9 |
22.8 |
17.3 |
22.5 |
|
* Sorted in descending order of assessments by residents of municipal okrugs. Source: VolRC RAS public opinion monitoring data. |
||||
41 Will there be a garden city here?! VCIOM. February 18, 2026. Available at: analiticheskii-obzor/zdes-budet-gorod-sad
42 Urban and Municipal Okrugs (Districts) of the Vologda Region. Socio-Economic Indicators. 2024: Statistical Collection. Vologdastat. Vologda, 2025. 275 p.
(16.3% and 24.7%, respectively), which leads to a decline in the region’s human potential (Tab. 10).
The foregoing makes it imperative to fundamentally revise the priorities of state policy and to seek internal sources of development for local territories, including by enhancing the financial and economic autonomy of the institution of local selfgovernment.
It is necessary to begin by searching for an idea that could unite Russian society – the population, the authorities, and business. Notably, according to VolRC RAS research, the value consensus in Russian society is forming around “statist” and patriotic ideas rather than around liberal-individualist or pro-Western orientations. Thus, the view that the key idea capable of uniting Russian society today is “the unity of the peoples of Russia with the aim of its rebirth as a great power” was expressed by nearly half of all respondents (48.2%), which is 26 p.p. higher than in 2002. Moreover, intergenerational continuity can be observed: growth in support for this idea is recorded in all age groups, including young people under 30.
However, to put this into practice, what is required is the “nationalization” of the ruling elites, whose guiding principle should be the implementation of a sovereign state policy within the framework of a new social contract in the context of economic, military, and sociocultural confrontation with the countries of the collective West. As Russia’s historical experience demonstrates, this would make it possible to ensure the internal consolidation of the authorities and society in the face of emerging challenges.
Table 10. Socio-demographic profile of respondents who answered the question “Do you plan to move permanently to another locality within the next 3–5 years?”, %
|
Indicator |
Yes, outside the Vologda Region |
Yes, to another urban locality in the Vologda Region |
Yes, to another rural locality in the Vologda Region |
Yes, outside the country |
No |
Difficult to answer |
|
Gender |
||||||
|
Male |
6.8 |
3.3 |
3.6 |
2.4 |
61.0 |
23.0 |
|
Female |
4.3 |
3.7 |
2.3 |
2.2 |
65.3 |
22.2 |
|
Age |
||||||
|
Under 30 |
9.5 |
4.8 |
1.0 |
4.8 |
51.9 |
28.1 |
|
30–55 |
5.5 |
4.5 |
3.3 |
2.6 |
56.1 |
28.0 |
|
Over 55 |
3.8 |
1.9 |
3.1 |
1.0 |
76.3 |
14.0 |
|
Education |
||||||
|
Secondary and incomplete secondary |
5.1 |
4.1 |
3.5 |
1.0 |
67.1 |
19.1 |
|
Secondary vocational |
3.1 |
3.6 |
2.7 |
1.6 |
64.7 |
24.2 |
|
Higher and incomplete higher |
8.5 |
2.6 |
2.4 |
4.4 |
58.0 |
24.2 |
|
Income groups |
||||||
|
Bottom 20% |
5.5 |
4.4 |
4.1 |
1.8 |
53.1 |
31.0 |
|
Middle 60% |
3.9 |
3.8 |
3.3 |
1.8 |
69.9 |
17.2 |
|
Top 20% |
8.5 |
3.0 |
1.8 |
3.0 |
59.0 |
24.7 |
|
Source: VolRC RAS public opinion monitoring data. |
||||||
At the same time, the liberal reforms of the 1990s and the “capitalism for the few” that was built as a result, together with high levels of corruption at all echelons of power, currently constitute the key constraint on transforming the governance system and effectively implementing a sovereign state policy.
“In terms of its scale and the depth of its impact on the life of Russian society, the opportunistic behavior of the Russian bureaucracy exerts a particularly strong influence. Certain of its representatives ignore the tasks of reform or carry them out with an orientation toward their own group interests. This manifests itself in the plundering of the state budget and corruption ”43.
“ The elite today lacks patriotic feeling toward Russia; it is material values that come to the fore. Therefore, it is still too early to speak of the ‘nationalization of the elite’”44.
The scale of the problem is vividly illustrated by the following facts. In 2025, over 43,000 corruption-related crimes were registered (more than one-third of them were committed on a large or especially large scale and as part of organized groups); the number of such cases involving officials in law enforcement agencies, the military-industrial complex, and the judicial system is growing. According to the Prosecutor General’s Office, in 2025 a total of 1.6 trillion rubles worth of real estate and other assets were returned to the state treasury 45
(for reference: this is almost 0.8% of the country’s GDP and 28% of the total federal budget deficit for 2025).
Furthermore, as noted in the latest report by Minchenko Consulting 46 , it is precisely the inertial scenario in domestic politics that the hostile surroundings and the risks of a military confrontation with NATO currently render the most readily understandable for the elite, while the stability of the bureaucratic system comes to the fore as the key parameter. All of this could freeze the transformations taking place within the elites and represents a risk to the implementation of a nationally oriented policy.
“The negative external environment remains a serious constraint on domestic political dynamics in Russia. The hostile surroundings and the risks of a military clash with NATO make an inertial scenario in domestic politics the most readily understandable one for the elite, with system stability coming to the fore as the key parameter”.
“The key changes in the elite structure are linked to a partial rotation within the legal and security bloc, which is not yet complete, as well as to large-scale purges of the regional and federal bureaucracy...”47
Addressing this task presupposes the need to instill in the elites a patriotic identity, to give priority to national interests over personal or transnational ones, and to transform them into genuine bearers of the national idea.
An important role in this process belongs to patriotic socialization and to giving priority in public-service promotion (the “social elevator”) to individuals who demonstrate a commitment to national interests 48 .
“...the problem of the nationalization of the elites cannot be solved through organizational and legal instruments of coercion. A systemic, strategically well-calibrated solution to the problem is required – i.e., a solution that would shape conditions that would guarantee protection for society, the state, the authorities, and the elites from political and value diffusion”49.
It is worth noting that on March 1, 2024, on the initiative of the President of the Russian Federation Vladimir Putin, the federal personnel program “Time of Heroes” was launched; in our view, this program has an important role to play in this process. The program is aimed at training highly qualified managers from among participants in the special military operation for work in state and municipal government bodies and state-owned companies 50 . Over two intakes, 168 people have undergone training 51 , and more than 80 participants have received appointments 52 . In December 2024, Vladimir Putin issued instructions to expand the “Time of Heroes” program to the regions 53 .
It seems appropriate to scale up this project to other spheres of public life – i.e., to systematically “cultivate” a new elite that is prepared, not only in word but also in deed, to implement the sovereign development path of the country in the context of contemporary geopolitical transformations.
Alongside this, a fundamental shift in the country’s economic development model is required. Among the key strategic priorities of the new development model should be the growth of labor productivity, the development of the domestic market, and the production of goods with high added value. It was precisely the need to address these strategic tasks and to ensure sustainable economic growth that Vladimir Putin drew attention to at a meeting on economic issues with the Government and the Central Bank of the Russian Federation held on April 15, 2026.
“I believe that we must constantly direct our efforts toward preparing concrete measures to stimulate growth and toward elaborating adequate decisions to overcome the generally expected tendencies that have manifested themselves in recent times.
And, of course, as has already been said, I expect proposals for additional measures aimed at restarting the growth of the domestic economy, at supporting business initiatives, and at improving the structure of employment in favor of sectors with more effective jobs and high value added”54.
A similar position was expressed by the country’s leading experts (S. Glazyev, R. Nigmatullin, O. Dmitrieva, K. Babkin, O. Sukharev) in their speeches at the Tenth Moscow Economic Forum (MEF-2026), held in early April 2026. Without concealing the scale of the existing problems in the country’s economy, they put forward proposals for revising monetary and fiscal policy, since the high key interest rate has undermined economic growth, while tax increases (including VAT) and the pressure on small businesses have stoked inflation. In their view, it is necessary to shift the fiscal burden from production to consumption. Furthermore, the country needs a new industrialization, support for productive business, and sensible protectionism. To this end, it seems advisable to develop an institution of targeted investment lending at 2–4%, as is now actively applied in China and the West, in order to enable the economy’s transition to a new technological paradigm 55 . This, in turn, makes it more urgent to ensure balanced spatial development across the country.
To summarize certain outcomes, it should be noted that for countries with large territorial expanses, the problem of spatial development is a determining factor in the context of ensuring national security. At the same time, the liberal approach to regulating these processes, which has been actively applied in Russia over recent decades, has led to an exacerbation of negative trends – above all, the degradation of the potential of peripheral territories and the locational compression of the country’s developed socioeconomic space.
Konstantin Babkin, President of the Rosspetsmash Association:
“We are gathering in an unusual situation. We need to develop cities, villages, build roads, work, and invest. Yet at the same time we are seeing a cooling of the economy. Factories are switching to a three-day working week, farmers are refusing to sow – there is apathy in many sectors of the economy and spheres of human activity”56.
Sergey Glazyev, State Secretary of the Union State of Russia and Belarus:
Robert Nigmatullin, Academician of the Russian Academy of Sciences:
“Taxes should be taken not from production but from super-incomes. The country is heading toward a double-digit economic decline. We are late, colleagues, and the world is not waiting”58.
It is worth noting, however, that a certain positive turn in state policy, in our view, has now taken place. In particular, in implementing the Strategy for the Spatial Development of Russia to 2030 (with a forecast horizon to 2036), the state program on the “Integrated Development of Rural Areas”, and a number of other regulatory instruments, significant efforts and budgetary resources are expected to be directed – alongside the development of urban agglomerations – toward modernizing the economy and infrastructure of small and medium-sized towns and rural settlements. It is precisely this that will make it possible to create a solid economic foundation for the modernization of their local economies and a comfortable living environment for the population of these territories.
In this context, in our view, the implementation of the following set of measures could also become a promising instrument of state policy, one that would unlock the potential of deep-lying territories and create conditions for the development of the country’s domestic market:
-
a) the formation of a hierarchically polycentric organization of the socio-economic space of Russia’s regions, based on ensuring the co-development of urban agglomerations of various scales and of other key settlements;
-
b) the modernization of traditional industries and the creation of new-economy sectors in small and medium-sized towns as key settlements; what appears strategically important here is, on the one hand, to establish their close production cooperation with agglomerations in implementing major national-economic projects, and,
on the other, to promote their development as organizational-economic, production, and cultural-educational centers for rural areas;
-
c) the revival – including on an innovative basis – of socio-economic ties along the “urban– rural” axis 59 .
The principal condition for their effective practical implementation, however, is the loyalty of the national elites to the country’s sovereign development path, since after 2022 Russia has entered a new phase that requires the consolidation of all forces and the enhancement of the effectiveness of public administration – above all, in terms of ensuring national security against the backdrop of the threats facing the country. These circumstances make it imperative to organize a system for monitoring the ongoing spatial transformations and the development of territorial communities at all hierarchical levels (federal, regional, and municipal).
Putting these priorities into practice will contribute to increasing the effectiveness of strategic state governance, which will enable the President to continue implementing the course of national development, guided by “the country’s interests for centuries to come...” 60 .
