Satellite Monitoring of Atmospheric Carbon Dioxide in Krasnoyarsk Krai

Author: Botvich I.Yu., Pisman T.I., Vysotskaya G.S., Rachinskiy M.I.
Journal: Журнал Сибирского федерального университета. Серия: Техника и технологии @technologies-sfu
Section: Исследования. Проектирование. Опыт эксплуатации
Article in issue: 3 т.19, 2026.
Free access
The present study analyzes the year-to-year (2003–2021) and seasonal variations in concentration of atmospheric CO2, Land Surface Temperature (LST), and Normalized Difference Vegetation Index (NDVI) in Krasnoyarsk Krai, based on satellite data. Over the study period, the annual average concentration of atmospheric CO2 had increased by 41 ppm. Analysis of seasonal variations in CO2 concentration demonstrated a carbon dioxide decrease in summer and an increase in winter. Positive trends were revealed in the annual average LST and the average NDVI values for a period between March and October in Krasnoyarsk Krai over 2001–2023. Analysis of the spatial distribution of CO2 in the atmosphere of Krasnoyarsk Krai in 2021 revealed higher CO2 concentrations (about 415 ppm) in the west of Krasnoyarsk Krai, as far as the Yenisei River. Lower CO2 concentrations (about 414 ppm) were found in the northern, island areas (ice-covered area and Arctic deserts) and in the regions of the Central Siberian Plateau and Sayan Mountains. Analysis of correlation of the LST and NDVI spatial distributions for 2021 revealed a positive relationship of NDVI to LST. In the northernmost, island part of Krasnoyarsk Krai, the negative LST value is correlated with the negative NDVI value. Farther south, a classical increase in LST and NDVI occurs. The coefficient of correlation between LST and NDVI over the entire area of Krasnoyarsk Krai is rather high: 0.83.
Krasnoyarsk Krai, satellite data, carbon dioxide (CO2), Land Surface Temperature (LST), Normalized Difference Vegetation Index (NDVI), maps of spatial distribution
Short address: https://sciup.org/146283296
IDR: 146283296 | UDC: 528.8.04
Спутниковый мониторинг углекислого газа в атмосфере Красноярского края
Приведены результаты анализа межгодовой (2003–2021 гг.) и сезонной динамики концентрации CO2 в атмосфере Красноярского края, радиационной температуры поверхности Земли – LST и нормированного вегетационного индекса – NDVI растительности по спутниковым данным. За исследуемый период показано увеличение среднегодовой концентрации CO2 в атмосфере на 41 ppm. Анализ сезонной динамики концентрации СО2 показал уменьшение диоксида углерода летом и увеличение – зимой. Выявлен положительный тренд среднегодовых LST и средних значений NDVI за период с марта по октябрь на территории Красноярского края за 2001–2023 гг. При анализе пространственного распределения СО2 за 2021 г. повышенные значения CO2 выявлены в атмосфере западной части Красноярского края (около 415 ppm), вплоть до реки Енисей. Пониженные значения концентрации СО2 (около 414 ppm) выявлены в атмосфере северной, островной части края (зона льдов и арктических пустынь), районах Средне-Сибирского нагорья и Саян. При анализе корреляции пространственного распределения LST и NDVI за 2021 г. определена положительная зависимость значений NDVI от LST. На территории северной островной части края отрицательное значение LST коррелирует с отрицательным значением NDVI. Далее с севера на юг происходит классическое повышение температуры LST и индекса NDVI. Коэффициент корреляции между LST и NDVI по всей территории Красноярского края достаточно высокий и составляет 0,83.
Text of the scientific article Satellite Monitoring of Atmospheric Carbon Dioxide in Krasnoyarsk Krai
Цитирование: Ботвич И. Ю. Спутниковый мониторинг углекислого газа в атмосфере Красноярского края / И. Ю. Ботвич, Т. И. Письман, Г. С. Высоцкая, М. И. Рачинский // Журн. Сиб. федер. ун-та. Техника и технологии, 2026, 19(3). С. 377–386. EDN: OJDXZQ
The first experiments in remote sensing of atmospheric CO2 concentration were performed in the late 1990s using spectrometers onboard satellites to study to atmosphere. For instance, during 1996–97, the Japanese satellite ADEOS conducted global measurements of CO2 in the near infrared band using the IMG Fourier transform infrared spectrometer [3].
In 2014, NASA launched Orbiting Carbon Observatory-2 (OCO-2), designed to collect more exact data on the spatial distribution and temporal variations in carbon dioxide concentration in the Earth’s atmosphere. The state-of-the-art high-resolution infrared spectrometer onboard OCO-2 is capable of recording even small CO 2 variations over the entire planet [4].
Satellite observations are used to monitor regional sources and sinks of carbon dioxide and track year-to-year and seasonal CO 2 concentration dynamics, in order to gain insight into the global carbon cycle and climatic processes.
The purpose of the present study was to analyze year-to-year (2003–2021) and seasonal concentrations of atmospheric carbon dioxide in Krasnoyarsk Krai based on satellite data and to examine correlations of the spatial distributions of the annual average concentration of carbon dioxide, CO 2 , Land Surface Temperature, LST, and the Normalized Difference Vegetation Index, NDVI, averaged for a period from March to October, in Krasnoyarsk Krai in 2021.
Material, Data and Methods
The current study was performed for Krasnoyarsk Krai – the second largest administrative region of the Russian Federation. It is situated in Eastern Siberia, in the Yenisei River basin, between 51°46′ and 77°43′ N (the mainland), extending to 81°16′ (with the Severnaya Zemlya islands), and between 78° and 113° E.
In the north, Krasnoyarsk Krai is bounded by two seas of the Arctic Ocean – the Kara Sea and the Laptev Sea. In the east, Krasnoyarsk Krai borders the Republic of Sakha (Yakutia) and Irkutsk Oblast, in the south – Tuva Republic and the Republic of Khakassia, and in the west – Kemerovo Oblast and Tomsk Oblast as well as Khanty-Mansi Autonomous Okrug and Yamalo-Nenets Autonomous Okrug.
Krasnoyarsk Krai has three climate zones: Arctic, subarctic, and temperate ones. Within each climate zone, climatic features vary not only from north to south but also from west to east.
Krasnoyarsk Krai measures about 3000 km from north to south and 1250 km from west to east. The landscape-geographical zones represented in it include Arctic deserts, tundra, forest-tundra, taiga, forest-steppe, and steppe. The northernmost islands contain the ice zone and Arctic deserts.
Satellite data and methods
Three datasets were downloaded from data repository [5] :
-
1. 2002–2009. The AIRS/Aqua L3 product is monthly data on mid-tropospheric carbon dioxide (CO 2 ), Level 3, obtained by the AIRS and AMSU instruments onboard the Aqua satellite. The data spatial resolution is 2.5° × 2°.
-
2. 2010–2014. The AIRS/Aqua L3 product is monthly data on mid-tropospheric carbon dioxide (CO 2 ), Level 3, obtained by the AIRS instrument onboard the Aqua satellite. The data spatial resolution is 2.5° × 2°.
-
3. 2015–2022. The OCO-2 GEOS Level 3 monthly product is Level 3 monthly data retrieved from the NASA satellites – the Orbiting Carbon Observatory-2 (OCO-2). The data spatial resolution is 0.5° × 0.625°.
The present study considered the annual average and seasonal concentrations of CO 2 for 2003– 2021.
Land Surface Temperature (LST) was obtained from satellite monthly data (the MOD 21C 3V61 product) for 2001–2023.
Normalized Difference Vegetation Index (NDVI) was obtained from satellite monthly data (the MOD 13А3V61 product) for 2001–2023 (the averaging period was between March and October each year). The NDVI data from November to February are not included, as they are not available for some of the northern areas (above 66.5°) because of the short or non-existent daylight and bad weather conditions.
The maps of CO 2 , LST, and NDVI spatial distributions were made for 2021.
Coefficients of correlations between NDVI and LST were determined using Pearson’s formula in each pixel of the study area. The time series for the calculations were from March to October from 2001 to 2023. The spatial resolution was 1 km.
Results and Discussion
Analysis of variations in the annual average concentration of carbon dioxide from 2003 to 2021 demonstrated an increase in CO2 concentration for Krasnoyarsk Krai (Fig. 1). Over the study period, the concentration of atmospheric CO2 had increased by 41 ppm (from 374 to 415 ppm).
The year-to-year CO 2 rise is mainly associated with the increase in anthropogenic emissions [6]. In the last 100 years, the increase in the concentration of atmospheric CO 2 has chiefly resulted from emissions caused by fossil fuel (oil, coal, gas) combustion and eradication of forests.
The annual increase in the concentration of atmospheric CO 2 is determined not only by the rates of anthropogenic emissions but also by rates with which it is naturally absorbed or released by terrestrial ecosystems and the Global Ocean [7]. These two processes, especially the natural carbon absorption, demonstrate year-to-year variability.
Fig. 2 shows seasonal variations in the concentration of atmospheric CO 2 in Krasnoyarsk Krai for a period between 2003 and 2021. Variations in CO2 concentration during 2003–2014 are represented as broken-line graphs, with hardly any pattern, while during 2015–2021, there are evident seasonal
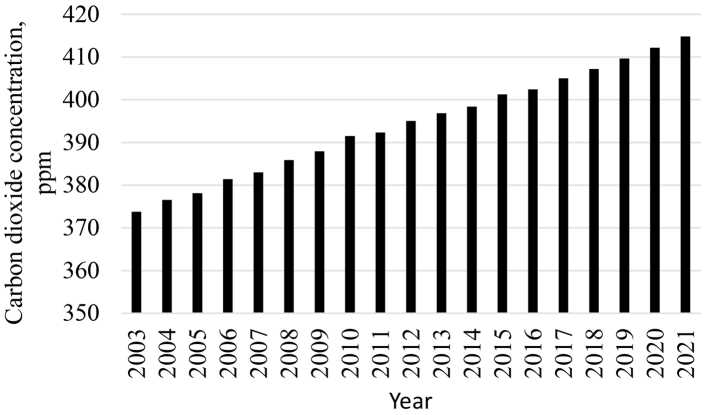
Fig. 1. Multiyear variations in the annual average concentration of atmospheric CO2 in Krasnoyarsk Krai based on satellite data
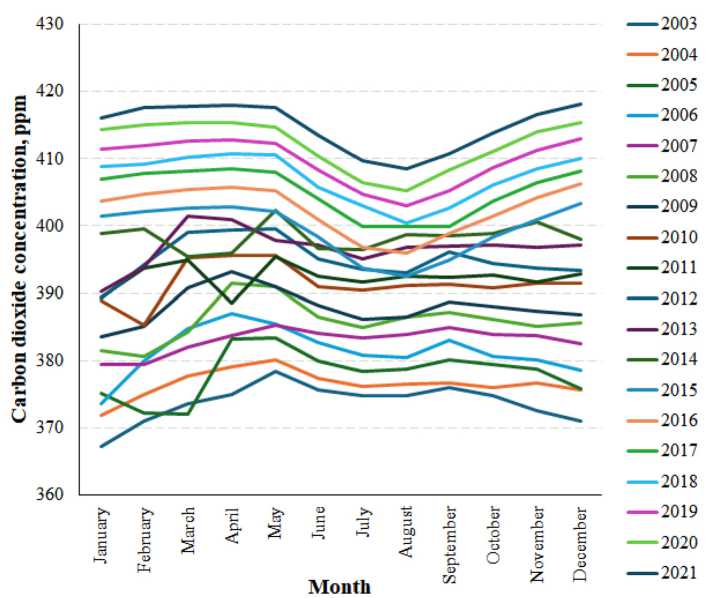
Fig. 2. Seasonal variations in the concentration of atmospheric CO2 in Krasnoyarsk Krai based on satellite data variations in CO2 concentration, with a decrease in summer and an increase in winter. The accuracy and the repeatability of the shapes of the graphs for 2015–2021 are attributed to the launching of OCO-2 (U.S.) in 2014 – a satellite designed to collect more accurate data on the spatial distribution of carbon dioxide concentration in the Earth’s atmosphere.
A study of carbon budget at the ZOTTO international observatory (Central Siberia, 700 km away from Krasnoyarsk) from 2009 to 2015 also showed the clear seasonality of CO2 concentration in the ground level atmosphere, with a short-term minimum in late July – early August and an extended maximum between late December and early March [8]. These seasonal variations in the atmospheric CO 2 concentration are caused not only by the specific atmospheric-ecosystem gas exchange of CO 2 in the prevailing plant communities located close to the ZOTTO observatory but also by the specific air mixing and atmospheric circulation in the intracontinental regions of the world such as Krasnoyarsk Krai [9].
As is known, vegetation cover is a crucial factor in seasonal variations of carbon dioxide. In the seasonal cycle, in summer, the prevailing process is CO 2 absorption, which co-occurs with C emission, while in winter (after leaf fall), only C emission occurs. Vital functions of numerous organisms are an important source of carbon dioxide. The greatest contribution is made by respiration of fungi and bacteria, which degrade the dead matter of plant tissues, and plant (primarily, root) respiration. Hence, CO2 absorption by vegetation leads to the seasonal minimum of atmospheric CO2 concentration in summer and maximum in winter [10].
One of the key factors determining the amount of carbon dioxide emitted to the atmosphere is soil temperature. A study found that in taiga, the farther north, the more closely CO2 emission is correlated with soil temperature while moisture content is not a significant factor for most soils in the region, which are sufficiently moist [11].
Summing up, CO2 emission parameters are determined by such factors as natural climatic conditions in the area and scenarios of anthropogenic impact, which influence soil temperature and moisture content, microbial composition of the soil layer, and development of the plant cover [12].
To estimate the effect of soil temperature and development of vegetation on variations in CO 2 concentration, we examined multiyear variations in Land Surface Temperature (LST) and Normalized Difference Vegetation Index (NDVI), which was averaged for March–October, in Krasnoyarsk Krai over a period of 2001–2023 (Fig. 3). A positive trend was found for both LST and NDVI, similar to CO 2 .
Analysis of the correlation between CO 2 , LST, and NDVI for a period between 2003 and 2021 is presented in Table 1. A moderate positive correlation was found between CO2 and LST, a stronger one – between CO 2 and NDVI, and the strongest – between LST and NDVI. Thus, productivity (NDVI) of vegetation in Western Siberia is primarily determined by temperature (LST). Moreover, vegetation indices, such as NDVI, are positively related to carbon sequestration by plant biomass [13].
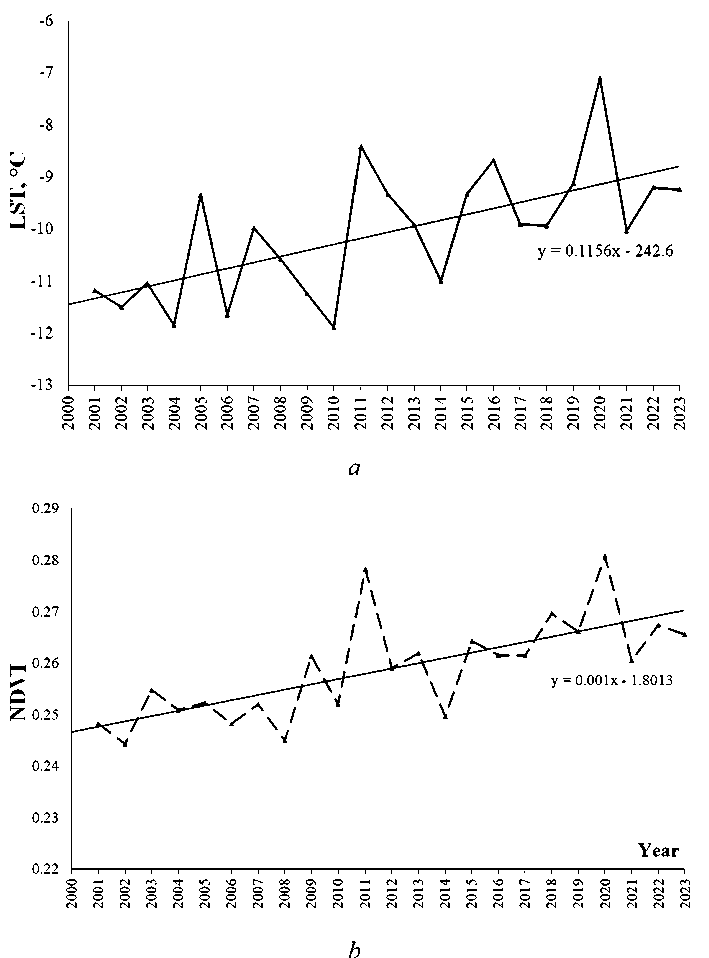
Fig. 3. Multiyear variations in the annual average Land Surface Temperature (LST) – (a) and average NDVI values from March to October – (b) in Krasnoyarsk Krai over 2001–2023
Table 1. Correlation (Pearson correlation coefficient (r)) between year-to-year CO2 concentration and year-to-year LST and NDVI (March–October) in Krasnoyarsk Krai over a period of 2003–2021
|
CO 2 |
LST |
|
|
LST |
0.55 |
– |
|
NDVI |
0.63 |
0.77 |
The relationships between CO 2 , LST, and NDVI were analyzed for 2021 using the maps of spatial distribution of concentration of atmospheric CO2, Land Surface Temperature (LST), and Normalized Difference Vegetation Index (NDVI) (Fig. 4).
Higher CO2 concentrations (about 415 ppm) were found in the west of Krasnoyarsk Krai, as far as the Yenisei River (Fig. 4 a). Lower CO 2 concentrations (about 414 ppm) were found in the northern, island region of the area (ice-covered area and Arctic deserts) and in the regions of the Central Siberian Plateau and Sayan Mountains (green color). Presumably, the distribution of CO 2 in Krasnoyarsk Krai is correlated with the terrain features and the process of movement of air masses from west to east.
Analysis of correlation of the LST and NDVI spatial distributions for 2021 supports the positive correlation between NDVI and LST (Fig. 4 b, 4 c, 4 d). In the northernmost, island part of Krasnoyarsk Krai, in the zone of ice and Arctic deserts, the negative LST value is correlated with the negative NDVI value. Farther south, a classical increase in LST and NDVI occurs [14].
The relationship between LST and NDVI is determined by the land cover structure. In the regions with a large proportion of green vegetation, there is a strong positive correlation between LST and NDVI because in such regions NDVI is increased more substantially in the early growing season, when the air and surface temperatures are rising [15].
Conclusion
Analysis of multiyear (2003–2021) and seasonal variations in the concentration of atmospheric CO2, Land Surface Temperature (LST), and Normalized Difference Vegetation Index (NDVI) in Krasnoyarsk Krai, based on satellite data, resulted in the following findings:
– Over the study 19 years, the annual average concentration of atmospheric CO2 had increased by 41 ppm. Analysis of the seasonal variations in CO 2 concentration showed a carbon dioxide decrease in summer and increase in winter.
– There was a positive trend in the annual average Land Surface Temperature (LST) in Krasnoyarsk Krai over 2001–2023.
– Another positive trend was revealed by analyzing variations in the average NDVI values over a period between March and October during 2001–2023.
– Analysis of the spatial distribution of CO 2 in the atmosphere of Krasnoyarsk Krai in 2021 revealed higher CO2 concentrations (about 415 ppm) in the west of Krasnoyarsk Krai, as far as the Yenisei River. Lower CO 2 concentrations (about 414 ppm) were found in the northern, island region of the area (ice-covered area and Arctic deserts) and in the regions of the Central Siberian Plateau and Sayan Mountains.
– Analysis of correlation of the LST and NDVI spatial distributions for 2021 supports the positive relationship of NDVI to LST. In the northernmost, island part of Krasnoyarsk Krai, the negative LST – 383 –
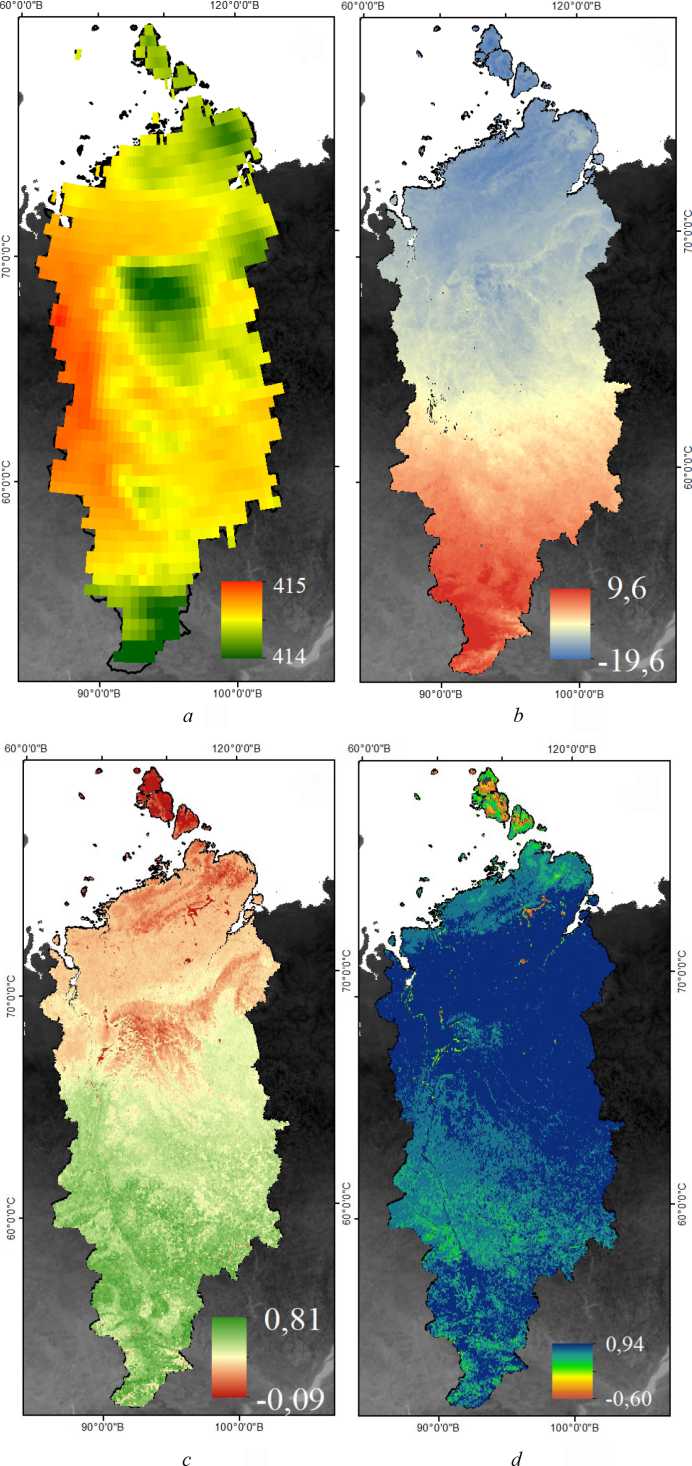
Fig. 4. The spatial distribution of annual average CO2 concentrations in the atmosphere of Krasnoyarsk Krai (2021) – a, LST values (2021) – b, NDVI values (the averaging period – between March and October 2021) – с, correlations between NDVI and LST from 2000 to 2023 (March–October) – d value is correlated with the negative NDVI value. Farther south, a classical increase in LST and NDVI occurs. The coefficient of correlation between LST and NDVI over the entire area of Krasnoyarsk Krai is rather high: 0.83.
