Simple detection and classification of road lanes based on image processing

Author: Lucia Vanesa Araya, Natacha Espada, Marcelo Tosini, Lucas Leiva
Journal: International Journal of Information Technology and Computer Science @ijitcs
Article in issue: 8 Vol. 10, 2018.
Free access
Road accidents, besides being one of the main causes of mortality, have an economic impact on vehicle owners. Several conditions as driver imprudence, road conditions and obstacles are the main factor that will cause accidents. The most important automotive industries are incorporating technology to reduce risk in vehicles. In this way, lane detection systems have important attention, because from this data is possible to determine risk situations such as presence of obstacles, incorrect lane changes or lane departures. This paper proposes a technique for lane detection, based on image processing, which allows identifying the position of lateral lanes and their type. The method is composed of four stages: edge enhancement, potential lanes detection, post-processing and color lane estimation. The method was proved using image dataset and video captures over 12.000 frames. The accuracy of the system was of 91.9%.
Lane detection, image processing, video processing
Short address: https://sciup.org/15016288
IDR: 15016288 | DOI: 10.5815/ijitcs.2018.08.06
Text of the scientific article Simple detection and classification of road lanes based on image processing
Published Online August 2018 in MECS
World statistics show that at least 3,500 people die daily in traffic accidents, and is in the top-ten causes of death according to World Health Organization statistics. To reduce this factor, some researchers propose to detect the key points where accidents are more likely to occur [1] to take actions based on it. On the opposite, the automotive industry has been incorporating smart systems throughout the last decade. This trend requires that automotive developers provide optimal and competitive solutions to the market. These systems monitor internal [2] and external information [3] -[4] of the vehicle, or combination of both [5], and try to mitigate risk situations. The systems can be passive, though notifications to the driver, or active, acting over the vehicle control.
Some systems for driver safety are based on lane detection from real time video capture, and this information is used to prevent possible dangerous situations (dangerous maneuvers, lane departure, obstacle identification, among others). The lane detection refers to locate a road boundary without knowledge about the road infrastructure. The use of these techniques allows detecting tight curves, obstacles and the vehicle position, to mitigate possible risks. Often drivers can intentionally change their rails, or lane departures can occur by distraction.
Several research works on lane detection can be found in literature, approaching the problem from different aspects. These systems use data from various sources, as image sensors, LIDAR, GPS or a combination of them. The VaMoRs [6] system uses multiple processors and lens wide angle and telephoto for autonomous driving. Also, DARVIN [7] combines GPS and visual information. Another approach is presented in Ma et al. [8] that combine radar and image information. Radar images improve performance against weather conditions, such as snow, where the camera could be obstructed. However, most of the research uses only image information as input data.
Narote et al. [9] identifies the following common stages in lane detection systems: image preprocessing, color processing, selection of region-of-interest (ROI), lane modeling and lane detection. Their work includes also stages relative to lane departures systems, but they are not analyzed because exceed the limits of this research.
The preprocessing stage lets to reduce computational time, through dimensional, temporal or space color map reduction, and to remove noise in the images. The success of the application depends strongly of this stage, and the operations performed are associated with environmental conditions, as not-well-marked lanes, smog, rain, sun, shadows, among others. Several image preprocessing techniques are applied by many researchers to increase the lane detection accuracy, and include smoothing via mean, median [9] or Gaussian [11] filters, contrast enhancement, and edge detectors as Canny [12], Sobel [13], Prewitt [14], or Roberts. An empirical study of edge detectors for road lanes is presented in [15], showing that the Canny algorithm was the most time consuming and the Roberts algorithm is not only the smallest size and the most accurate one to lane detection.
In addition, experimental results based on texture analysis are shown in [16], where a Gabor filter is used to estimate each pixel orientation to detect the vanishing point; or as presented in [17] which apply feature extraction of lanes based on the Gaussian Sum Particle filter (GSPF). In contrast, other authors use alternative preprocessing methods, as the steerable filters [18] which are orientation dependent, and avoid the use of edge detectors and smooth filters.
The color processing stage tries to transform the color space of input images to another more adequate for lane detection. Generally, all the research bases on the component Y from the YCrCb model, but some solutions use a different model, as in [19] and [20].
The ROI selection involves reducing redundant image data, discarding spurious information; this stage consequently improves both speed and accuracy of the system. Generally the images are frontal view captures from a camera located in a fixed position. For this reason, most researchers analyze only the lower part of the image [21], or middle part [22]. Generally, the dimension of the ROI is fixed, but some works use a variable size ROI, as in [23] where the size of ROI is established according to vehicle speed.
The lane modeling is another feature of lane detection systems. The solutions could be capable to detect lanes based on several possibilities as: surfaces planes [24] or considering elevation models, straight or curved lanes [25], roads or urban environments [26]. Many research bases the lane identification stage on Hough transform, being this the most popular method for detecting and locating straight lines [27]. Others uses modifications of it, as the proposed method in [28] which presents a modification to Hugh Transform to increase the computation performance, or the Modified Additive Hough Transform used in [29], or the use of the Adaptive Hough Transform as in [13].
However, for curved roads, the set of solutions is wide, involving the use of different algorithms or techniques. Some works applies B-Splines, Bezier Splines [26] parabola and hyperbola fitting [30], among others. Also some algorithms analyze the curvature of lanes, as [31] which applies Improved River Flow (IRF) and RANSAC. The IRF method searches feature points in the far vision field guided by the results of detecting straight lines in near vision field or the curve lines from last frame. RANSAC is utilized to calculate the curvature, which can eliminate noisy feature points obtained from Improved River Flow. Another solution presented in [32] multiple lanes are detected using multi-object Bayes filter. This filter uses a double gradient feature and a structure tensor feature calculated on video images.
This paper proposes a simple algorithm for lane detection from images captured inside a vehicle. The proposal allows identifying the road lane boundaries using the Hough Transform, and this classifies the road type based on mark colors. The system can be applied to road with well-marked lines, and the complexity is adequate to be implemented as an embedded system. This work is organized as follows: the section II describes the proposed method and the section III the experimental results, showing results from an image database and real images taken on local roads. The conclusions are exposed in section IV, and finally, the section V details the future works based on this proposal.
-
II. Proposed Method
General assumptions must be considered in relation to the different types of signaling marks in lanes, and are based on color, shape, and continuity. Those assumptions are described in different route manuals.
The road lines are classified on 3 categories based on their location on the roadway: the center lines ( H1 ) indicate the separation of traffic flows in opposite directions and denotes not overtake advise, the edge lines ( H3 ) shows to drivers the end of rail, and the rail line ( H2 ) indicates the separation of traffic flows circulating in the same direction.
The lines are classified by:
-
• Stroke : continuous, discontinuous or mixed.
-
• Number : single or double.
-
• Size : normal or wide.
-
• Color : yellow or white.
The white color is used in longitudinal marks to separate traffic flows, generally in the same direction, cross marks, and special marks. On the other hand, yellow lines are used to separate traffic flows in the opposite direction and special marks, and are also used on the left edge of railcars or semi-highways.
Longitudinal Lines are located in parallel to the road, and provide "positive" guidance to drivers. Those lines are used as boundaries of the roadway areas, and indicates where is safe to drive. They define and delimit widths of rails and roadways, and indicate where it is safe to overtake another vehicle. In turn, they provide "negative" guidance indicating areas where it is not safe to circulate or directly prohibited. Thus, they define zones with prohibition of overtaking. According to Annex L Chapter VI Point 27, they are strips of minimum width of 0,10m to 0,30m and must be reflective. The longitudinal lines have two types of lines: continuous and discontinuous. The continuous line means that the line cannot be crossed. The dashed line means that the line can be crossed. The discontinuous stroke is characterized by the succession of a "mark" or "cane" which is the painted segment, followed by a "gap" or "gap" that is the unpainted segment.
In presence of continuous line, regardless their color, an overtaken is not allowed. The right border line is white in conventional and highways, and the left border line can be white or yellow, depending on whether they are motorways or highways respectively. Also, a continuous line indicates that it should not be crossed or circulates about it, regardless of their yellow or white. It is used the border line, being white on conventional roads and on the right side in multilane and white or yellow on the left side roads, the highways or expressways.
A double solid line reinforces the concept of the above and defines a minimum separation between the two directions of traffic. It is used as central separator line or traffic system separator.
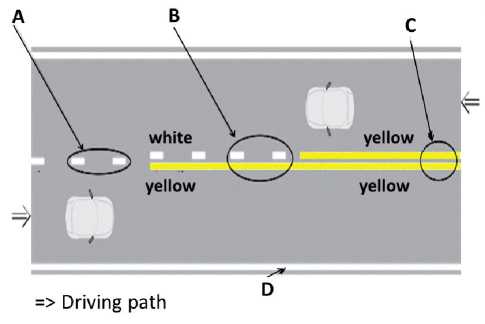
Fig.1. Classification of lines A) Discontinuous line: zone WITHOUT prohibition of overtaking. B) Double mixed line: zone WITH prohibition of one-way overshoot. C) Double continuous line: zone with
Prohibition of bidirectional overrun and D) simple continuous line edge-line.
A dashed line indicates that a driver can legally make a passing maneuver in that area. It is basically used as Rail Line, or Central Line. It is used as an "extension" Border Line at major intersections and links.
Finally, continuous and dotted parallel lines indicate the permission to transfer in the direction of the discontinuous to continuous and prohibiting continuous to discontinuous crossing. It is used as the Central Line.
By general rule, the central lines in areas without prohibiting of overtaking consist of strips dashed white, while the center line in areas with crossing prohibition consists of a strip of continuous line color yellow. All must have a width of not less than 0.10 m.
Based on the above criteria, an analysis of existing techniques of edge enhancement and line detection is displayed, which algorithm should be applied on the image and thus obtain a more narrow line by a postprocessing stage. Finally, a recognition of lane lines is made and once detected the filters, you can define how to connect and what are the inputs and outputs of the recognizer that is responsible for implementing the algorithm analyzed to finally return the set of lines they are being sought.
-
A. Edge Enhancement
An edge in a digital image can be defined as a transition between two regions of significantly different gray levels. The edges provide valuable information on the boundaries of objects and can be used to segment the image, or to recognize objects.
As an initial step, an image preprocessing stage allows enhancing the input image, and thus, maximizes the optimal results for further processing. The preprocessing stage in this work involves the use of a convolutional filter with a 3x3 integer matrix. Most techniques used to enhance local edge operators employ different approaches based on derivatives (first and second order) of the gray levels of the image
V f (x , y) =
d f ( x, y ) d x
d f ( x , y ) S y
* A x f ( x , y ) = f ( x , y ) - f ( x - 1, y )
~ A y f ( x, y ) = f ( x, y ) - f ( x, y - 1)
The gradient operator is based on differences between the gray levels of the image. The partial derivatives fx(x,y ) and fy(x,y) (row gradient or column gradient) can be approximated by the difference of adjacent pixels in the same row or same column respectively.
The most commonly filters used for edge enhancement operators are Roberts, Prewitt and Sobel [33]. Tests were conducted with these filters, and turn them were combined with threshold, in late transform all intensities of a range to a single value and thus highlight the resulting image.
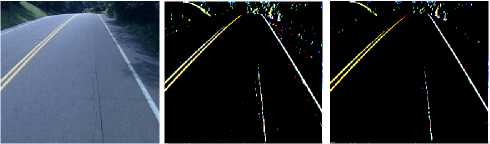
Finally, the edges are highlighted with an intensity value 255 (or white). Empirically, a RGB threshold value of (64, 64, 64) was used, even while can be configured to adapt to other capture conditions. The use of Roberts filter (Fig. 2) for edge detection obtains good response in diagonal edges, but is extremely sensitive to noise and therefore has poor accuracy. Sobel filters and Prewitt (Fig. 3) provided similar results in practice. However, the Prewitt filter was slightly more efficient than Sobel and avoids noise detection. However, it will be desirable the use of both options.
-
B. Potential Lanes Detection
Hough transform it is widely used in detection of potential lanes, because these lanes are straight lines, but can also be used to search any figure expressible analytically. Therefore, it can be represented by a set of parameters, such as circles and ellipses. A circle can be represented in a set of three parameters, defined as its center and radius, so that the Hough space becomes in three dimensional spaces. Given a set of parameter, the filter allows founding any arbitrary curve.
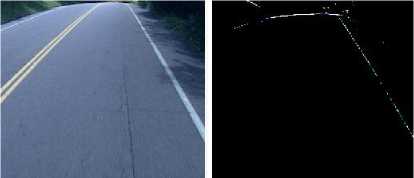
Fig.2. Roberts filter results.
(a) (b) (c)
Fig.3. (a) Original image. (b) Sobel filter. (c) Prewitt filter.
In a first step, it requires the use of an edge detector that allows obtaining image points belonging to the contour of the desired shape. In this particular case, being r = x⋅cosθ + y⋅senθ the equation of the line in polar form. The aim of the Hough transform will be find collinear points that may exist, i.e. points in the image that satisfy the equation of the line, for different values of θ and r , where r is the distance between the line and the origin and θ is the angle of the vector from the origin to the nearest point (Fig. 4).
The next step evaluates the line equations for each image point (x, y). If the equation is satisfied, an increase in the number of votes for the cell is made. A large number of votes indicate that the point lies into the line. This value of votes is equal to the line length.
For each point, the set of lines that pass through them are drawn with different angles. For each line, a line perpendicular to this one that passes through the origin of coordinates is drawn too. For each of these dashed lines the length and angle are calculated. Finally, a graph is created with the lengths of the lines by each angle, known like graph of the space of Hough. Pseudo-code how the algorithm should work to detect lines in an image is displayed:
-
1 – Upload image
-
2 – Detect the edges in the image
-
3 – For each point in the image:
-
4 – if point(x,y) i son an edge:
-
5 – For all possible angles è:
-
6 – Calculate r for point(x, y) with angle è
-
7 – Increases the position (r, è) in the accumulator
-
8 – Find the positions with the highest values in the accumulator
-
9 – Return
Some aspects must be considered when using the Hough Transform. On the one hand, the algorithm provides detection of multiple instances of a past, robustness to noise and presence of other forms. On the other hand, the computational cost of using this algorithm is very high and can detect false positives. The efficiency of the Hough transform depends on the quality of the input data of the algorithm: the edges must be detected to be either efficient procedure. In the use of the Hough transform to noisy images generally requires applying additional treatment to remove the noise. Also, the edge detection errors generate imperfections in storage space, making hard to find the correct peaks and, therefore, the appropriate figures.
-
C. Postprocessing
The Hough Transform returns all those lines that meet the preset conditions, so requires a post processing to improve performance. Also, false positives lines must be discarded, given by thickness, curvature of the rails, and environmental objects: tree, warning sign, bench, etc. (Fig. 5).
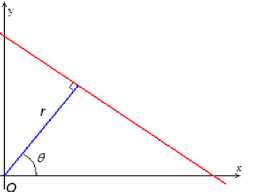
Fig.4. Representation of distance r and angle è for Hough Transform
For that reason, a module responsible for receiving candidate lines is incorporated. This module discards those lines who meet with similar characteristics. Also, classifies from a logic input the resulting lines into: left line, center line and right line. The curvature of the lines can generate some noise and, and for that, Hough Transform can return multiple segments corresponding to a single lane. This reason forces to select the optimal line passing exactly over the rail mark. This action is critical in order to perform a correct mark classification based on its color. The process is carried out using the intensity value average from the points belonging to the line. Finally, line with highest average is selected.
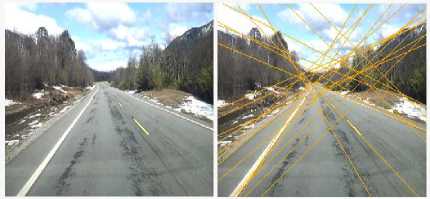
Fig.5. Results obtained from Hough Transform algorithm.
(a) (b)
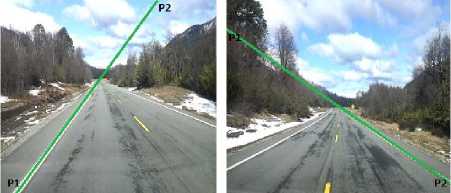
Fig.6. Detection of left (a) and right (b) lines.
The first line that attempts to recognize is left. This line will be detected in cases where the driving lane is the left, or when the lanes are well marked, allowing to detect both lanes. When the vehicle is in the left lane it is important to get this left line, as well as if the vehicle was found in the right lane. The lines of interest would be the center and the right line. This left line is obtained by looking for a line with positive orientation, based on two points P1 and P2 that form the lines obtained by Hough Transform (Fig. 6-a). The second step is to identify the right line, and can be detected mostly in cases where the vehicle is on the right track (Fig. 6-b).
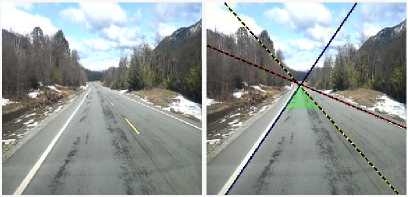
Fig.7. Detection of the center line based on the vanishing point.
Finally, the algorithm seeks the center line from the information obtained of left and right lines. The implementation analyzes each candidate center-line, looking for the intersection of the three lines at the same point, since the horizontal line projections always converge in the horizon or vanishing point (Fig. 7).
-
D. Color Lane Estimation
Once the center line is found, the algorithm tries to detect the color of it, in order to achieve the type of line mark recognizing, and consequently trigger the corresponding alert if necessary. To do this, five parallel lines corresponding to the left lines and five parallel lines corresponding to the right are crossed, getting the color of each pixel and calculating the difference with the white and yellow colors. The operation count pixels with values close to yellow and white colors. The values of counters are compared to decide if the particular lane mark is white or yellow. A default assumption about yellow color is considered to avoid possible lane crossing warnings.
Also, other considerations are taken when avoiding false positive lines due to environmental conditions, such as the steep slope of a hill or the lane delimitation itself. To improve the results, historical data obtained from previous frames are used to facilitate the selection of lines in the current frame. This is based on the assumption that the vanishing point between two consecutive frames does not change significantly, so the similarity information between the orientation of a line and the same line in the previous frame is used. This information is valid only if the focus angle of the camera is constant, otherwise the vanishing point would be variable, and this will prevent the detection of the lane.
-
III. Experimental Results
The algorithm for lane detection and tracking was tested over 12 videos. Also, 224 frames corresponding to the image data bank [34] were used to validate the proposal. The algorithm was tested on different environmental conditions, as rising sun, snow, shadows among others. The resolution of images was of 256x240 pixels. The algorithms were executed on an i7 Intel processor with 8Gb of RAM.
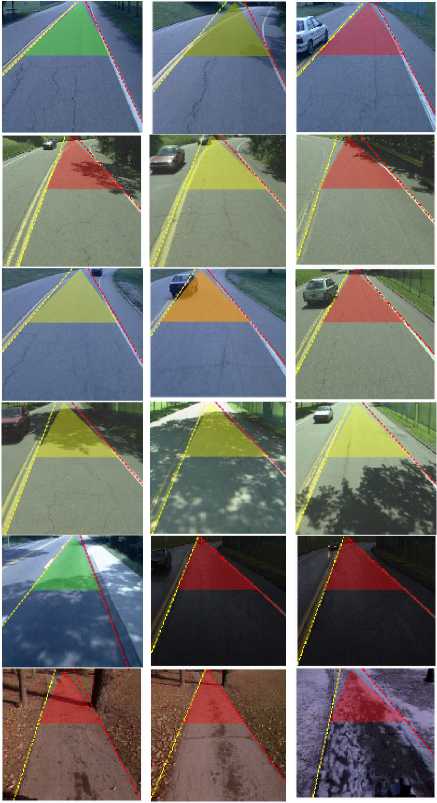
Fig.8. Rail detection results from image dataset.
The Fig. 8 shows a series of processed images (from the image bank), where the driving lane is highlighted by two lines (yellow and red). In turn, this lane is shown by a colored area in green if enabled, yellow if it cannot be exceeded and red if there is a possible risk of an obstacle in the same lane. The system of lane detection and classification was used in a framework for I2DASW (Interactive Intelligent Driver-Assistance and Safety Warning) [35]. The framework provides a flexible interface, allowing incorporating new sensors, detectors, displays, traffic rules, and so on. The framework was configured to identify safeties lane changes, and indicate the severity of situation, painting in the resulting image the lane with green color when the situation is not dangerous, yellow color when a lane change is not possible or red when an obstacle is present in the same lane.
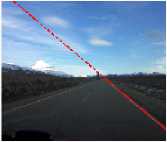
The image data set was extended incorporating images taken on roads from Argentina. This set included images from the highway that interconnect the cities of Azul and Olavarria, province of Buenos Aires, as images from province of Mendoza roads under adverse conditions, such as night, snow, and front sun and not well marked lines (Fig. 9).
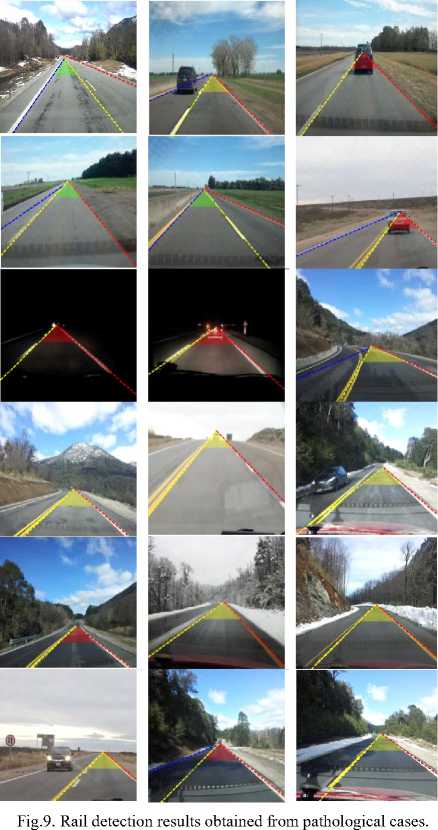
(b)
(c)
Fig.10. Errors from track detection obtained from pathological images.
(d)
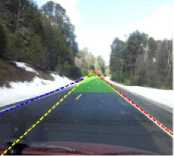
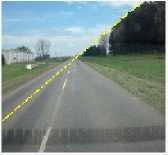
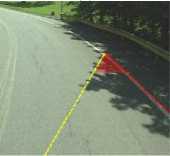
Also, some errors were detected during the algorithm accuracy evaluation (Fig. 10). When the center is not so visible, the algorithm takes as center line another one detected by some variation of colors. This case is shown in Fig. 10 (a). Also, a false positive can be detected due to the presence of trees and the right line is unmarked, as shown in Fig. 10 (b). In other cases, the system can determine erroneous results in presence of shadows on the rail or when the central line very weakened, as seen in Fig. 10 (c). If the central line does not meet the minimum established length or is not sufficiently visible, the proposed method is not able to recognize the central line, as demonstrate the Fig. 10 (d).
From the entire set of images, the system had 92% of accuracy. Also, an 8% of error rate is considered acceptable, and this error rate was produced generally by not well marked lines.
In addition, the risky lanes changes detection was proved. The system allows identifying successfully risky and safe rail changes with a rate of 94%. The errors come from not well-marked line, when the image was taken during the rail change.
-
IV. Conclusions
This work is part of a larger project to provide assistance to drivers in order to reduce the number of traffic accidents. As mentioned in the introductory section, the large increase in vehicle production coupled with other situations generated by drivers' recklessness or certain environmental conditions are major factors that increase accident statistics year by year.
The information from images was obtained applying different techniques and algorithms. The results obtained from Prewitt and Sobel filters for edge enhancement was satisfactory and do not require to use additional techniques except a threshold. Also the Hough transform provides robustness in noisy images, but requires the addition of post-processing techniques to eliminate false positives.
The proposed technique allows discriminating both the left and right lateral lines of the road and differentiated the types of central lines.
Finally, the use of historical data from previous frames improved the accuracy of lane detection.
-
V. Future Work
This work is pretended to be continued to implement an embedded system adaptable to local needs. The system can be extendable both enhancing the proposed algorithms, and adding new features. In this way, shadows omission modules can be added to increase the system features, and a major effort to identify and classify not well-marked lines in the roads. Also, pretend to add analysis of the road model, as curves and road elevation quantization.
As was detailed before, the system was integrated into an I2DASW framework. The instantiation of new features in the framework is also desirable, such as the incorporation of new traffic rules, traffic signaling recognizing, and GPS information analysis, among others.
Acknowledgment
This work was supported in part by a grant from SECAT-UNICEN (Project ID: 03/C287), and SID-UNTREF.
References Simple detection and classification of road lanes based on image processing
- V.A. Olutayo, and A.A. Eludire, "Traffic Accident Analysis Using Decision Trees and Neural Networks", International Journal of Information Technology and Computer Science, vol.6, no.2, pp.22-28, 2014. doi: 10.5815/ijitcs.2014.02.03
- D. Vijayalaxmi and E. Rani, "Driver Fatigue Estimation Using Image Processing Technique", International Journal of Information Technology and Computer Science(IJITCS), Vol.8, No.6, pp.66-72, 2016. doi: 10.5815/ijitcs.2016.06.09
- S. Godha, “On-road obstacle detection system for driver assistance,” Asia Pacific Journal of Engineering Science and Technology, 2017, vol. 3, no 1, p. 16-21. doi: 10.1109/IRDS.2002.1041361
- G. Liu, M. Zhou, L. Wang, H. Wang, X. Guo, “A blind spot detection and warning system based on millimeter wave radar for driver assistance,” Optik-International Journal for Light and Electron Optics, 2017, vol. 135, p. 353-365. doi: 10.1016/j.ijleo.2017.01.058
- A. Tawari, S. Sivaraman, M. Trivedi, T. Shannon, and M. Tippelhofer, “Looking-in and looking-out vision for urban intelligent assistance: Estimation of driver attentive state and dynamic surround for safe merging and braking,” Intelligent Vehicles Symposium Proceedings, 2014, pp. 115-120. doi: 10.1109/IVS.2014.6856600
- E. D. Dickmanns and B. D. Mysliwetz, “Recursive 3-D road and relative ego-state recognition,” IEEE Trans. Pattern Anal. Mach. Intell., vol. 14, no. 2, pp. 199–213, Feb. 1992. doi: 10.1109/34.121789
- F. Heimes and H.-H. Nagel, “Towards active machine-vision-based driver assistance for urban areas,” International Journal on Computer Vision, vol. 50, no. 1, pp. 5–34, Oct. 2002. doi: 10.1023/A:1020272819017
- B. Ma, S. Lakshmanan, and A. O. Hero, “Simultaneous detection of lane and pavement boundaries using model-based multisensor fusion,” IEEE Trans. Intell. Transp. Syst., vol. 1, no. 5, pp. 135–147, Sep. 2000. doi: 10.1109/6979.892150
- S.P. Narote, P.N. Bhujbal, A.S. Narote, and D.M. Dhane, “A review of recent advances in lane detection and departure warning system,” Pattern Recognition, 2018, vol. 73, p. 216-234. doi: 10.1016/j.patcog.2017.08.014
- N. Apostoloff, and A. Zelinsky, "Robust vision based lane tracking using multiple cues and particle filtering." Intelligent Vehicles Symposium, 2003. Proceedings. IEEE. IEEE, 2003. doi: 10.1109/IVS.2003.1212973.
- M. Aly, "Real time detection of lane markers in urban streets," Intelligent Vehicles Symposium, 2008 IEEE. IEEE, 2008. doi; 10.1109/IVS.2008.4621152.
- Y. Wang, S. Dinggang Shen, and E. K. Teoh., "Lane detection using spline model." Pattern Recognition Letters, 2000, vol. 21, no 8, p. 677-689. doi: 10.1016/S0167-8655(00)00021-0
- L. Qing, N. Zheng, and H. Cheng. "Springrobot: A prototype autonomous vehicle and its algorithms for lane detection," IEEE Transactions on Intelligent Transportation Systems, 2004, vol. 5, no 4, p. 300-308. doi: 10.1109/TITS.2004.838220
- K. Kluge, and S. Lakshmanan, "A deformable-template approach to lane detection," Intelligent Vehicles' 95 Symposium, Proceedings of the. IEEE, 1995. doi: 10.1109/IVS.1995.52825
- W. Phueakjeen, N. Jindapetch, L. Kuburat, and N. Suvanvorn, “A study of the edge detection for road lane," Electrical Engineering/Electronics, Computer, Telecommunications and Information Technology (ECTI-CON), 2011 8th International Conference on. IEEE, 2011.doi: 10.1109/ECTICON.2011.5948010
- S. Zhou, Y. Jiang, J. Xi, J. Gong and G. Xiong. "A novel lane detection based on geometrical model and gabor filter," Intelligent vehicles symposium (IV), 2010 IEEE. IEEE, 2010. doi: 10.1109/IVS.2010.5548087
- Y. Wang, N. Dahnoun, and A. Achim. "A novel system for robust lane detection and tracking,” Signal Processing, 2012, vol. 92, no 2, p. 319-334. doi: doi>10.1016/j.sigpro.2011.07.019
- J. Heechul, M. Junggon, K. Junmo, "An efficient lane detection algorithm for lane departure detection," Intelligent Vehicles Symposium (IV), 2013 IEEE, vol.42, 23-26, June 2013. doi: 10.1109/IVS.2013.6629593
- J.G. Wang, C. Lin, S. Chen, “Applying fuzzy method to vision-based lane detection and departure warning system”, Expert Syst. Appl. 3 (1) (2010) 113–126. doi: doi:10.1016/j.eswa.2009.05.026
- M. Tosini, L. Leiva, “Detection of Lateral Borders on Unmarked Rural Roads”, Journal of Multidisciplinary Engineering Science and Technology (JMEST) ISSN: 2458-9403 Vol. 4 Issue 9, September - 2017
- T. Tan, S.Yin, P. Ouyang, L. Liu and S. Wei, "Efficient lane detection system based on monocular camera," 2015 IEEE International Conference on Consumer Electronics (ICCE), Las Vegas, NV, 2015, pp. 202-203. doi: 10.1109/ICCE.2015.7066381
- J. He, H. Rong, J. Gong, and W. Huang, "A lane detection method for lane departure warning system." Optoelectronics and Image Processing (ICOIP), 2010 International Conference on. Vol. 1. IEEE, 2010. doi: 10.1109/ICOIP.2010.307
- A. Filonenko, D. C. Hernández, L. Kurnianggoro, D. Seo and K. H. Jo, "Real-time lane marking detection," Cybernetics (CYBCONF), 2015 IEEE 2nd International Conference on, Gdynia, 2015, pp. 125-128. doi: 10.1109/CYBConf.2015.7175918
- D.-J. Kang and M.-H. Jung, “Road lane segmentation using dynamic programming for active safety vehicles,” Pattern Recognit. Letters, vol. 24, no. 16, pp. 3177–3185, Dec. 2003. doi: 10.1016/j.patrec.2003.08.003
- H.J. Jang, B. Seung-Hae, and P. Soon-Yong, "Model-based curved lane detection using geometric relation between camera and road plane," Journal of Institute of Control, Robotics and Systems, 2015, vol. 21, no 2, p. 130-136
- M. Aly, “Real time detection of lane markers in urban streets,” IEEE Intelligent Vehicles Symposium, pp. 7-12, 2008. doi: 10.1109/IVS.2008.4621152
- C. Taylor, J. Košecká, R. Blasi, and J. Malik, “A comparative study of vision-based lateral control strategies for autonomous highway driving,” Int. J. Robot. Res., vol. 18, no. 5, pp. 442–453, May 1999. Doi: 10.1109/ROBOT.1998.680590
- S.C. Yi, C. Yeong-Chin and C. Ching-Haur, "A lane detection approach based on intelligent vision." Computers & Electrical Engineering, 2015, vol. 42, p. 23-29. doi: 10.1016/j.compeleceng.2015.01.002
- A. Katru and A. Kumar, "Improved Parallel Lane Detection Using Modified Additive Hough Transform", International Journal of Image, Graphics and Signal Processing(IJIGSP), Vol.8, No.11, pp.10-17, 2016. doi: 10.5815/ijigsp.2016.11.02
- Q. Chen and W. Hong "A real-time lane detection algorithm based on a hyperbola-pair model," Intelligent Vehicles Symposium 2006, IEEE, 2006. doi: 10.1109/IVS.2006.1689679.
- H. Tan, Y. Zhou, Y. Zhu, D. Yao and K. Li, "A novel curve lane detection based on Improved River Flow and RANSAC," Intelligent Transportation Systems (ITSC), 2014 IEEE 17th International Conference on , vol., no., pp.133-138, 8-11 Oct. 2014. doi: 10.1109/ITSC.2014.6957679
- H. Deusch, J. Wiest, S. Reuter, M. Szczot, M. Konrad, and K. Dietmayer, "A random finite set approach to multiple lane detection," Intelligent Transportation Systems (ITSC), 2012 15th International IEEE Conference on , vol., no., pp.270-275, 16-19 Sept. 2012. doi: 10.1109/ITSC.2012.6338772
- G. T. Shrivakshan, C. Chandrasekar, “A comparison of various edge detection techniques used in image processing,” IJCSI International Journal of Computer Science Issues, vol. 9, no 5, p. 272-276, 2012.
- Carnegie-Mellon-University, “CMU/VASC image database1997–2003, Available: http://vasc.ri.cmu.edu//idb/html/road/
- Araya, V., Espada, N., Tosini, M., & Leiva, L. (2016). “First approach to a framework for regional road-traffic accidents reduction system,” Journal of Software Engineering and Applications, vol. 9, no 05, pp. 175, May 2016.
