Simulation model for Covid-19 pandemic

Author: Trupti P. Borhade, Apoorva Kulkarni
Journal: Cardiometry @cardiometry
Section: Report
Article in issue: 20, 2021.
Free access
This paper outlines computer modeling algorithms designed to predict and forecast a COVID-19. In this paper, we consider a deterministic model. Theongoing COVID-19 epidemic quickly spread across the globe. Significant behavioural, social initiatives to limit city transport, case identification and touch tracking, quarantine, advice, and knowledge to the public, creation of detection kits, etc. and state measures were conducted to reduce the epidemic and eliminate coronavirus persistence in humans around theworld from stopping the global coronavirus outbreak. In this paper, we propose a basic SIR epidemic model to show a simulation, the MATLAB algorithm using bouncing dots to depict safe and sick people to simulate infection spread. The graphical model shown here is implemented using MATLAB package version 3.0. In this paper, we discuss the importance of models because they help one explore what could happen. They demonstrate how different possible futures might be shaped by what we are doing now. We can examine the effects of specific interventions in different ways such as quarantine or a lockdown & explore how simulations may predict, how infectious diseases advanced to show the possible result of an outbreak, and better guide initiatives in public health regarding the pandemic response andpandemic past including an overview of the key characteristics of adverse pandemic consequences and epidemic outbreak.
Simulation modeling, Flatten the curve, Pandemic, COVID-19, Coronavirus
Short address: https://sciup.org/148322441
IDR: 148322441 | DOI: 10.18137/cardiometry.2021.20.125133
Text of the scientific article Simulation model for Covid-19 pandemic
Trupti P. Borhade, Apoorva Kulkarni. Simulation model for Covid-19 pandemic. Cardiometry; Issue 20; November 2021; p. 125-133; DOI: 10.18137/cardiometry.2021.20.125133; Available from:
The novel coronavirus spread so quickly that it changed the globe’s rhythm in 2020, as it is an outbreak of full modern global disaster health. ‘CO’ means corona, ‘VI’ means a virus, and ‘D’ means illness. This illness was previously referred to as ‘2019 novel coronavirus’ or ‘2019-nCoV.” “(CoV) is a broad family of viruses that cause diseases ranging from the common cold to more serious diseases such as Middle East Respiratory Syndrome (MERS-CoV).” In December 2019, the “HealthCommission of Hubei Province,” China, first announced the outbreak in Wuhan, China, on 31 December 2019, a cluster of unidentified cases of suspected etiological pneumonia (suspected cases), which is extreme, was first detected in Wuhan City, Hubei Province, China [3]. Despite this, an exceptionally high number of patients in mainland China became diagnosed with SARS-CoV-2, prompting the
Chinese governments to implement stringent surveillance measures. After mid-December 2019, the epidemic of COVID-19 has gone through three stages: Local dissemination, dissemination to the population, and transmission. (i) Local outbreak: The advent of COVID-19 correlated with the world’s biggest annual human movement, i.e., the Spring Festival travel season, culminating in a massive domestic and global dissemination of the virus. The (ii) Phase of transmitting to the public:In several groups such as family in Wuhan, inter-personal and grouped transmission happens. (iii) The period of large-scale transmission of the pandemic spread: Most reports were scattered at the early stage of the epidemic, and others were connected to the Huanan Seafood Wholesale Industry. Chinese Government has taken drastic action to reduce the epidemic. Wuhan’s municipal Government halted all public transit throughout the region on 23 January 2020 and removed both inbound and outbound travel. The disease speedily increased, spreading from Hubei to other parts of China, while COVID-19 cases gradually increased in other countries [4].
The viruses spread rapidly across the world, and there were many widely scattered clusters worldwide. “As of 14 July 2020, more than 13 million COVID-19 reports have been reported in more than 188 countries and territories, resulting in more than 572,000 deaths; more than 7.22 million citizens have recovered. Cases refer to the sum of individuals tested for COVID-19 who were identified as positive according to approved official protocols.
On 28 January, Dr. Tedros Ghebreyesus, WHO’s Director-General, meets with President Xi to discuss the outbreak, emphasizing it as a top priority institution. And then on 30 January, “WHO declares COVID-19 as a Public Health Emergency of Global Concern – this follows 82 confirmed cases outside China,”‘and as a pandemic on 11 March, [5]” and now there is (“SARS CoV 2”) on all continents other than Antarctica.On 5 March, Director-General Tedros Adhamon Ghebreyesus reported that although the disease might be uncontrolled in certain settings, it is not yet uncontrollable, and this will be the criterion to qualify into the concept of a pandemic. “The possibility of a pandemic is becoming possible, and if anyonewants to name the epidemic a pandemic, it will be the first pandemic that could be effectively regulated.” Preventive steps to minimize the risk of infection include remaining at home, maintaining distance from 126 | Cardiometry | Issue 20. November 2021
others (especially those with symptoms), and washing hands regularly and for at least 20 seconds with soap and water, practice good air hygiene, and do not rub with unwashed hands the eyes, nose or mouth. Given these steps, the pandemic SERS-CoV-2 emerged in the months that COVID-19 transmissions proceeded for the first time after quarantine measures were taken on 18 March 2020. There are no COVID-19 vaccinations and no clear antiviral drugs [6]. The introduction of these steps culminated in closing several businesses, hospitals, and research institutes and limits on travel and social gatherings. People nowadays tend to operate wherever and at any time while staying linked and communicating regularly with friends, like at the main place of work of their employer, or online forums and workshops are common activities for certain individuals. “As of 2 April 2020, the cumulative amount of verified cases exceeded one million [7].”
The new estimates of a simple number of COVID-19 reproductions (R0) in January ranged from 1.4 to 2.5. However, a further study showed it was about 5.7 with a 95% confidence interval ranging from 3.8 to 8.9. The average number can differ across communities and should not be associated with a large number of widely recognized reproductions, named R, provided variables, such as social distancing and social immunity. By mid-May 2020, the effective R was similar to or less than 1.0 in several countries across the world, indicating that the risk of infection in certain areas at the time was constant or reducing[8].It has been used to justify and clarify why lockdowns, social distancing and other preventive measures are required in this pandemic to maintain the count of cases and death tolls small.” The higher the R0, the faster the epidemic begins, said and specialist in infectious diseases at Dalla Lana School of Public Health, University of Toronto developed a COVID-19 model for estimating reproduction rates.”
2.1. Objective
This research aims at examining the SIR model to simulate the outbreak of a virus over time. The MATLAB programming allows simulation and study of SIR disease dispersion Disease model of parameters varying. It provides a comprehensive system for monitoring and predicting the outbreak in a very simple, effective, and rapid manner. The proposed solution is applied with the models SIR, developed under the framework MATLAB\Simulink. We include some precise information regarding the present pandemic scenario at COVID-19 and a description of the major computer modeling techniques [9].
3. Literature Review
Mathematical simulation is a broad concept involving a wide number of techniques. Simulation is one form of working it out. “Infectious disease modeling is a method used to research the processes by which pathogens propagate, forecast the potential path of an outbreak, and test methods for managing an epidemic.” Mathematical simulations may predict how infectious diseases advance to explain the possible result of an outbreak and better guide public health initiatives. Applications use basic observations or data obtained coupled with estimates to define criteria for multiple infectious diseases [10]. Modeling may help determine which measures to avoid and which potential growth patterns to review, predict, etc., John Graunt was the first physician who explicitly sought to measure death causes in his 1662 book on the Bills of Mortality, Human and Political Observations. Bernoulli was trained as a surgeon and developed a mathematical model to explain the smallpox inoculation process.
Throughout the early 20th century, the rule of collective action was introduced by William Hamer (epidemic). Ronald Ross describes disease actions. Throughout the early 20th century, the rule of collective action was introduced by William Hamer. Ronald Ross explains the epidemic actions.
Compartmental versions appeared in the 1920s. The epidemic model Kermack – McKendrick (1927) and the Reed Frost (1928) model also characterize the connection between prone, contagious, and recov-ered[11].
3.1. Types of Epidemic Model:
“Stochastic” involves becoming a random variable or getting one, which is a method for calculating probability distributions of possible results by taking into account statistical variability over time in one or more inputs, which depends on the increasing possibilities of cancer and other disease mechanisms.
Mathematical formulas “Deterministic or compartmental” are often used when dealing with large populations. This model classifies individuals within the community into different subgroups or compartments, reflecting a particular disease level. Simulation has immense potential to help manage the global
COVID-19 crisis in 2020 and to future pandemics. Open-source programming codes are increasingly important to simulate the virus’ complex propagation over a time domain [12].
Any modeling method follows that represents and analyzes the outbreak and combines dynamic variables that can contribute to the outbreak. At the same time, there are several posts on the epidemic outlook for COVID-19. We gathered some of the COVID-19 disease predictions from other researchers, as shown.
3.2. Sir, Seird, Sird Model
The SIR model is a simple model commonly used to describe the transmission of infectious diseases and is the basis of three levels for other models like SEIR and SIRD .
The SEIR model suggests that individuals bear lifetime immunity to disease after healing. However, the tolerance wanes with time with other diseases following infection. The SEIRS model is used to enable the recovered individuals to return to a vulnerable state [13].
With the SIRD model, an extra community is placed into the “Removed” compartment. By the conclusion of SIR, to differentiate between cases rescued and cases of death. The best-established approach for knowing the epidemiology is the standard SEIR approach (“Susceptible-Exposed-Infectious-Recovered”), which is often used at the community level to identify the number of people infected as infectious or show no symptoms to which each person is immune or dies. Individuals classified as susceptible based on the number of effective reproductions with a certain probability of infection. When the R0 is over 1, virus growth will spread further, and the disease will begin to rise. If it goes below 1, the epidemic can occur at a reduced mortality risk because less than one affected patient accompanies mortality or rehabilitation resolution in an earlier event. The R0 has been recorded with very different magnitudes due to changes in the region, culture, measurement, and level of outbreak. Even though it is significant, arriving at an accurate, measured value seems difficult due to data limitations and inaccuracies in reporting. However, it appears difficult to detect R0 explicitly. Some latest research tackles this pandemic through the creation of simulation codes.
If the basic reproduction amount is larger, the overall proportion of contaminated persons in a com- munity (‘attack rate’) would be greater. Once R0 is over 3, more than 90% may become contaminated if successful treatments do not reduce the chain of infection transmission [14]. Early in the initial stages of an outbreak, knowledge of the specific replication number is significant and allows politicians to determine how robust the steps required to contain the disease will be.
Strict lockdown measures for fighting the country’s 2nd COVID-19 pandemic have been reintroduced in Beijing. When the enormity of the risk became clear, politicians tended to rely on statistical modeling knowhow to minimize their effects best, with special measures to focus on whether the curve may be flattened to reduce the healthcare burden [15]. A critical question affecting humanity is how to monitor the infectious disease outbreak and prevent the transmission. Along with the classical LBP, features from the completed modeling of LBP are also utilized for the classification using K-Nearest Neighbor (KNN) [16][17]. The extracted colour based features and LBP features are analyzed independently for glaucoma diagnosis using SVM classifier [18]. SVM classifier calculates a hyperplane that separates the feature space with maximum margin [19]. The complex texture features are discussed in for fundus image classification [20][21].
3.3. Covidsim
This is a COVID-19 epidemiologic model established by Imperial College. “The proposal expected up to 500,000 deaths in the UK and 2.2 million deaths in the US.” If, as defined in the 20-page Ferguson Report to British Prime Minister Boris Johnson, the respective governments failed to react, “a central force pressuring the British Government to shift the pandemic agenda” by imposing a nationwide freeze. Perception problems have been posed, as the Imperial College report is a one-sided analysis.
Figure 1 represents the flattening of the curve. It is looking at the benefits of a lockout, without thinking into the prices, which often involves the opinion that any single death is equivalent to every other death. A simulation run using those parameters will give the same forecast always. Somebody in the community I, for example, can infect an individual with S when they interact. Over multiple patterns run, it gives a variety of potential possibilities.
Modelers also replicate various types of human movements. Within ‘equation-based systems, people are grouped into community classes However, when groups are split into smaller, more diverse societal sub-sets depict better reality, and then the systems become more complicated. An alternate approach is utilizing an “agent-based method,” where each individual moves and responds accordingly.
“We stress that a rigorous research and quarantining scheme is the only possible long-term option before a vaccine is discovered” (Menon). “Instead of just stressing that such mechanisms do not quantify the
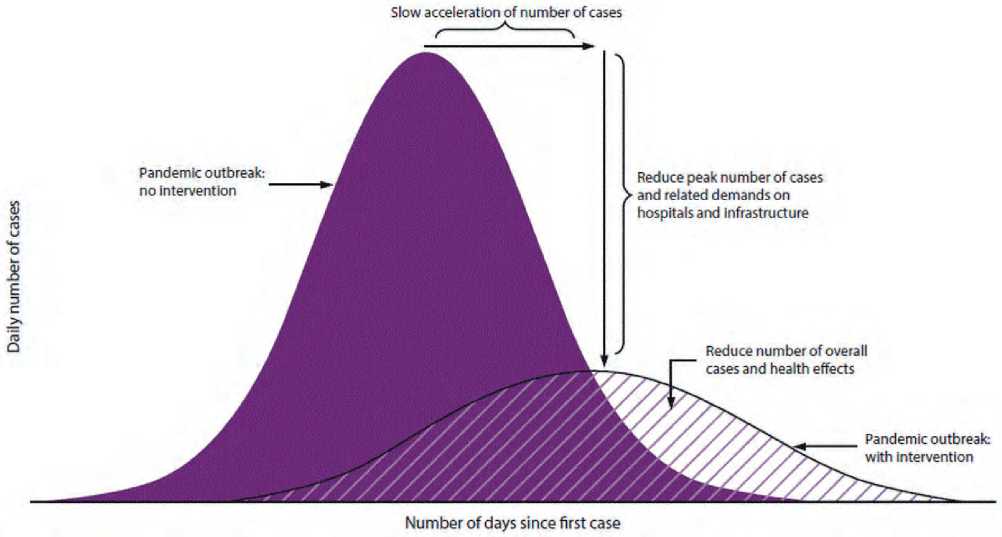
Figure 1
Flattening the curve(Image: ©)CDC
economic lockdown costs, transport opening Pan-India is not a good idea as per our model” (Pujari). In addition to this, quarantines are successful in reducing the number of citizens vulnerable to disease, and even more complex attempts to combat the far larger real-world COVID-19 outbreak. Policymakers utilize these and many other measures to prevent the spread of the infection. Their success can influence if the outbreak is wiped out or continues to grow. Studies conducted by Imperial College under the guidance of Neil Ferguson showed that “before vaccination is practicable (inevitably 18 months or longer), social distancing and other steps would be needed”
3.4. “Flattening the Coronavirus Curve: What This Means and Why It Matters”
As currently, there is no available coronavirus vaccine and testing in many nations is relatively limited. “The WHO has emphasized the need for people to take constructive measures to reduce the spread and flatten the curve said WHO Director-General Tedros Adhanom Ghebreyesus” at Wednesday’s media briefing.
The curve shows the number of new cases expected over sometime for epidemiology. Despite a drastic rise in coronavirus infections, the same amount of patients infected at each stage will see a steadier spike in cases without overburdening the healthcare system.
“Flattening the curve refers to measures of community isolation, which maintain the daily number of cases of disease at a manageable level for medical providers”
The most significant suggestion is to slash transmitting speeds by observing good grooming practices and exercising mutual distancing. Public health experts claim the increase may be stopped, whether individuals practice “internal distancing” by avoiding public places and restricting their travel in general. Now, COVID-19 will tend to grow rapidly for months without any efforts to slow it down.
3.5. Analysis 3.5.1. Coronavirus: What Is, And Will It Work, ‘Flattening The Curve?’
Working with specific reasons impacting the disease’s propagation, we can understand how we can work our way to curtail this COVID-19 outbreak and flatten the curve. The SIR model is included in the present analysis. It simulates the SIR process for the transmission of infectious diseases. The simplistic model developed in 1927 is composed of three models: susceptible (S), infected (I) recovered (R).
-
1. Susceptible: Individuals who never had the disease and who can catch it.
-
2. Infected: Those that are currently infected from the disorder and are infectious.
-
3. Recovered: People who have developed the illness previously and who are resistant. Any individual belongs to one of those groups.
As there is no antidote created for this disease yet, we may assume the whole society is vulnerable to this disease to become affected. Therefore the whole population will constitute the “susceptible” container because there is no vaccination yet created for this disease. We may assume the whole society is vulnerable to this disease to become affected. Therefore, the whole population will reflect the “susceptible” area.
An individual at the “susceptible” stage will move to the next (infectious) stage of the model by contacting an infectious human. This single move decreases the number of susceptible people by one, respectively.
The next area is for those contagious individuals who carry the illness who are likely to transmit it to other individuals. Once recovered from the illness, infected persons will switch to the “Removed” room.
The container excluded contains those no longer infected, including others who suffered from the illness (closed cases).
The initial number S (0) is the general group impacted by the outbreak, while I(0) is the total of reported cases that may be any amount but not zero. If the starting times for spread and simulation are similar, we can set R (0) to zero. The transmission rate decreases in a monotonous way over time.
Mathematically, the following differential equations can be used to describe a typical SIR model: DS dt = - β N SI (1) dt = β N SI - πI (2) dRdt = ÿI (3), where N corresponds to total population number, N = S + I+ R and the normal birth and death rates are overlooked.
Therefore, the sum (N) = (S) = (I) = (R).
The SIR model provided us a significant prediction metric called the “basic reproductive number,”
or R0 that ratio calculates how infectious an illness is, that is, how many individuals can a single sick person contaminate. If R0 > 1, the epidemic spreads, which is an important indicator of a pandemic? If R0 < 1, the spread is down
% Np = the population of the community. (Default = 100, so you easily read the percentage of the community infectious/infected)
% Ni = the number of index case (initial infectious individual, Default = 1).
% Ds = is the minimum safe distance below which the probability of being
% infected is Prinf (Measure of how contagious the disease is:
% Lower means more contagious. Default = 0.05).
% Prinf = probability that you will be infected if you are closer than Ds
% to an infectious individual (Measure of how pre-cautious people are washing hands, not touching mucus membrane Default = 0.2)
% Tr = Time it takes for an individual to be removed from the population
% (Death, Quarantined, Recovered and become immunized. Default = 1).
% F = Relative repulsive force strength (measure of social distancing Default = 1)
% video name = Simulation video file name
You can see how the Ds (a measure of contagiousness of the disease), Print (a measure of how practices personal hygiene), Tr (a measure how quickly people recover, die, or get quarantined by the Government) and F (a measure of how people adhere to social distancing) affects the rate of spread and helps flattens the curve or aggravates the situation.
3.6. Factors Considered Here:
-
1. All people randomly move
-
2. 50% of population stays home
-
3. 90% of population stays home
-
So, the default population sample size is 100, which we are trying to study the spread of the disease that has been affected.So, let us look at different cases and then see how the change of any of these parameters affects the disease’s spread.
-
• Population size = 100
-
• Minimum safe distance = 0.05
-
• The probability of getting affected if you are within that distance = 0.02
-
• The measure of social distance =1
-
3.6.1. All People Randomly Move
-
3.6.2. 50% of Population Stays Home
Figure 2 simulation graphs show that infected individuals with color range red are infected, and the susceptible people are green. Those who are removed from the model are blue. As you can see in this picture, 50% of the population is infected at the pandemic’s peak when they are talking about flattening the curve.
From Figure 3, you can see that by day 22, the disease quickly spreads from one person to the entire population. Note how the red curve line reflects the number of people affected, increases as the disease, SPREADS, and then tappers as people recover.
If we are talking about social distancing, taking precautions, the impact is very dramatic in how contagious the disease. You see from Figure 4 that 50% quarantine does not work because all people got a virus. A good result is a 20% reduction in peak.
Hopefully, there are lots of options to avoid an outbreak. In all, health authorities urged individuals to
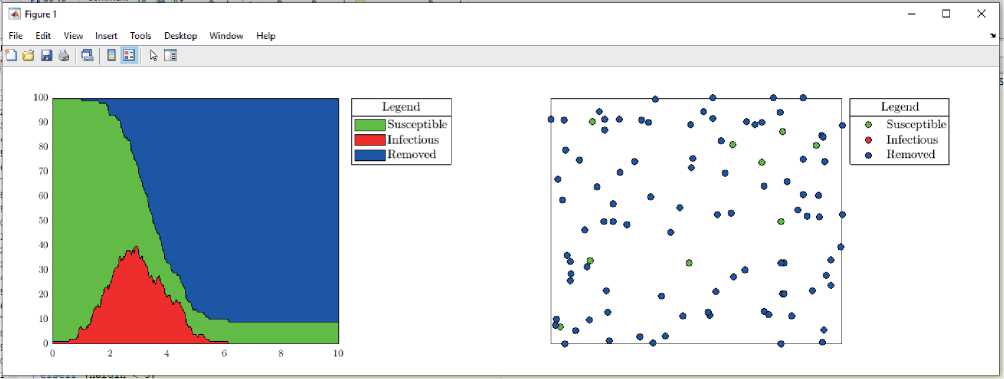
Figure 2. Simulation Graph
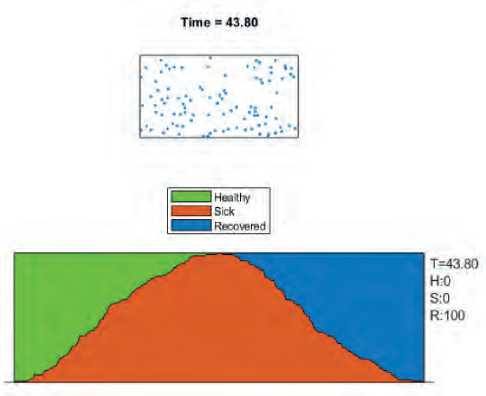
Figure 3. All People Randomly Move
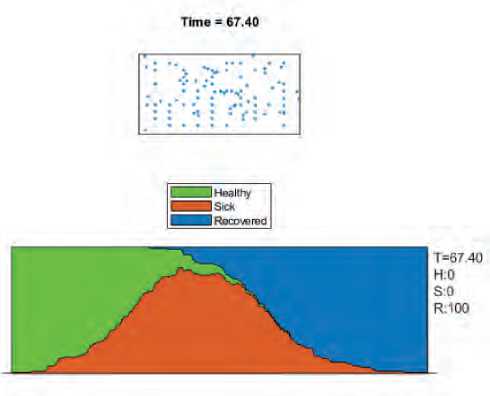
Figure 4. Population Stays Home
skip public gatherings, remain home more frequently and maintain their distance from others. As individuals are less aggressive and interact less, the risks of transmitting the infection become fewer.
-
• The minimum safe distance
DS 0.04 = 20% reduction in the measure of contagious By reducing it to 20%, it doubles the number of the individual in the community that was not affected and then reduced the percentage of the maximum number of infections at any particular time to 20% from around 50%, so this helps to flatten the curve.
-
• ES=0.05
A few people are still heading out. Because of their job or other responsibilities, they might not be willing to remain home, or maybe they just fail to obey public safety alerts. Such people are not only more likely to get infected themselves, but they are also more likely to spread illness. Individuals do not take adequate care, lock heads, do not wash their faces, so they hit the 50% risk of being infected.
-
• Print F = 0.05
Here, we see that by increasing the probability of infection, the maximum number of cases go away by about 70%, and only one individual remains unaffected throughout all the time, and everybody got infected
-
• Probability 0.02
Government responsiveness, lockdown or the case where the disease is deadly that you can get affected, and then instead you have been removed or die in half of the day = 0.05 or Government is very responsive in that if you get the infection immediately with the strict measure you recovered from the population.
-
• CR= 0.5
Nobody got infected. The single person in the population did not die or be removed or quarantined, or covered. People are not practicing hygiene; the people get infected or die, recover because people are careless
• Social distancing: F = 4 /5 More social distancing makes people safe, and by reducing their allure, individuals may be nudged off public spaces
3.6.3. 90% of Population Stays Home
4. Methodology
5. Results and Discussion
6. Conclusion
Let us see what happens as we decide to shift about a fifth of our population when the remaining three quarters follow a practice of what health professionals’ term “social distancing.”
From Figure 5, when people stay at home, in this case, the virus infects only 54% of the population, and at the peak of the disease, we have only 35-40% of sick people.
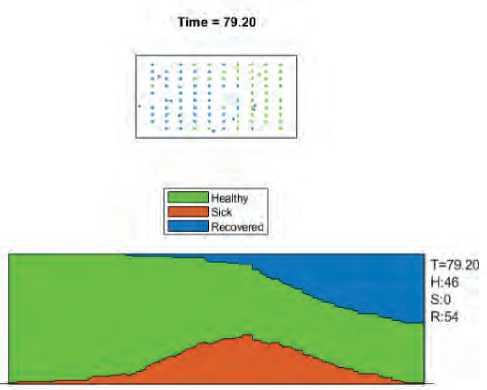
Figure 5. When People Stay Home
We explained a mathematical model, which explains COVID-19’s transmission dynamics determined using MATLAB’s parameter estimation methodas follows: susceptible, exposed but not yet infectious, infectious and removed, i.e., isolated, recovered, or otherwise no longer infectious and their compartments coded under the MATLAB\Simulink. Information resources on coronavirus outbreak and pandemic history, Countries implement online journals, downloaded databases, news articles, and various simulation models on coronavirus outbreaks. Software and methods used, such as MATLAB, provide a mathematical model prediction.
More than 2.5 million individuals became affected by the COVID-19 pandemic and have increasingly become a significant danger to health worldwide. Modeling and simulation methodologies are multiple. This paper provides a systematic method to tracking and predicting virus propagation worldwide in a simple, secure, and quick way through various opensource programs. Transmission of infectious disease is a dynamic mechanism of transmission that happens inside the public to forecast the potential pattern of infectious diseases accurately. Therefore to control or reduce the harm of infectious diseases, it has become important to research the testing and production of predictive models for infectious diseases.
Using the easiest example, you are forced that strict quarantine will significantly minimize the number of ill people and the spread of the disease. However, with varying outcomes, modest social differences typically outperform the quarantine effort, and severe social distancing generally performs well, which summarizes the results. Severe social distancing generally performs well. Figure 6 is the summary of the results.
All citizens randomly moved beyond three scenarios. An attempted quarantine, including 50% of the population stays at home, and 90% of the population stays home by exercising modest social distance, or extreme social distance is random,which implies the growth has seen unusual outcomes. The curve takes on multiple forms, depending on the degree of virus propagation, which will be a steep curve. The infection grows steadily (i.e., case numbers tend to multiply at a constant rate). The cumulative number of cases would rise to its height within several weeks. There is also a significant decline in infection rates after a sharp rise; the number of cases often decreases steadily when anyone who may get infected is diagnosed with the infection. The sooner the infection incidence rises, the quicker the local health care network’s burden shifts beyond its capacity to cope with patients.
Future Scope
We will investigate how contact tracing with a restrictive but not completely locked down regime can be used together in future work, which is a basic model, which is useful for informing and recognizing the effects of initiatives, but quantitative models are far more complicated.
The time points in which the data continuously moves are immediately excluded from the results. Absolute or partial lockdown, social distancing, quarantine, isolations containment interventions can impact the virus’s propagation and flatten the curve quicker if these steps are enforced earlier. These interventions affect the chance of infection, which results in a decrease in the beta function.
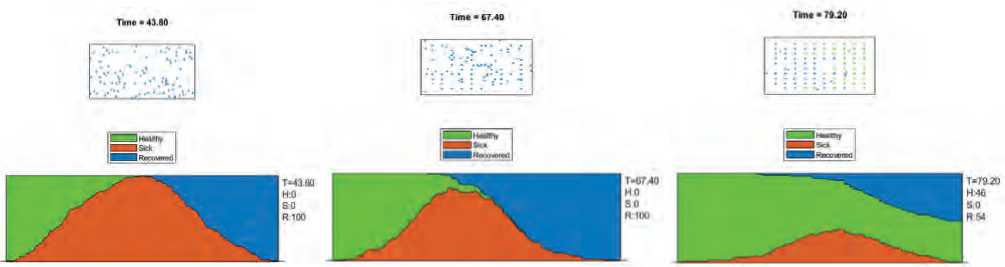
Figure 6. Summary of Results
Conflict of interest
None declared.
Author contributions
The authors read the ICMJE criteria for authorship and approved the final manuscript.
References Simulation model for Covid-19 pandemic
- World Health Organization, 2. Statement on the second meeting of the International Health Regulations (2005) Emergency Committee regarding the outbreak of novel coronavirus (2019-nCoV).
- Etter DM, Kuncicky DC, Hull DW. Introduction to MATLAB. Prentice Hall. 2002.
- Kristiansen IS, Burger EA, De Blasio BF. Covid-19: Simulation models for epidemics. Tidsskrift for Den orske legeforening. 2020.
- World Health Organization. Laboratory testing for 2019 novel coronavirus (2019-nCoV) in suspected human c ases: interim guidance, 14 January 2020 (No. WHO/2019-nCoV/laboratory/2020.2). World Health Organization.
- Jia L, Li K, Jiang Y, Guo X. Prediction and analysis of coronavirus disease 2019. arXiv preprint arXiv: 2003.05447.
- Fox J, Shin Y, Emamdjomeh A. How epidemics like covid-19 end (and how to end them faster). Washington Post. Feb, 19, 2020.
- Das S. Prediction of covid-19 disease progression in india: Under the effect of national lockdown. arXiv preprint arXiv:2004.03147.
- Pepe E, et al. COVID-19 outbreak response, a dataset to assess mobility changes in Italy following national lockdown. Scientific data. 2020;7(1):1-7.
- Arunachalam MA, Halwai A. An analysis of the ethics of lockdown in India. Asian Bioethics Review. 2020;12(4):481-9.
- Ting D, Carin L, Dzau V. Digital technology and COVID-19. Nat Med. 2020;26: 459-461.
- Livari N, Sharma S, Venta-Olkkonen L. Digital transformation of everyday life - How COVID-19 pandemic transformed the basic education of the young generation and why information management research should care? International Journal of Information Management. 2020;102183.
- Johan A, Rory H. COVID-19 and the case for global development. World Development. 2020;134:105044.
- Shahbaz M, Bilal M, Moiz A, Zubai S, Iqbal HM. (2020, May). Food safety and COVID-19: Precautionary measures to limit the spread of Coronavirus at food service and retail sector. 14(suppl 1), 749-756. doi:10.22207/JPAM.14.SPL1.12
- Saha J, Barman B, Chouhan P. Lockdown for COVID-19 and its impact on community mobility in India: Ananalysis of the COVID-19 Community Mobility Reports, 2020. Malda : Children and Youth Services Review, Science Direct. doi:https://doi.org/10.1016/j.childyouth.2020.105160
- Laato S, Islam AN, Farooq A, Dhir A. (2020). Unusual purchasing behavior during the early stages of the COVID-19 pandemic: The stimulus-organism-response approach. Journal of Retailing and Consumer Services, 57. doi:https://doi.org/10.1016/j.jretconser.2020.102224
- Kumarapandian S. Melanoma Classification Using Multiwavelet Transform and Support Vector Machine, International Journal of MC Square Scientific Research. 2018;10(3):1-7.
- Srinivasan C, Dubey S, Ganeshbabu TR. Complex Texture Features For Glaucoma Diagnosis Using Support Vector Machine, International Journal of MC Square Scientific Research. 2015;7(1):81-92.
- Murugan S, Anjali Bhardwaj, Ganeshbabu TR. Object recognition based on empirical wavelet transform. International Journal of MC Square Scientific Research. 2015;7(1):4-80.
- Prakash G, Khan, A., 2012. Investigate the Role of Impulsivity in Decisions Making During Gambling Task: Case Study. International Journal of MC Square Scientific Research, 4(1).
- Murugan S, Ganesh Babu TR, Srinivasan C. Underwater Object Recognition Using KNN Classifier; International Journal of MC Square Scientific Research 9, no. 3(2017): 48-52.
- Budai A; Bock R; Maier A; Hornegger J. Michelson, G. Robust vessel segmentation in fundus images. Int. J. Biomed. Imagingю 2013, 2013, 154860.
