Social Polarization and Income Differentiation on the “North-Center” Axis

Author: Podshivalov N.S., Sivobrova I.A.
Journal: Arctic and North @arctic-and-north
Section: Northern and arctic societies
Article in issue: 55, 2024.
Free access
The article focuses on the problem of social polarization in the global context and on the level of particular countries. The subject of the study is the economic and social parameters of functioning mechanisms of territorial development in the conditions of existing instability and social risk. Income differentiation is considered as a key factor of social distancing of society and as a determinant of social instability. The authors compare data from reports of international economic organizations, statistical bulletins and publications of the scientific community. The proportions of income inequality are analyzed in the cross-country and intra-country contexts; as an example, the regional differentiation of the Russian Arctic territories, as well as the urban and rural population of China, are assessed. Dynamic changes in absolute and relative terms of living standard indicators confirm the hypothesis of increasing social polarization. The development of the Russian Arctic territories demonstrates an imbalance between the living standards of the population and the perceived quality of life, while the main trends of regional inequality in China have clear group characteristics. The identified patterns can be used to adjust social and regional policies, to determine the parameters of development strategies and the content of government programs and projects.
Social polarization, income inequality, social justice, standard of living, social risk protection
Short address: https://sciup.org/148329528
IDR: 148329528 | UDC: [330.564.2:316.342.6](045) | DOI: 10.37482/issn2221-2698.2024.55.145
Text of the scientific article Social Polarization and Income Differentiation on the “North-Center” Axis
DOI:
Issues of social equality and income distribution have been the subject of theoretical concepts and scientific discussions since Plato and Aristotle substantiated the egalitarian approach to social justice. Social risks and social tension in the global community are among the key challenges to sustainable development. Increasing socio-economic differentiation in the global and regional context, significant gap in the main parameters of the level and quality of life in terms of “Center — Periphery”, loss of signs of consistency and unity of the economic space cause concern for development institutions.
The World Economic Forum’s reports on global risks indicate an obvious shift of emphasis from environmental to social challenges to society. Social inequality in its extreme form — polarization of society, the main segments of which are increasingly diverging in terms of values and wealth — is among the top global risks not only in the current period, but also in the long term.
Social polarization is a constant concern for the academic community, the public and non-profit sectors, and business structures. Experts have no doubt that social polarization and economic crisis are deeply interrelated in the global risk landscape, and this relationship has the greatest potential and generates numerous risks in various spheres and directions 1. The economic burden on both people and low- and middle-income countries will increase.
Uneven development against the backdrop of global challenges has revealed new categories of social risks that require deeper and more thorough analysis: social distancing, social vulnerability, loss of social capital. The entire set of modern social risks has a negative impact on wellbeing, restrains dynamics and reduces opportunities for human development. While the situation with economic risks is more certain, as the world community has already developed regulatory mechanisms, social challenges require transformation of the system of social regulation of society.
Materials and methods
The scientific answer to one of the main economic questions “for whom to produce” after the egalitarian, Rawlsian and utilitarian approaches culminated in the liberal (market) justification of K. Marx, J.S. Mill, M. Weber. One of the modern and widely discussed concepts was proposed by T. Piketty in “Capital in the 21st century”, in which he combined the theory of economic growth and the theory of income distribution (factor and individual) [1]. On the basis of correlation analysis, attempts have been made repeatedly to identify the dependence of income inequality on various exogenous and endogenous variables: phases of the economic cycle, demographic characteristics, and socio-political determinants.
Social polarization as an extreme degree of uneven development is considered by modern domestic scientists in different dimensions. The concepts of social polarization, social differentiation and social fragmentation are compared in philosophical works by O.D. Belobrova and Yu.V. Kolin. The sociological studies by A.L. Panishchev [2] and A.V. Sapronov [3] consider the structure, functions and consequences of social polarization. The socio-political mechanism of social polarization in society becomes the subject of study by L.E. Ilyicheva, A.V. Lapin [4]. In the context of spatial development (physical and geographical), this term is studied by V.Yu. Kuzin [5].
Foreign authors also raise the issues of inequality in opportunities depending on age, education, income level, ethnicity, race and political affiliation. Chinese researchers are active in this direction. The works by X. Yan [6], B. Wu [7], Z. Li [8], S.X.B. Zhao [9], Y. Zhao [10] and others consider the causes of regional inequality and its impact on human capital. The authors conduct an indepth analysis of prospects and trends, comparing the values of individual social indicators in China with similar indicators of the BRICS countries. Over the past three decades, the rate of economic growth has allowed the Chinese economy to become the second largest in the world. However, this has had a negative impact on social development characteristics, widening the gap in China’s national income distribution.
Regarding the northern and Arctic territories of Russia, a significant contribution to measuring the scale and trends of inequality is made by representatives of the Luzin Institute for Economic Studies of the Kola Science Centre of the Russian Academy of Sciences, the Federal Center for Integrated Arctic Research of the Ural Branch of the Russian Academy of Sciences, the Institute of Regional Consulting. They consider systemic factors of inequality as a potential threat to the sustainable development of the Arctic: for example, E.A. Korchak focuses on families with children [11], T.P. Skufina — on people of retirement age and residents of single-industry towns [12], E.N. Bogdanova, L.V. Voronina — on the indigenous and small-numbered peoples of the North [13].
The main trends in income distribution and the scale of social polarization in the global context are considered by the United Nations Development Program (UNDP) and the World Economic Fund (WEF) in the space of “challenges-threats-risks”. Inequalities in human development received particular attention in the UNDP Human Development Report 2019 2, and the following report examines the causes of inequality and, in particular, the dangerous planetary changes in the Anthro-pocene 3. The Human Development Report 2021/2022 is entitled “Uncertain Times, Unsettled Lives: Shaping Our Future in a Changing World”, it attempts to unify and broaden the debate on uncertainty and future development 4. The emergence and manifestation of new forms of insecurity are analyzed in the Special Report on Human Security for 2022. The Human Development Report 2023–2024, entitled “Overcoming Deadlock: Rethinking Cooperation in a Polarized World” 5, opens a trilogy of reports on different levels of uncertainty, their identification and the formation of strategies for advancing human development. In this report, the centerpiece is an analysis of the recovery of the human development index (HDI) by country, and experts conclude that this process will be extremely uneven: the gap between countries in terms of HDI value is growing.
The annual WEF Global Risk Reports (GRR) are of particular interest to analysts, as they identify risks in the short and long term and assess them in terms of “probability - possible impact”.
Social inequality and social instability in the context of global risks
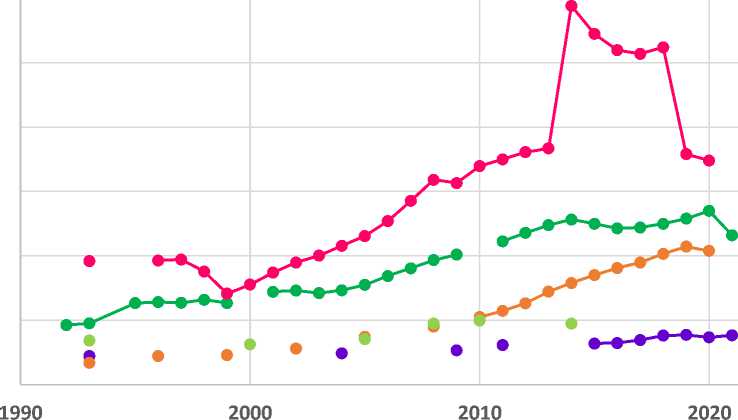
A dynamic analysis of the results of WEF reports over the past dozen years reveals fundamental differences in assessments of global threats belonging to different categories. While eco- nomic risks prevailed in 2009 and 2010, since 2017 they are no longer in the top five in terms of both probability and consequences, as the global community has already accumulated experience in managing such uncertainties. In the context of discussion on social risks, three stages of perception of their significance on the global agenda can be distinguished (Fig. 1).
2012 2013 2014
Severe income disparity
Severe income disparity
Income disparity
Chronic fiscal imbalances
Chronic fiscal imbalances
Rising greenhouse gas emissions
Rising greenhouse gas emissions
Cyber-attacks
Water supply crises
Water supply crises
Mismanagement of population
2017 2018 2019
Extreme weather events
Unemployment and underemploment
Climate change
Cyber-attacks
|
Extreme weather events |
Extreme weather events |
Extreme weather events |
|
Large-scale involuntary migration |
Natural disasters |
Failure of climate-change mitigation and adaptation |
|
Major natural disasters |
Cyber-attacks |
Natural disasters |
|
Large-scale terrorist attacks |
Data fraud or theft |
Data fraud or theft |
|
Massive incident of data fraud/theft |
Failure of climate-change mitigation and adaptation |
Cyber-attacks |
2022 2023 2024
|
Climate action failure adaptation |
Cost-of-living crisis |
Misinformation and disinformation |
|
Extreme weather events |
Natural disasters and extreme weather events |
Extreme weather events |
|
Biodiversity loss |
Geoeconomic confrontation |
Societal polarization |
|
Social cohesion erosion |
Failure to mitigate climate change |
Cyber insecurity |
|
Livelihood crises |
Erosion of social cohesion and societal polarization |
Interstate armed conflic |

- Societal
- Economic
- Environmental
- Technological
- Geopolitical
Fig. 1. Map of risks 6.
At the first stage (2012–2014), social risks occupied the first position, determining experts’ concern about serious income inequality. In addition, in 2013, the risk of ineffective governance in the context of social policy implementation, which may deepen social instability in general, ranked fifth. The second stage (2017–2020) is the stage of leadership of environmental risks, which were located in 2–3 positions out of five not only in terms of probability, but also in terms of impact on development prospects. The third stage (2022–2024) — attention shifts again to social risks, while environmental risks do not lose their importance. At the third stage, the cost of living crisis remains a serious problem and a new concept appears — social polarization, which is interpreted as ideological and cultural differences within and between communities, leading to a decrease in social stability, deadlocks in decision-making, economic disruption and increased political polarization. In the 2024 report, WEF experts classify income inequality as an economic risk. Despite the fact that this risk is not included in the consolidated top five, a number of countries, including 3 BRICS countries — Brazil, India and Iran — mention it in a detailed national report.
Classification of countries by income level allows analyzing the proportions of intercountry inequality by individual countries and by groups of countries (Table 1).
Table 1
Parameters of cross-country inequality, 2022 7
|
Ratio |
GNI per capita (Atlas methodology), times |
GNI per capita (PPP), times |
|
GNI of the highest income country to GNI of the lowest income country |
521.7 |
141.0 |
|
Average GNI value for a group of high-income countries compared to the average GNI value for a group of low-income countries |
71.2 |
27.9 |
|
Average GNI of North America to average GNI of Sub-Saharan Africa |
45.1 |
17.6 |
Differentiation of countries by income level is determined by the difference in the value of the main quantitative indicator — gross national income per capita. In terms of GNI per capita for 2022, calculated using the Atlas methodology, Bermuda leads with an income of $125,210, more than 520 times higher than Burundi with income of $240, which is the lowest in the list of countries. Looking at the GNI ratio of the groups of countries recognized by the World Bank as high-and low-income countries, the wealth gap is more than 7000%. It is worth noting that the differences in the level of GNI calculated using PPP are not so dramatic. Using this methodology, Norway has the highest GNI per capita ($118,470), which is 141 times higher than the income of Burundi.
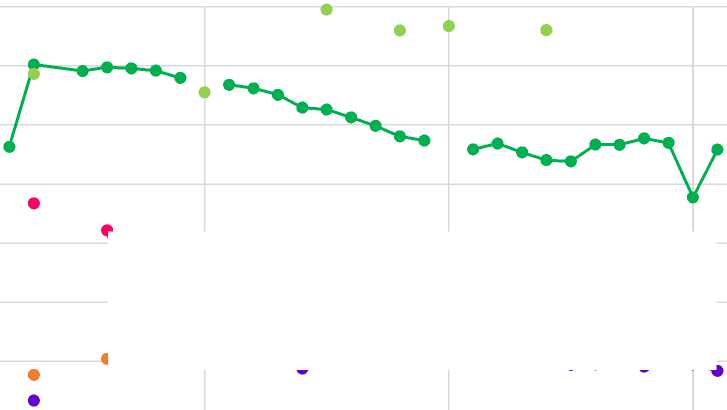
The World Bank, in order to fulfil its primary objective of fighting poverty, compiles a databank of key inequality indicators through comparative assessments. Extreme poverty has been declining for nearly a quarter of a century, but the challenges of the past five years with the pandemic, geopolitical controversies and the climate agenda have worsened the situation, especially for countries with a large proportion of poor people. A slight decline in median income is also observed in the BRICS countries (Fig. 2).
-
7 Calculated by: World Development Indicators database, World Bank, 1 July 2023. URL:
(accessed 10 February 2024).
Brazil India China RF South Africa
Fig. 2. Median income of the BRICS countries (composition of 2021) 8.
In the analyzed period, it is possible to observe changes in median income across the BRICS countries, with the trajectory proportional to the GDP growth rates of these countries. Differences in the cross-country values of the indicators remain significant.
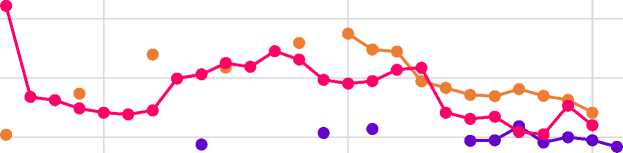
Differences in income distribution between countries in the context of discussion on social polarization should be transferred to the analysis of differentiation of intra-country indicators. Changes in the Gini index as one of the key indicators characterizing the degree of income inequality in society are insignificant in most countries of the world, as well as in the BRICS countries (Fig. 3).
-
8 Compiled using data from the World Bank’s Poverty and Inequality Platform. URL: https://pip.worldbank.org/key- inequality-indicators (accessed 20 February 2024).
Brazil India China RF South Africa
Fig. 3. The value of the Gini index of the BRICS countries (composition of 2021) 9.
It is worth noting that the Gini index values of Brazil and South Africa exceed the accepted optimal value (0.3–0.4), which indicates serious income inequality in these countries.
Differentiation of incomes of the population of the constituent entities of the Russian Federation with the Arctic territories
The parameters of income inequality in Russia vary significantly by individual territories. The presence of regional differentiation is demonstrated by published ratings on individual and aggregate indicators of socio-economic development of the constituent entities of the Russian Federation. For example, the potential cash balance of an average family with two children after minimum expenses varies from -7,298 to 118,310 rubles/month 10, and the quality of life rating score ranges from 26.506 to 83.640 11. Wages with percentage bonuses in the Soviet period of development of the northern territories compensated for the uncomfortable living and working conditions. In modern Russian economic conditions, the motivational function of the wage structure has ceased to work; despite this, the stereotype about the high level of income of the population of the northern and Arctic territories still exists.
A comparison of the positions of the Arctic subjects of the Russian Federation in terms of the level and quality of life does not confirm the hypothesis that there is a direct relationship between these indicators (Table 2). While the Arctic territories are in the top 20 in terms of wages (with the exception of the Republic of Karelia), and the Chukotka and Yamalo-Nenets Autonomous okrugs occupy the first two positions, then in terms of quality of life, 6 out of 9 subjects are in the top 20 outsiders. The Chukotka Autonomous Okrug disproves the hypothesis “high incomes — high quality of life” most vividly: it is the first in terms of wages and 75th in terms of quality of life.
Table 2
Subjects of the Arctic zone in all-Russian ratings 12
|
Rating of regions by salaries |
Rating of regions by family wealth |
Rating of regions by quality of life |
|
|
Yamalo-Nenets Autonomous Okrug |
2 |
1 |
21 |
|
Murmansk Oblast |
10 |
14 |
36 |
|
Krasnoyarsk Krai |
12 |
10 |
40 |
|
Republic of Sakha (Yakutia) |
8 |
8 |
70 |
|
Komi Republic |
13 |
18 |
71 |
|
Nenets Autonomous Okrug |
4 |
9 |
73 |
|
Republic of Karelia |
26 |
55 |
74 |
|
Chukotka Autonomous Okrug |
1 |
7 |
75 |
|
Arkhangelsk Oblast |
17 |
21 |
78 |
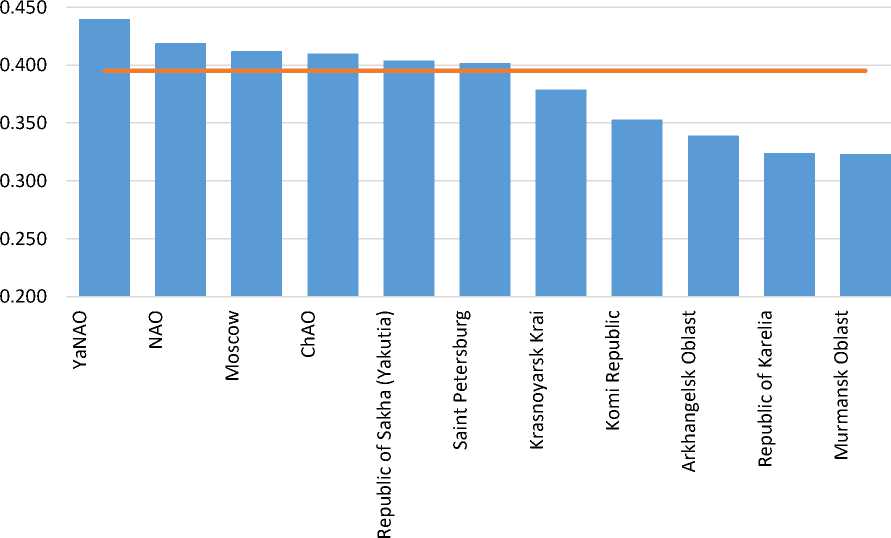
Analyzing the statistical value of the income concentration index allows understanding how great the income inequality is within the Arctic subjects.
^ш Average in the RF region ^^^nAverage in the RF
Fig. 4. Income concentration index, 2022
-
12 Compiled using data from the Rating of Regions. URL: https://riarating.ru/infografika/20231120/630252682.html;
;
(accessed 01 March 2024).
Figure 4 demonstrates the differences in the Gini coefficient value from the Russian average and from capital cities. Of all the Arctic subjects, only the autonomous okrugs and the Republic of Sakha (Yakutia) have Gini index values that exceed the Russian average and at the same time go beyond the optimal value of 0.4, albeit insignificantly. It is worth noting that over the 10-year period, the average Russian value of the income concentration index has decreased, as well as in the majority of the subjects of the Arctic zone of the Russian Federation, with the exception of the Chukotka and Yamalo-Nenets Autonomous okrugs and the Republic of Sakha (Yakutia).
The effectiveness of the social policy of the Russian Federation in relation to income redistribution can be demonstrated by the dynamics of changes in the poverty rate (Fig. 4).
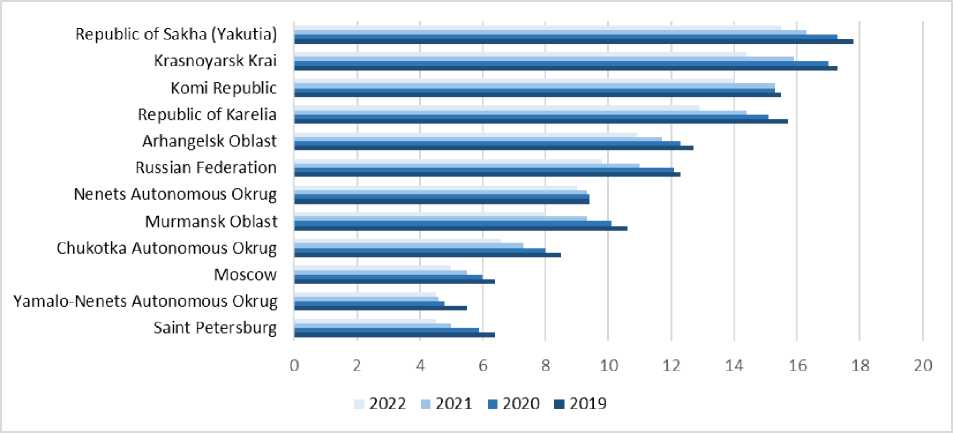
Republic of Sakha (Yakutia) Krasnoyarsk Krai
Komi Republic Republic of Karelia Arhangelsk Oblast Russian Federation
Nenets Autonomous Okrug Murmansk Oblast
Chukotka Autonomous Okrug Moscow
Yamalo-Nenets Autonomous Okrug Saint Petersburg
2022 ■ 2021 ■ 2020 И2019
Fig. 4. Poverty rate, as a percentage of the total population 14.
Over the period 2019–2022, there is a decrease in the value of this indicator in Russia and in its constituent entities, but only in 3 constituent entities of the Arctic zone the poverty level is lower than in the country as a whole, which should be reflected in the adjustment of regional policy.
It is worth noting that since 2021, the approach to determining the value of the subsistence rate has changed, which allowed bringing its value closer to its basic content. One of the options for assessing the quality of life of the working-age population is to estimate the ratio of wages and the subsistence rate (Table 3).
Table 3
Ibid.
Ibid.
Ratio of average wages and per capita income to the subsistence rate of the constituent entities of the Russian Federation 15
|
Ratio of the average monthly nominal gross wage to the subsistence rate |
Ratio of median average per capita income to the subsistence rate |
|||
|
2021 |
2022 |
2021 |
2022 |
|
13 Compiled on the basis of data of the Federal State Statistics Service. Gini coefficient (income concentration index)
|
Russian Federation |
4.9 |
4.7 |
2.6 |
2.5 |
|
Moscow |
6.2 |
6.1 |
3.6 |
3.6 |
|
Saint Petersburg |
6.4 |
6.0 |
3.6 |
3.5 |
|
Yamalo-Nenets Autonomous Okrug |
6.8 |
6.6 |
4.0 |
3.9 |
|
Chukotka Autonomous Okrug |
5.4 |
4.4 |
3.1 |
2.6 |
|
Nenets Autonomous Okrug |
4.3 |
4.2 |
2.8 |
2.8 |
|
Republic of Sakha (Yakutia) |
4.6 |
4.6 |
2.1 |
2.1 |
|
Krasnoyarsk Krai |
4.5 |
4.6 |
2.1 |
2.1 |
|
Komi Republic |
4.2 |
4.1 |
2.1 |
2.0 |
|
Arhangelsk Oblast |
4.2 |
4.0 |
2.2 |
2.1 |
|
Murmansk Oblast |
4.1 |
4.1 |
2.3 |
2.2 |
|
Republic of Karelia |
3.4 |
3.4 |
2.0 |
2.0 |
In world practice, the excess of wages over the subsistence rate is interpreted as follows: if this ratio is from 3 to 5 times, then the quality of life of the working-age population can be considered average, if it is above 5 — high [14, p. 19]. The analysis of Rosstat data demonstrates that only capital cities, the Yamalo-Nenets Autonomous Okrug and the Chukotka Autonomous Okrug (only in 2021) can meet a high quality of life, while the Republic of Karelia is at the lowest level of all Arctic subjects by this indicator. If we take the median average per capita income rather than wages as a basis for comparison, the ratio in most of the subjects of the Arctic zone of the Russian Federation is barely more than twice as high. This analysis once again confirms the thesis about the presence of regional income differentiation and at the same time refutes the assumption about the high level of income of the population of the Arctic territories.
Trends in regional income inequality in China
The problem of income inequality in China has become one of the central issues over the past two decades, especially against the backdrop of statistical indicators of the Gini coefficient, which rose from 0.317 in 1978 to 0.465 in 2019. According to the results of the National Bureau of Statistics in 2022, the per capita disposable income of the 20% of households with the highest incomes is 10.5 times higher than that of the 20% of households with the lowest incomes 16. The identified trends in regional inequality in China show clear group characteristics reflected in urban and rural populations, individual sectors of the manufacturing and non-manufacturing industries, as well as regional differentiation.
There is an increasing attention of experts comparing the growth rate of real income with the increasing income differentiation of the population in the Eastern, Central and Northeastern regions. Figure 5 and Table 4 present the distribution and growth rates of household disposable income by PRC regions. The largest developing economy demonstrates an increase in the disposable income of the population throughout the entire study period.
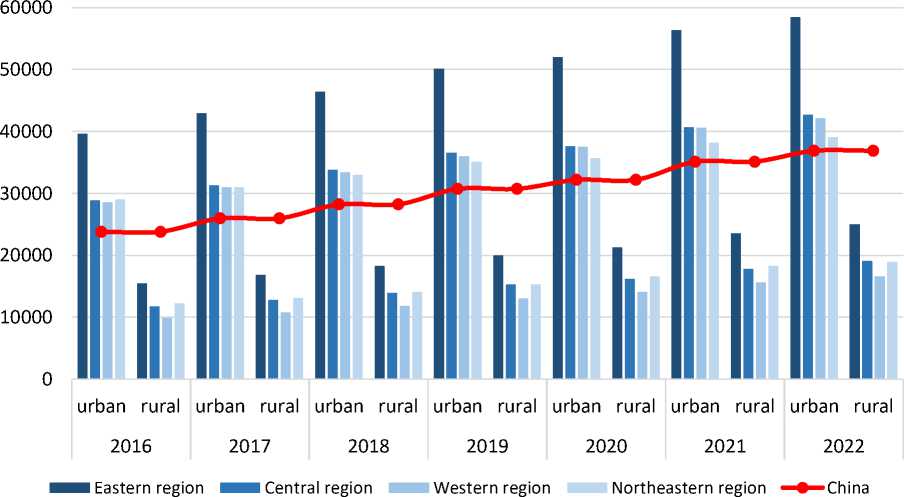
Fig. 5. Disposable income of urban and rural households per capita in the Eastern, Central, Western and Northeastern regions of China, RMB 17.
The following characteristics of inequality can be identified:
-
• the highest level of disposable income per capita is achieved in Eastern China, and the lowest — in the Northeastern China (urban population) and Western China (rural population);
-
• the disposable income level of the urban population in all areas exceeds the national average, while that of the rural population lags far behind;
-
• the gap in the income level of the urban population at a regional level increases from 1.36 in 2016 to 1.50 in 2022, and the gap in the rural population decreases from 1.56 in 2016 to 1.50 in 2022;
-
• low growth rates are observed in 2020 and 2022, except for the rural population in Northeast China;
-
• the growth rate of rural disposable income exceeds the growth rate of urban disposable income over 2016–2022;
-
• the highest growth rates are demonstrated by the income of the rural population in 2021 in all regions of China (10.1–10.7).
-
17 Compiled on the basis of China Statistical Yearbook 2023. URL: https://www.stats.gov.cn/sj/ndsj/2023/indexeh.htm
(accessed 02 March 2024).
Table 4
Growth rate of disposable income of rural and urban population in some regions of the PRC, percentage 18
|
Group |
2017 to 2016 |
2018 to 2017 |
2019 to 2018 |
2020 to 2019 |
2021 to 2020 |
2022 to 2021 |
|
Eastern region |
||||||
|
urban |
8.4 |
8.0 |
8.0 |
3.8 |
8.4 |
3.7 |
|
rural |
8.5 |
8.7 |
9.3 |
6.5 |
10.7 |
6.3 |
|
Central region |
||||||
|
urban |
8.4 |
8.0 |
8.3 |
2.9 |
8.1 |
5.0 |
|
rural |
8.6 |
9.0 |
9.6 |
6.0 |
10.1 |
6.8 |
|
Western region |
||||||
|
urban |
8.3 |
7.8 |
7.9 |
4.2 |
8.1 |
3.9 |
|
rural |
9.2 |
9.3 |
10.2 |
8.3 |
10.6 |
6.6 |
|
Northeastern region |
||||||
|
urban |
6.6 |
6.6 |
6.5 |
1.6 |
7.1 |
2.3 |
|
rural |
6.8 |
7.3 |
9.1 |
8.0 |
10.2 |
3.5 |
The reasons for increasing income inequality in different regions of China are explained by a number of factors [8, p. 158]:
-
• Resource:
-
- uneven settlement along the “north-south” axis due to internal migration;
-
- differences in the provision of natural resources;
-
- differences in experience of attracting and using foreign capital.
-
• Institutional:
-
- low minimum wages;
-
- loyal tax policy towards people with high incomes;
-
- restrictions on labor migration.
-
• Industry:
-
- immaturity of mechanisms for regulating the activities and pricing of natural monopolies;
-
- high monopoly profits in the fields of electricity, telecommunications and finance.
Institutional and industry factors can be eliminated or partially compensated by competent regional policy of the PRC.
Conclusion
The analysis allows identifying only one characteristic of social polarization — the stratification of society by income, and therefore requires further research. At the same time, it can be argued with a high degree of probability that sustainable rates of economic growth may be accompanied by increased social imbalance, which in turn becomes a barrier to further development.
-
18 Compiled on the basis of China Statistical Yearbook 2023. URL: https://www.stats.gov.cn/sj/ndsj/2023/indexeh.htm accessed 02 March 2024).
Analysis of the effectiveness of using territorial development tools should include an assessment of the degree of influence of social risks. There is no absolute equality between successful economic development and social stability of society. Issues of interconnectedness and interdependence of regional and social policies are subject to more serious study, especially for those regions that have specific characteristics and internal imbalances. Examples of such regions are the Arctic zone of the Russian Federation and Northeast China, where the analytical comparison of living standards leads to the need for continuous monitoring of changes in social processes. Monitoring of social risk protection of the territory as a feature of preserving its ability to continue to develop in the presence of external and internal negative impacts should become an obligatory element of regional policy. The more risk protection a socio-economic regional system possesses, the more viable it is. The main condition for sustainable regional development is not intensive rates of economic growth, but a high quality of life. Issues of reducing social polarization, social stratification, and social instability are a priority topic for the socially regulated development of territories in the global and regional dimensions.
The development of the social sphere in the ideology of a socially oriented economy should be carried out in the setting of simultaneous achievement of two goals:
-
• On the one hand, the elimination of income inequality and the development of the social potential of the territory, which is expressed in an increase in the degree of satisfaction of needs and real disposable (median) income of the population, as well as an increase in the value of the components of the human development index (healthy life expectancy and education).
-
• On the other hand, the elimination of inequality in opportunities, which is determined by the level and access to social benefits and services, as well as the provision of modern social infrastructure.
This goal-setting system, which forms the basis of strategic national and regional documents, can become an effective tool for motivating people to permanently reside and work in the northern territories.
References Social Polarization and Income Differentiation on the “North-Center” Axis
- Piketty T. Capital in the Twenty-First Century. Cambridge, The Belknap Press of Harvard University Press, 2014, 685 p.
- Panishchev A.L., Sapronov A.V. Factors of Social Polarization. Proceedings of the Southwest State University. Series: Economics, Sociology and Management, 2020, vol. 10, no. 1, pp. 178–185.
- Sapronov A.V., Abramov A.P. Social Polarization of Russian Society: The Dynamics of Inequality. Pro-ceedings of the Southwest State University. Series: Economics, Sociology and Management, 2017, vol. 7, no. 3(24), pp. 185–192.
- Il'icheva L.E., Lapin A.V. Tsennostnye i sotsial'nye determinanty ustoychivogo razvitiya rossiyskikh regionov v epokhu global'noy tsivilizatsionnoy deformatsii: monografiya [Value and Social Determi-nants of Sustainable Development of Russian Regions in the Era of Global Civilizational Defor-mation]. Moscow, Prospekt Publ., 2022, 344 p. (In Russ.)
- Kuzin V.Yu. Types of Polarization and Modern Features of Their Research. Bulletin of Udmurt Uni-versity. Series Biology. Earth Sciences, 2022, vol. 32, no. 4, pp. 494–503. DOI: https://doi.org/10.35634/2412-9518-2022-32-4-494-503
- Yan X., Mohd S. Trends and Causes of Regional Income Inequality in China. Sustainability, 2023, no. 15 (9), art. 7673. DOI: https://doi.org/10.3390/su15097673
- Gradín C., Wu B. Income and Consumption Inequality in China: A Comparative Approach with India. China Economic Review, 2020, vol. 62, art. 101463. DOI: https://doi.org/10.1016/j.chieco.2020.101463
- Li Z. Analysis of China's Income Inequality from the Perspective of Opportunity Inequality. In: Proc. 2021 3rd Intern. Conf. on Economic Management and Cultural Industry (ICEMCI 2021). Series: Ad-vances in Economics, Business and Management Research. 2021, vol. 203, pp. 156–160. DOI: https://doi.org/10.2991/assehr.k.211209.025
- Zhao S.X.B., Wong D.W. H., Shao C.H., Liu K.M. Rising Income and Wealth Inequality in China: Empir-ical Assessments and Theoretical Reflections. Journal of Contemporary China, 2024, vol. 33(147), pp. 544–559. DOI: https://doi.org/10.1080/10670564.2023.2172553
- Yawei Zhao. Polarized Cities: Portraits of Rich and Poor in Urban China. Eurasian Geography and Economics, 2021, vol. 62, iss. 1, pp. 115–117. DOI: https://doi.org/10.1080/15387216.2019.1705174
- Korchak Е.А. Threats to the Sustainable Development of the Russian Arctic: Poverty. Arktika i Sever [Arctic and North], 2020, no. 40, pp. 47–65. DOI: 10.37482/issn2221-2698.2020.40.47
- Skufina T.P., Samarina V.P., Baranov S.V., Bazhutova E.А. Socio-Demographic Processes in the Rus-sian Arctic in Statistical Assessments and Population Surveys. Arktika i Sever [Arctic and North], 2021, no. 45, pp. 127–149. DOI: 10.37482/issn2221-2698.2021.45.127
- Bogdanova E.N., Voronina L.V., Timushev E.N., Petrov E.Yu. The Market of Traditional Food Products of Indigenous Minorities of the European North of Russia: Big Data Analysis. Arktika i Sever [Arctic and North], 2023, no. 53, pp. 155–179. DOI: 10.37482/issn2221-2698.2023.53.155
- Menshikova O.I. The Level of Well-Being of the Working Population as a Concentrated Expression of the Quality of Working Life. The World of New Economy, 2020, vol. 14, no. 3, pp. 15–26. DOI: https://doi.org/10.26794/2220-6469-2020-14-3-15-26
