Software Evolution of Next.js and Angular

Author: Anika Tabassum, Ishrat Jahan Emu, Abdus Satter
Journal: International Journal of Engineering and Manufacturing @ijem
Article in issue: 4 vol.13, 2023.
Free access
Software evolution is the process of updating a software from it’s initial phase incorporating updates taken from the users. E-type software takes feedback and requirements from the users and updates the software accordingly. In the 70’s, Lehman proposed some laws of software evolution, which are still considered as the standards of measuring software evolution. Now-a-days, E-type softwares are getting very popular as users now use softwares by giving feedback. We are measuring Lehman’s laws of software evolution for two E-type softwares, Next.js and Angular. By downloading the source codes from github repositories, we analysed the source codes and evaluated if the softwares follow Lehman’s Laws of Software Evolution or not. This analysis completes the research which aims at measuring if the softwares evolve by maintaining Lehman’s Laws.
Software Evolution, Lehman’s Laws, Maintenance, Software Quality
Short address: https://sciup.org/15018703
IDR: 15018703 | DOI: 10.5815/ijem.2023.04.03
Text of the scientific article Software Evolution of Next.js and Angular
Software evolution refers to the modifications of a software system over time, performed by software maintenance. It studies how dynamic systems change over time. Software evolves with user requirements and feedback. There are three types of software, P-type, S-type and E-type software. Among them E-type software are the real world software which works with collecting feedback from users and updating the software as per the feedback. In recent years E-type software has gained popularity because of high usability. The more software is maintainable the more it is usable. Software evolution analyzes E-type systems to evaluate a system’s maintainability. If an E-type system is not adaptable, the users will lose interest using it which will cause failure to the software. To understand the evolution and maintainability of software, it needs to be analyzed properly. Lehman has proposed eight laws of software evolution to measure maintainability of the software.
E-type software is getting popular by users now-a-days. By users, we mean developers here. In this era of digitizing, almost every company has a website. Millions of developers are working to build website for various companies. In the process of web development, there are front-end development and beck-end development. There are several frameworks which are rated highly by the developers. Javascript has been a very popular language and been used for web development as well as web based teaching approach. [1] We chose two of those front-end framework named Next.js and Angular, written in Javascript. Both of them are open source, collects feedback from the users and update the software to get more usability. As they are popular from the start and still being highly used by the developers. Next.js is being used by popular tech giants like Uber, Netflix, Starbucks, we are interested in evaluating how well these systems are maintained.
As the high use of front-end frameworks, which are E-type software, this software should follow the laws of software evolution. We are trying to analyse the source code from the repository, Github, where the codes are kept.
Github is also used for getting feedback from the community. So by analysing github source code, we will connect the developers’ feedback with the update of the software systems and we will measure the laws given by Lehman. As the continuous growth of E-type softwares, we wanted to measure two E-type systems, Next.js and Angular to evaluate maintenance as per Lehman’s Law. No studies have been conducted so far on these two E-type software systems in this manner. Previous works have been done on measuring software evolution on linux kernel [2] using similar manner to ours. The details about the existing solutions in different areas are described in the next chapter.
The goal of software re-engineering is software maintainability. Software modifiability is crucial to software maintenance since it determines how simple it will be to remedy component problems and adapt to a new environment[3]. The objective of this research is to evaluate software maintenance by analysing the source codes. We hope to follow the working methodology of [2] and fulfil our research objective. For evaluating software maintenance, we extracted the source code of the systems from github and analysed the source code with software analysing tool. Then from the results of the tool, we plotted regression line to visualize if the systems follow the Lehman’s law or not.
After our evaluation we found that, Next.js follows all 6 laws that we are working with. But for Angular, it did not follow any of the laws of Lehman. This finding is surprising as Angular is a very popular and well accepted E-type software system. It is maintaining it’s popularity but not following the Lehman’s laws of software evolution.
In the next sections the related works, Case Study, the results and discussions are given.
2. Literature Review
Analysis of software evolution is one of the most well researched elements of software development and maintenance. This type of empirical study is considerably aided by the availability of multiple data in software repositories, which enables the investigation of research issues concerning all aspects of a software project, including its source code, documentation, developers, bug reports, and so on. Since the 1970s, software evolution has been a subject of research.
Lehman first defined three fundamental principles of software evolution in 1974 [4], based on his analysis of the OS/360 operating system. Lehman later updated the previous principles and proposed two new ones [5]. Lehman published a revised version of laws III, IV, and V [6] in the early 1980s. Lastly, Lehman produced a new edition of the statutes that included new provisions [7] and republished the most recent versions in 2006 [8]. The laws by Lehman introduced the softwares with some ground truth of evolution. These are the building blocks and have been used as starting point of measuring software evolution.
Many researchers have published their work by analysing different types of E-type systems. Some evaluated opensource mobile applications [9,10], some evaluated operating systems and browsers [11], some evaluated linux kernel system [12]. Many of those E-type systems abide by the Lehman’s laws of software evolution. Many could not proof all the laws because of not getting all the metrics to measure the laws. Likewise the literature, we will work but with a new E-type software system, front-end frameworks.
In the paper [9], Li et al. analysed some android applications and tried to measure software evolution like Zhang in [10]. This work is very relevant to ours but in a different field. Lone et al. analysed MacOS and LinuxOS and tried to evaluate operating systems. But as the worked with operating systems, they have used some other metrics than Lehman used in his ground study. They analysed monthly use, yearly use, cumulative use to figure out the growth of the operating systems and browsers. This study was a great kickstart for the analysis of that kind of softwares. In the paper [13] Newhook measured evolution of mobile application, but it was from design perspective. We tried to measure evolution from source code, so this literature was not so much aligned with ours. The authors of [14] worked with glibc and measured software evolution. This study was inspiring to analyse our work from using github repository.
But mostly, the evolution of linux kernel system [12] has been the most inspiring work for us. Though the systems we chose to analyse were not like linux kernel system, it was E-type software system and very fulfilled study on software evolution. So we followed the literature and incorporated with new E-type system softwares.
3. Methodology
This study aims to examine the changes and quality of the Next.js and Angular frameworks through time using Lehman’s laws of evolution. We followed the following steps to complete the study. Since we focused on changes between versions and their impact on quality, the remaining two laws were outside our scope. The processes we followed are –Making Research Questions, Data collection and processing and Statistical Analysis. We addressed the following research questions
-
A. Research Questions
In this research question, we want to identify if the quality of a software system gets worse over its lifecycle.
-
B. Data Collection and Preprocessing
For data collection we used github repositories. We used Next.js and Angular repositories of github*. We used python to code and fetched all the source code folders along with the source codes which are written in typescript mainly. There are also javascipt files which were also analysed. We downloaded the versions till 6th November, 2022. The repositories downloaded as zip file. So we extracted all the files and analysed it using understand tool** by scitools. It is a powerful static code analysis tool. Then we used these data for further statistical analysis. There have been many other studies conducted to using this tool to get the metrics by analysing the source codes. [15] used this tools to get metrics and got 96% accuracy in vulnerability detection. Study [16] also used this tool to analyse static code for finding bad code smells and achieved over 99% accuracy. All these studies have used the same metrics like Line of Codes, Cyclomatic Complexity etc. as ours. These metrics are used for further discussion using python libraries. So the data analysed to further metrics and for statistical analysis are reliable and accurate in this regard.
C. Statistical Analysis
4. Discussion
For statistical analysis, we used the data previously mentioned and plotted to find out trends in the releases. For example, we plotted number of files over versions to find out if number of files increases version wise. Likewise, line of code, cyclomatic complexity, number of releases, pre-releases etc. were all plotted against versions to do statistical analysis to find out if the systems follow Lehman’s laws or not.
-
A. Angular Release Trends
Angular is a component based framework built on typescript. It is used for web application development. Angular framework has components, templates, directives and dependency injection. Version numbers for Angular show the extent of changes made by the release. Three components make up an Angular version number: major.minor.patch. Version 6.4.13, for instance, denotes patch level 13, major version 6, and minor version 4.
From the documentation of Angular, [17] we can see that the levels of changes mean different things in Angular. Such as, the major releases contain major new features. The minor releases contain new but comparatively smaller features. They are fully backward compatible. The patch releases the patch releases are generally bug fix releases which have low risks. There are two types of pre-releases for each major and minor release. The “Next” releases are developing and testing actively. An example of a Next pre-release is 7.4.0-next.3. The release candidate means final testing is being done on the feature. An example of Release Candidate is 7.4.0-rc.3.
Angular follows the release cycle like the following- A major release is built every 6 months. For every major release, there are 1-3 minor releases. Weekly, a patch release and prerelease is built.
For our analysis, we will work with the stable versions and the pre-releases as well.
-
B. Next.js Release Trends
-
C. Lehman’s Law:
-
1) Continuing Change (1974): “An E-type system must be continually adapted, else it becomes progressively less satisfactory in use.” A software never dies if it is useful. The resources of the software are reused. To measure this, we need to measure the LOC and counting files. In Angular and Next.js, the changes are built in the pre-releases. So observing changes in line of code and number of files will help to find answers about continuing change.
-
2) Increasing Complexity (1974): “As an E-type system is changed its complexity increases and becomes more difficult to evolve unless work is done to maintain and reduce the complexity.” It is very hard to prove this law. If complexity increases it proves the initial part of the law. If complexity decreases, it proves the later part of the law. So, this law is hard to prove for java-script applications. Although, we provided the graph by plotting the cyclomatic complexity for all nested functions.
-
3) Self-Regulation (1974): “Global E-type system evolution if feedback regulated.” The growth trend should be observed. In some dataset, the growth trend had been different for major and minor releases. The incremental growth of any particular version by observing the number of files can be measured.
-
4) Conservation of organizational stability (invariant work rate) (1980): “The work rate of an organization evolving an E-type software system tends to be constant over the operational lifetime of that system or phases of that lifetime.” To measure this, we need to get data about the average man hour or number of developers. We want to measure the average effective global rate of activity. Although it is hard to get the number of developers, we can measure the number of releases per year which shows an indication of organizational stability.
-
5) Conservation of familiarity (1980): “In general, the incremental growth (growth rate trend) of E-type systems is constrained by the need to maintain familiarity”. This law says that, two subsequent releases has limited amount of change so that the users and the developers are familiar with the change. To measure this, line of code, number of files, cyclomatic complexity of per functions can be measured. To understand this law from the user’s perspective, we will only look into the stable versions because stable versions are intended for users. We will both look into the major and minor versions to understand if Angular and Next.js conserves familiarity or not.
-
6) Continuing growth (1980): “The functional capability of E-type systems must be continually enhanced to maintain user satisfaction over system lifetime.” Growth can be measured by the size of the software product. Software size of the product can be measured by calculating the number of modules and observing the trends. To measure the size metrics, we can measure Line of Code and number of functions in all directories. For Angular and Next.js we could not find any way to measure the functionality metrics.
-
7) Declining quality (1996): “Unless rigorously adapted and evolved to take into account changes in the operational environment, the quality of an E-type system will appear to be declining.” This law is related to the second law. Like the second it is hard to prove as measuring quality itself is hard. To observe the perceived quality, we need to focus on the user acceptance of the frameworks. If the frameworks are used by the users, then it shows that the quality is not declining. To observe the measured quality, the Maintainability Index is measured by measuring LOC, MCC and HV.
-
8) Feedback system (1974/1996): “E-type evolution processes are multi-level, multi-loop, multi-agent feedback systems.” Developers, managers and users are involved in the development system. The stability of growth models are helpful to measure the sizes accurately.
-
D. Evolution of the Next.js
In this section, we examine Lehman’s laws of software evolution in light of data corresponding to the evolution of the Next.js framework. In contrast, Lehman’s own research finds no evidence for these laws (Lehman et al., 1997, 1998a,b). Please take note that the laws are often numbered according to the year in which they were first enacted. Laws are rearranged here to follow a new sequence, with those closest to the code showing first.
-
• Law 1: Continuing change
According to this law, a program must be continuously modified to changes; otherwise, its performance degrades. Generally, it is difficult to distinguish between environmental adaptation and general growth (as expressed by the law of ongoing growth) (Lehman et al., 1998b).
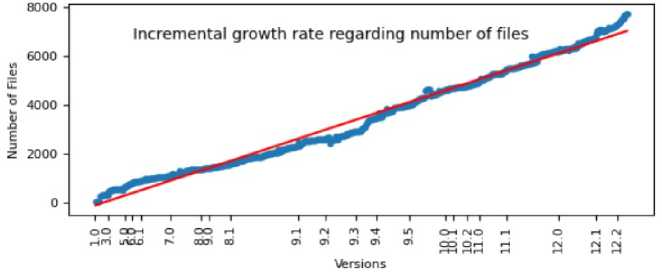
Fig. 1. The growth of number of files
Fig. 1 depicts a graph of how the number of files increases over versions. In the X-axis we plotted the versions from version 1.0.1 to version 12 and in the Y-axis number of files have been plotted. We fitted a regression line to understand the changes in the number of files over versions. As, Next.js started its journey from 2016, there are many releases over time. We found the coefficient as 6.22 and intercept as -111.55. As the coefficient value is positive, we can decide that, Next.js has linear growth over versions.
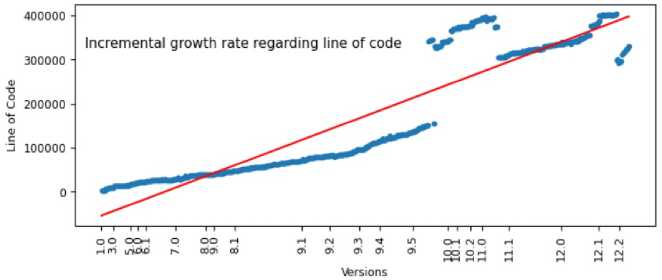
Fig. 2. The growth of number of line of Code
To do further analysis, we have plotted lines of codes over versions and found the same type of linear growth with coefficient value 394.42 and intercept value of -54598.69. (Fig. 2)We can therefore declare that the following program displays continual evolution and adaptation to its surroundings.
-
• Law 2: Increasing complexity
According to this law, the complexity of a program will rise as it evolves unless maintenance efforts are made to lower its complexity. Formally, this law is difficult to prove or reject since it allows for both trends: if complexity increases, it fits the basic assumption of the law, but if it decreases, it may be due to efforts to reduce complexity, thus also fitting the law. In addition, work on extending the system often entails effort on maintaining its maintainability, and the two cannot be separated in a practical sense (Lawrence, 1982). This rule is supported by Lehman’s rationalization (adding features and devices inevitably increases complexity (Lehman, 1980b)) and by data indicating that growth rates fall over time, as would be anticipated due to the limits of greater complexity (Lehman et al., 1997, 1998b).
Fig. 3 shows the linear growth of complexity per function with coefficient value of 185.4 and intercept value of -36319.43. In the X-axis we plotted the versions and in the Y-axis the number of cyclomatic complexity per function has been plotted. As the coefficient value is positive, it shows that cyclomatic complexity increases over time. From the figure, it is clear that at the very beginning the average cyclomatic complexity is increasing, then it decreases and increases too. It is natural because, after collecting the feedback there may be several functions which are complex to implement and increases cyclomatic complexity.
-
• Law 3: Self-regulation
This law states that the process of program evolution is self-regulating, resulting in a stable trend. Lehman finds evidence for this concept in the fact that empirical growth curves have a ripple superimposed on a continuous growth trend, and argues that the ripple illustrates the interaction between the opposing forces of desired growth and limited resources (Lehman et al., 1997, 1998b). The existence of self-regulation can be determined by observing growth trends, which indicate that deviations from a consistently smooth growth rate will be remedied. The Next.js dataset we utilize has significantly more releases than Lehman’s datasets.
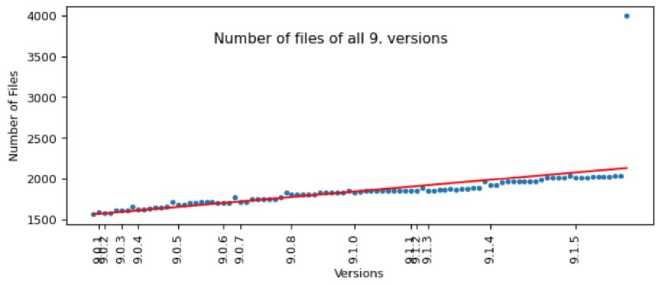
Fig. 4. Number of files all 9 versions
Fig. 4 depicts a graph of how the number of files increases over a year in stable releases of all 9 versions. In the X-axis we plotted the version number and in the Y-axis the number of files of all 9 versions have been plotted. We fitted a linear regression line to find out the relation. The coefficient value is 6.02 with an intercept of 1557, 53 which shows a positive relation between number of files and all the 9.X versions. Typically, the observed development patterns are relatively stable, however there are tiny fluctuations that can be characterized as ripples. Occasionally, though, they display bigger jumps as a result of incorporating an outside designed additional subsystem. The relatively smooth growth could be attributed to self-regulation, or it could be the result of a constant labor rate. The outcome is qualitatively comparable to Lehman’s findings, namely that the growth rate appears to oscillate about a mean and that relatively strong growth is almost always followed by sub-average growth, indicating an alternating between growth and stabilization. Consequently, our observations can be interpreted as indirect evidence for the existence of selfregulation.
-
• Law 4: Conservation of organizational stability (invariant work rate)
This law states that the average effective global rate of activity on an emerging system remains constant throughout the product’s lifespan. This statistic is technically troublesome due to the fact that we are attempting to evaluate “effort” on the project. It is difficult to obtain accurate information regarding man-hours or the number of
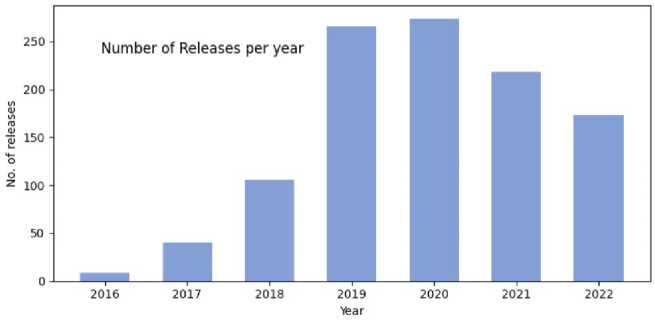
Fig. 5. Number of releases per year developers in closed-source systems, and even more difficult (and possibly ill-defined) in open-source initiatives. Furthermore, man-hours are frequently incorrect as a metric of work (Brooks, 1975). Lehman advocates using the number of items handled (that is, added, deleted, or modified) as a proxy, but notes that this, too, has methodological challenges (Lehman et al., 1998b).
Figure 5 depicts the number of an n ual releases f rom 2016 to 2 022. The hi g hest number o f releases is given in 2020.
Law 5: Conservation of familiarity
According to this regulation, the c h anges betwe e n successive releases are l imited so tha t both develo p ers and users can keep their knowledge with the code and the sys t em, respectively. Lehman et al. (1997) recommend e xamining the incremental growth; if it is steady or d ropping on a v erage, this shows that fa m iliarity is be i ng conserve d . In addition, they propos e a threshold that, if two or more consec u tive points s u rpass it, the s ubsequent p o ints should be near to zero or negative. Lawrence asserts that the s eries of grad u al changes he observed i n the examine d systems w a s random and takes this as evidence of a lack of cons e rvation (Law r ence, 1982).
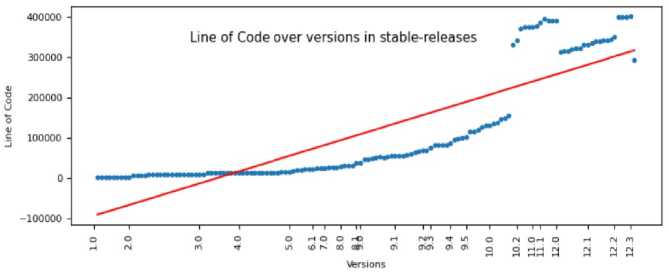
Fig. 6. Line of C ode in Stable Releases
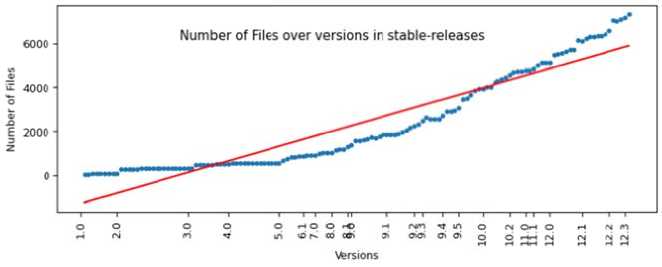
Fig. 7. Number of Functions in Stable Releases
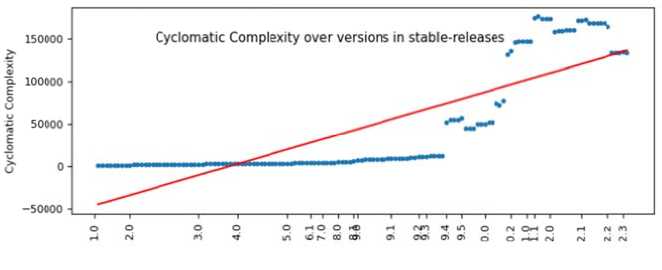
Fig. 8. Cyclomatic Complexity in Stable Release s
However, the maximum change t h at happened between sub s equent versi o ns may be a better test. W hen we look into the sta b le versions and analyze t h e line of co d e, cyclomatic complexit y and numbe r of files, we can see that, Next.js cons e rves the familiarity. In the case of num b er of files in the stable versions, we get the coefficie n t value of 51, 87 which is positive and shows positi v e relationshi p in number of files ad versions. For li n e of code a n d cyclomatic complexity w e got the coefficient valu e of 1972.99 and 1320, 71. As both of t hem are posi t ive, we can c onclude that, Next.js cons e rves the fifth law of Leh m an.
-
• Law 6: Continuing Growth
According to this concept, the fu n ctional conte n t of a progr a m must be c o ntinuously i n creased duri n g its lifetime in order to m aintain user satisfaction. ” G rowth” can a lso be interp r eted as referr i ng to the sof t ware product’s basic size.
In addi t ion, the size may be used a s a proxy for functional co n tent if it is a s sumed that a d ditional cod e is developed to support new features. Calculating s oftware size measures (s u ch as the n u mber of mo d ules) and ta b ulating their patterns over time can thereby validat e continued e x pansion. This was the strategy emplo y ed by Lehm a n and others. These open s ource projects collect fee d back from t h e users and incorporate th o se changes. T he changes a nd made and built on the p re-release versions. So by analysing ch a nges on thos e pre-release v ersions we c a n evaluate if the growth of the software s are continuing or not.
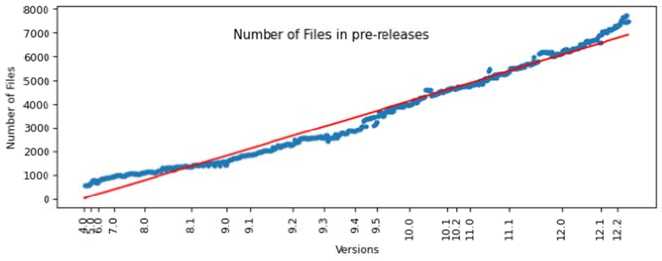
Fig. 9. Number of Files in Pre-releases
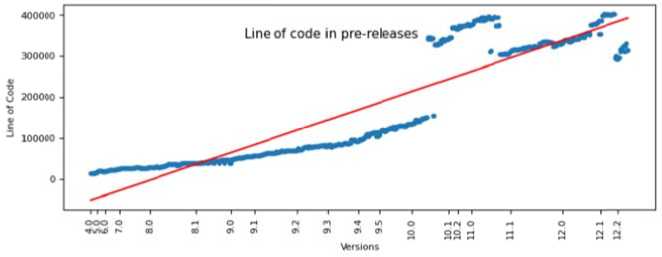
Fig. 10. Number of line of codes in Pre-releases
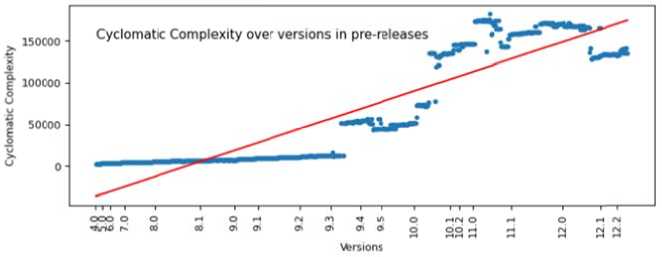
Fig. 11. Cyclomatic Complexity Over versions in Pre-releases
From figure 9, where we have fit t ed a linear r e gression line with numbe r of functions in pre-release, we can see that the coe f ficient value of number of files 6.6 whi c h is positive. So we can see continuin g growth in t h e prereleases. Likewise, w i th the coefficient value o f 201.87 and 4 24.32, we c a n see positive growth her e . So by anal y sing the prereleases, we can see that, it shows conti n uing growth.
-
E. Evolution of Angular
In this s ection, we investigate Leh m an’s rules o f software evolution using d ata that corr e sponds to th e development of the Angular framework.
-
• Law 1: Continuing Change
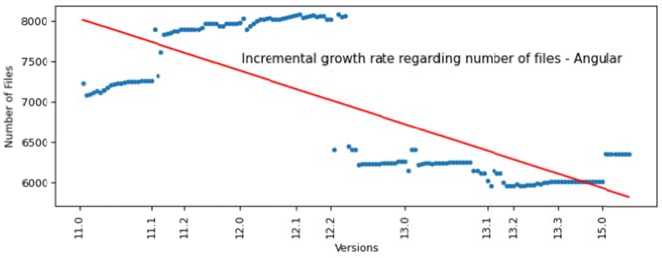
Fig. 12. Increm e ntal growth rate regarding numb e r of files – Ang u lar
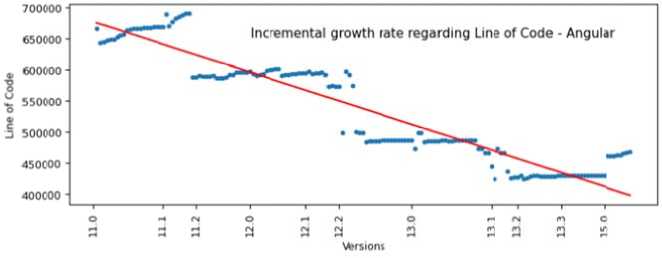
Fig. 13. Increm e ntal growth rate regarding Line of Code - Angula r
The graph in Figure 12 illustrate s how the n u mber of file s increases o v er time. On t he X-axis, w e plotted the versions from 11.0 to 15.0, and on th e Y-axis, we plotted the n umber of fil e s. To compr e hend the va r iations in the amount of fi l es across versions, a regre s sion line wa s fit. As of 2021, open source versions o f Angular wil l be available, resulting in numerous releases throug h out time. W e determined the coefficie n t to be -13. 6 0 while the intercept was 8022.42. Since the coefficient value i s negative, w e can conclude that An g ular’s versio n decline is linear. To do additional s t udy, we plotted lines of c ode over ve r sions and discovered a linear reducti o n with coef fi cient value -1722.16 and intercept value 677569.27 . (Fig. 13) W e can therefo r e conclude that the follow in g program i s incapable of showing continuous evolution and ada p tation to its e n vironment.
-
• Law 2: Self-regulation
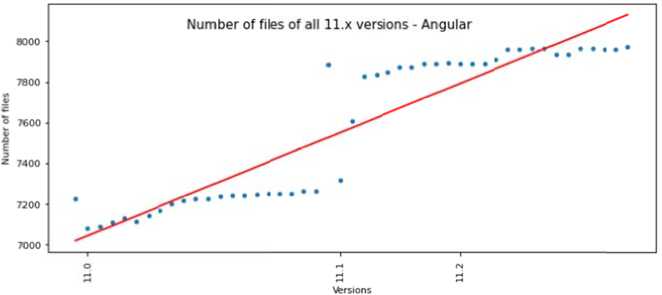
Fig. 14. Number of files of all 11.x versions - An g ular
The graph in Figure 14 demonst r ates how th e number of files in stabl e releases of all eleven v e rsions grows regularly. O n the X-axis, we plotted t h e version nu m ber, and on the Y-axis, w e plotted th e number of fi les for all 11 versions. We used linear regression t o identify th e connection. The coeffici e nt value is 2 4.18, and t h e intercept is 6994.91, indicating that there is a positive relations h ip between t he number o f files and al l 11.X versio n s. Generally, observable d evelopment patterns are v ery constant , however there are minu s cule change s that can be described as ripples. Occasionally, however, they e xhibit larger increases d u e to the inst a llation of a n externally d esigned extra subsystem. Self-regulation or a consist e nt labor rate may be responsible for th e growth’s rel a tive steadin e ss. The result is qualitativ e ly similar to Lehman’s fi n dings, namel y that the growth rate app e ars to oscill a te around a m ean and that particularly rapid growth is nearly always followed by sub-aver a ge growth, i n dicating an a lternation be t ween growth and stability. As a result, our findings c a n be interpr e ted as incidental evidence f or the existe n ce of self-re g ulation.
-
• Law 3: Conservation of organizational stability (invariant work rate)
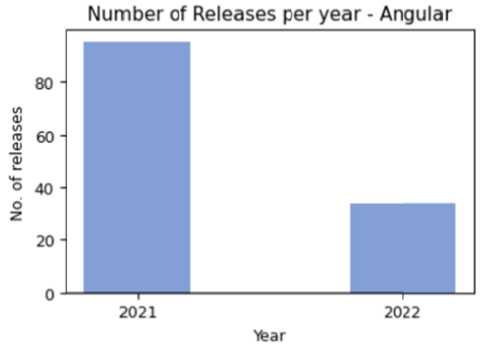
Fig. 15. Number of Releases per year - Angular
According to this law, the averag e effective o v erall rate of activity on a d eveloping s y stem will re m ain the same over the duration of the product’s lifec y cle. The tota l number of annual releases for the years 2021 and 20 2 2 is shown in Figure 14. T h e year 2021 is likely to se e the largest a mount of rel e ases.
-
• Law 4: Conservation of familiarity
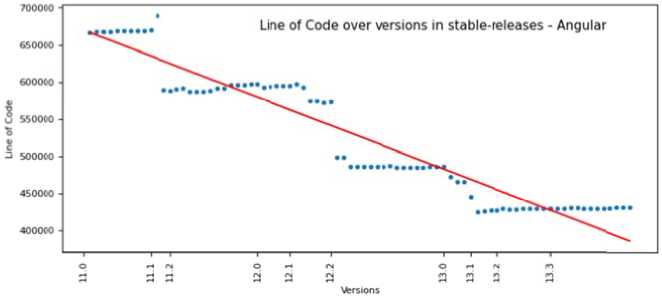
Fig. 16. Line of Code over versions in stable-rele a ses – Angular
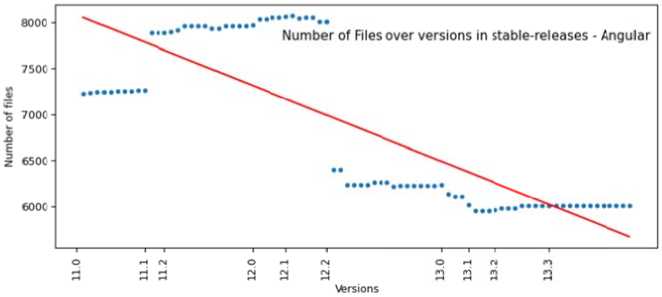
Fig. 17. Number of Files over versions in stable-releases – Angul a r
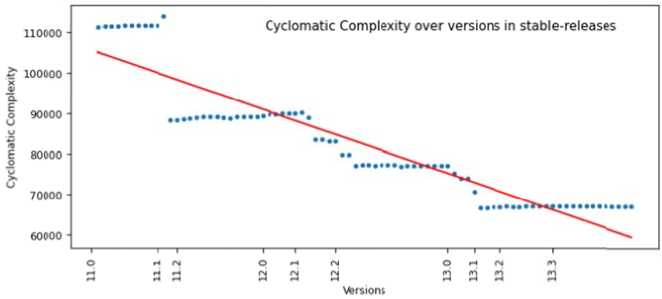
Fig. 18. Cyclomatic Complexity over versions in stable-releases
This la w limits changes between r eleases so de v elopers and users can preserve their c o de and syste m knowledge. Next.js preserves the familiarity when we analyz e the stable v ersions and evaluate the lines of code, cyclomatic complexity, and number of files. The coefficient v a lue for the number of fil e s in stable v e rsions is -2 9 .44, which is negative an d indicates a negative assoc i ation with t h e number of files in ad versions. The co e fficient values for lines of code and c y clomatic complexity wer e -3466.62 a n d -558.69. As both are n egative, we can conclud e that Next.js complies to Lehman’s fifth law.
-
• Law 5: Continuing growth
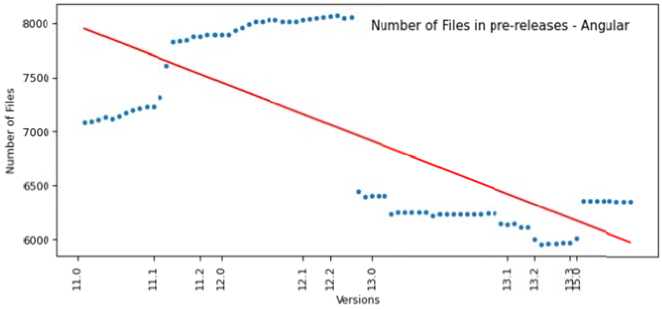
Fig. 19. Number of Files in pre-releases – Angul a r
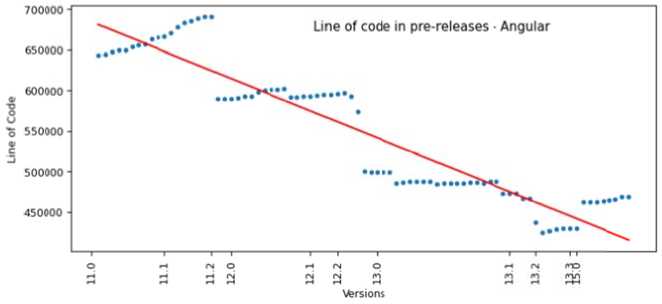
Fig. 20. Line of code in pre-releases – Angular
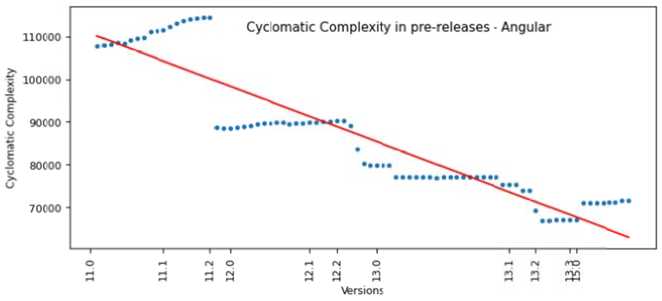
Fig. 21. Cyclomatic Complexity in pre-releases – Angular
The pr o gression of the growth in the amount o f files included in pre-rel e ases is show n graphically in Figure 19. We plotted t he versions along the X-a x is, and the n u mber of files that were i n cluded in pr e -release buil d s was shown along the Y- a xis. We fitted a regressio n line with the number of fi l es and found coefficient v a lue of -24.68 which shows a negative regression line. This means t hat Angular d oes not conserve the sixth law of conti nu ing growth. BY analysing the pre-releases, we can know that the n umber of fil e s is not incr e asing as the v ersion is im p roving. But t here can be a reason that, if the codes are being re-engineered, the r e may be fewer files in the following v er sions. But a s Lehman said, we cannot s a y that there is continuous g rowth in that software if the number of f iles is not in c reasing.
When w e investigate older versi o ns of the so f tware and e x amine the li n e of code, c y clomatic co m plexity, and number of fi les, we find that Angula r does not m a intain a lev e l of familiarity that is co n sistent across all of these metrics. For Line of Code and Cycloa m tic comple x ity Angular also showed n egative regr e ssion line w i th coefficient value of -558.19 and -3328.01 respecti v ely.
From t h is case study we can conc l ude that, Ne x t.js followed the six laws o f Lehman w e have analys e d. But to our surprise, we found out that, Angular d i d not follow the rules. He n ce it showe d total opposi t e characteris t ics. From the case study our findings say that, E-typ e software sys t ems tend to g row with ti m e (next.js). T h e developer s and software designers ne e d to keep in mind that w i th ever grow i ng files and c odes in the s oftware, mai n tainability o f the software becomes an i ssue. So to keep up with t h e continuou s evolution of E-type softw a re, dedicate d teams shoul d have budget for maintaining the software systems in the long run.
5. Conclusion
In the f ield of software engineeri n g, software e volution has been an im p ortant part. M any softwar e systems are being depric a ted for not keeping the p a ce with the r e al world. So to maintain t h e popularity of software, t here is a vast need for mai n taining the software syste m s as per the feedback of t h e developers and the teste r s.
Next.js and Angular are two of th e most popula r open source frameworks w orldwide. I n order to me e t the needs of their users, they have continued to evolve througho u t the past fe w years. In this paper, we t ried to meas u re how these types of open source E-type softwares maintain the Lehman’s l a ws of softwa r e evolution. This paper f o und out that, Next.js followed the laws. From the g r aphs and plo t s it is clear t hat, Next.js supported on g oing growth and continual change to su p port the laws.
Surprisingly, Angular being one o f the most p o pular front-end framewor k s, did not fo l low the law s that Lehman proposed. It showed total opposite beh a viour in the graphs. It di d not show pr o bable suppo r t for a const a nt work rate. When new p roduction versions are in t roduced, it a p pears that preservation o f familiarity i s coupled w i th significant modificatio n s. The tool that has been u sed to analyse the softwar e systems are not error-fre e . So there c a n be errors in analysing the software source-codes. A l so, some ver s ion of codes i s not availab l e.
So ther e was some slight gap in t h e data that h a ve been fetched from git h ub. As we m ade a surpris i ng finding of Angular not following the Lehman’s l a ws, in the fu t ure there ca n be further research with t h is front-end framework to analyse why this is not following the l a ws. Also wo r king with some other pop u lar front-end frameworks c an also be of a great path for further research.
This study works with two E-ty p e software s ystems. The findings of t he study su g gest that, E- t ype software systems foll o w Lehman’s Laws of soft w are evolutio n . Also in so f tware mainte n ance the res e arch contrib u tes greatly by giving an indication of the trends E-typ e software sy s tem follows. This work fo l lows the sim i lar methodol o gy of related works and is of great use for the softwa r e developers , designers and the team.
References Software Evolution of Next.js and Angular
- S. Bhatti, A. Dewani, S. Maqbool, and M. A. Memon, “A web based approach for teaching and learning programming concepts at middle school level.” International Journal of Modern Education & Computer Science, vol. 11, no. 4, 2019.
- Israeli, A. and Feitelson, D.G., 2010. The Linux kernel as a case study in software evolution. Journal of Systems and Software, 83(3), pp.485-501.
- I. C. Nwandu, J. N. Odii, E. C. Nwokorie, and S. A. Okolie, “Evaluation of software quality in test-driven development: A perspective of measurement and metrics.”
- M. M. Lehman, “The past, present, and future of software evolution, in: Proceedings of frontiers of software maintenance,” European Workshop on Software Process Technology, pp. 108– 124, 1996.
- M. M. Lehman, "Programs, life cycles, and laws of software evolution," in Proceedings of the IEEE, vol. 68, no. 9, pp. 1060-1076, Sept. 1980, doi: 10.1109/PROC.1980.11805.
- “Programs, life cycles, and laws of software evolution,” Proceedings of the IEEE, 1980.
- M. M. Lehman, “Laws of software evolution revisited,” European Workshop on Software Process Technology. , Berlin, Heidelberg, 1996.
- Lehman, M.M. (1978). Programs, Cities, Students— Limits to Growth?. In: Gries, D. (eds) Programming Methodology. Texts and Monographs in Computer Science. Springer, New York, NY.
- D. Li, B. Guo, Y. Shen, J. Li, and Y. Huang, “The evolution of open-source mobile applications: An empirical study,” Journal of software: Evolution and process, vol. 29, no. 7, p. e1855, 2017.
- J. Zhang, S. Sagar, and E. Shihab, “The evolution of mobile apps: An exploratory study,” in Proceedings of the 2013 International Workshop on Software Development Lifecycle for Mobile, 2013, pp. 1–8.
- M. I. Lone and Z. A. Wani, “Analysis of operating systems and browsers: A usage metrics.” Trends in Information Management, vol. 7, no. 2, 2011.
- M. W. Godfrey and D. M. German, “On the evolution of lehman’s laws,” Journal of Software: Evolution and Process, vol. 26, no. 7, pp. 613–619, 2014.
- Newhook, R., Jaramillo, D., Temple, J.G. and Duke, K.J., 2015. Evolution of the mobile enterprise app: A design perspective. Procedia Manufacturing, 3, pp.2026-2033.
- Gonzalez‐Barahona, J.M., Robles, G., Herraiz, I. and Ortega, F., 2014. Studying the laws of software evolution in a long‐lived FLOSS project. Journal of Software: Evolution and Process, 26(7), pp.589-612.
- Gupta, A., Suri, B., Kumar, V. and Jain, P., 2021. Extracting rules for vulnerabilities detection with static metrics using machine learning. International Journal of System Assurance Engineering and Management, 12, pp.65-76.
- Kim, D.K., 2017. Finding bad code smells with neural network models. International Journal of Electrical and Computer Engineering, 7(6), p.3613.
- “Angular versioning and releases,” https://angular.io/guide/releases, accessed: 2010-09-30.
