Spatial research of the labour reserve in the winery center of the Danube wine region (2014-2019)
")
Author: Jrdny Krisztin, Gyri Tmea
Journal: Региональная экономика. Юг России @re-volsu
Section: Фундаментальные исследования пространственной экономики
Article in issue: 4 т.9, 2021.
Free access
In Hungary, the positive impact of the wine sector on rural areas has encouraged Hungarian and EU policy makers to provide significant development support to wineries. One of the main objectives of the support was to increase employment in rural areas. In the period 2014-2019, nearly €60 million was awarded to support the development of wine businesses in Hungary. The aim of our research is to examine how labour supply in the Danube wine region, Hungary’s largest wine region, has changed over the period covered by the wine sector development aid. We analysed the spatial distribution and concentration of several groups of potential labour supply in the study area. The Dual-index and the Hoover-index were used to measure spatial disparities. To measure the spatial concentration of jobseekers, we calculated the location quotient and then examined the spatial pattern of the resulting municipality-level concentration values using the Local Moran I statistic, a local test function of spatial autocorrelation. As a result of our research, we identified the spatial specificities of the potential labour pool available in the study area. The results are useful for business decision-makers planning to expand or reorganise their human resources. In addition, knowledge of the characteristics of the available potential workforce will support the definition of future development directions, in particular with regard to human resource expansion.
Donau wine region, unemployed, spatial inequality, location quotient, spatial autocorrelation, interpolation, labour market, labour supply, hoover index, winery, viticulture
Short address: https://sciup.org/149139588
IDR: 149139588 | UDC: 331.1 | DOI: 10.15688/re.volsu.2021.4.11
Пространственное исследование трудовых резервов в центре Дунайского винодельческого региона (2014-2019 гг.)
В Венгрии положительное влияние винодельческой отрасли на развитие сельских территорий стимулировало власти ЕС предоставить серьезные меры поддержки местным виноделам. Одной из целей поддержки стало увеличение занятости в сельских регионах. В период с 2014 по 2019 г. почти 60 млн евро было выделено для поддержки винодельческого бизнеса в Венгрии. Целью исследования является изучение того, как предложение труда в винодельческом регионе Дуная, который является крупнейшим регионом этой отрасли, изменилось в течение периода предоставления государственной поддержки предпринимателям, занимающимся производством вина. Авторами проанализированы пространственное распределение и концентрация нескольких потенциальных групп трудовых ресурсов в данной местности. Для оценки пространственного неравенства был использован Дуальный индекс и индекс Гувера. Для измерения пространственной концентрации безработных был использован коэффициент локализации, а затем была апробирована пространственная модель распределения показателей по муниципалитетам с использованием метода локальной статистики Морана, который представляет собой анализ пространственной автокорреляции региона. В результате проведенного исследования были выявлены пространственные особенности потенциальной концентрации трудовых ресурсов, доступных в анализируемом регионе. Результаты исследования могут представлять практический интерес для руководителей регионов, планирующих расширять или перераспределять имеющиеся трудовые ресурсы. Кроме того, обладание информацией о потенциально доступных трудовых ресурсах поможет определить перспективные направления развития с целью расширенного воспроизводства человеческого капитала.
Text of the scientific article Spatial research of the labour reserve in the winery center of the Danube wine region (2014-2019)
DOI:
The wine-drinking culture of Europeans can be traced back many centuries [Kispál, 2017], and this tradition is deeply embedded in the cultural circle of Hungary. Today, the grape and wine sector in Hungary has grown into an important factor in the agricultural economy, considering that it accounts for 2.6% of the gross national product of Hungarian agriculture [Gál, 2020]. There are currently 6 wine regions in Hungary, consisting of 22 winelands. The winelands are a set of production areas with plantations with similar climatic, topographical, soil conditions, characteristic varietal compositions and operations, their own viticulture and wine making traditions and from which their unique wine products are derived. Wine regions are voluntary corporations set up to promote the common interests of winelands and to protect the origin of the grape’s quality and origin of the products they produce, consisting of a number of wine regions with similar wine-growing traditions, which are geographically close to each other or bordering each other.
According to the statistical data of the National Council of Wine Communities Hungary (CWC), the total area planted with grapes in the wine regions of Hungary averaged 64,395 hectares between 2014 and 2019, of which an average of 91.62% was a productive plantation. The average volume of grapes harvested was nearly 4 million glazes, while the average volume of wine made from it was 2.67 million hectolitres.
In addition to good local conditions, the presence of the wine sector in areas with the right wine-making technology and culture can be a serious endogenous resource. This is largely due to the fact that the success of viticulture and oenology in the narrow sense has a serious impact on the sectors that build on it in whole or in part (e.g., tourism, trade) or support sectors (e.g., technology, research, etc.) and their benefits show significantly in the economy of rural areas. The development of the untapped potentials of the wine sector, due to their multiplier effect, can be decisive in the local and regional economic development processes and strategies of the areas affected by this activity, as well as in the development of their more profitable economic structure in the long run [Járdány, 2021].
Despite good production conditions, Hungarian winemakers have to deal with the same difficulties as their European Union counterparts, mainly with constant sales difficulties, intensifying market competition and the structural crisis of wine overproduction. In any case, this will encourage stakeholders in the wine sector to appear with higher value-added wines at the right price / value ratio, targeting several market channels [Sidlovits, 2008].
One of the most important aspects of meeting the challenges is to produce high quality products that can only be achieved with a high level of technology. Improving the quality of food products has also been encouraged by the European Union’s Common Agricultural Policy (CAP) since its 1992 reform [Meloni, Swinnen, 2013]. State-of-the-art oenological technology makes it possible to increase the specific income from wine production, increase efficiency, reduce adverse effects on the environment and increase market security in a sustainable way. However, technological innovation is in many cases not possible due to the lack of resources of the market players involved, so public budget intervention may be needed to achieve sectoral goals.
Sectoral developments and the resulting spatial development interventions can be planned in two basic approaches to regional resources. In one case, we are filling in the missing resources from the outside, ie we are giving significant subsidies for the developments there. In the other case, we seek to explore the area’s own resources and try to make the best use of these resources with the help of local actors. The correct solution is to apply the optimal combination of these two logics to the given area [Juhász, 2020]. In many cases, without government intervention, economic performance is lower than optimal for society [Keszthelyi, 2019].
The development of the wine sector is encouraged by both the European Union and Hungarian policy. According to the data of the Hungarian State Treasury (HST), between 2014 and 2019, Hungarian wineries received a total of HUF 20.86 billion (approximately EUR 60 million) in technological development support. 14.24% of the support went to the wineries of the largest wine region of Hungary, the Danube wine region.
The priority objective of the grants is to increase competitiveness and create jobs in the areas concerned. The quantity and quality of the available workforce can be considered as an endogenous factor, therefore the analysis of its composition is justified when examining competitiveness. One of the basic indicators of the labour market situation is unemployment, which is an important element in the examination of social and economic spatial structure [Hajdú, 2020]. Unemployment must be interpreted as a social spatial structure indicator on the one hand as a proportion of the unemployed, and on the other hand, as a potential labour reserve from the perspective of economic spatial structure analyses [Győri, Egri, 2020]. The potential labour reserve consists of the unemployed, the underemployed and the inactive [Káposzta, 2016]. According to the data of the Hungarian Central Statistical Office (CSO), in the first half of 2019 approximately 51% of the labour force reserve was unemployed, 40% inactive and 9% underemployed. According to the data of the National Employment Service (NES), the average monthly number of registered jobseekers in Hungary in 2019 was 252,550. Of these, 43.2% had 8 primary or lower education degrees, 25.2% had a vocational or vocational school certificate, 25.4% had a secondary education degree and 6.2% had a tertiary education degree. Their relative ratio to the active age population was 5.4% nationwide, a significant decrease of 4.2% compared to 2014.
Objective of research
Unemployment has been declining in Hungary over the last 10 years. One of the biggest challenges for employment expansion projects is the mobilization and long-term use of the right quantity and quality of human resources. Although the problem is common, these difficulties arise in different structures in different spatial units of Hungary.
In our study, we sought to answer the question of how the spatial structure of the potential labour reserve in the wine centre area of the Danube wine region and its catchment area changed according to the main human resource characteristics. The research does not primarily analyse the nominal development of the available workforce, but focuses on its territorial differences and discusses the topic in this context. The issue is topical and relevant for the wineries located in the study area, as they have human resource expansion obligations related to their development projects.
Material and methods
The examined area is the Danube wine region (11231 km2) located in the Great Plain. The vast majority of its territory is in the Southern Great Plain region, a smaller part in the Central Hungarian region. The wine region consists of 3 Great Plain winelands: the Csongárd wine land, the Hajós-Baja wine land and the Kunság wine land (Fig. 1).
According to the data of the National Council of the Wine Communities Hungary (NCWC) in 2019, 36.5% (23874 ha) of Hungary’s wine-growing areas are located in this wine region. Between 2014 and 2019, the average yield of wine grapes in the Danube wine region was 182.129 tons, while its wine yield was 1,416,020 hectolitres, which was 43.41% of the total Hungarian average grape yield and 49.34% of the total Hungarian wine yield. 28.81% (2130 units) of all wineries with a registered winemaking license in Hungary are located in the region [Járdány, 2021]. With these values, the Danube wine region is considered to be the largest viticulture and wine delimitation in Hungary.
During the preparation of the study, the emphasis was basically on the analysis of statistical data collected from secondary sources. The
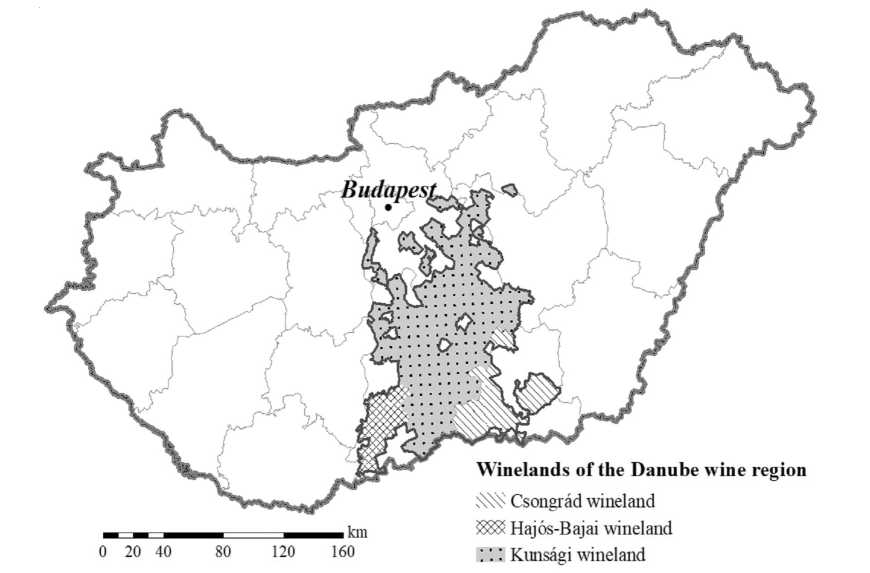
Fig. 1. The Danube wine region
Note. Source: Own editing.
settlement-level data of the wineries were collected from the database of the Pest County Government Office (PCGO). The settlement-level data of the population and the registered unemployed in 2014 and 2019 were provided by the data files of the Central Statistical Office (CSO), the National Spatial Development and Spatial Planning Information System, and the National Employment Service. Registered jobseekers were categorized according to their age and education. We performed our calculations for these categories. For their annual headcount data, we took into account the annual average of the quarterly data.
To identify the wine centre area of the Danube wine region, we performed Getis-Ord local Gi statistics [Getis, Getis, 1996]. The local approach sheds light on the local peculiarities of spatial structures [Bálint, 2011]. Local Gi statistics identify the strength of spatial association with the concentration of weighted spatial points [Tóth, 2014], the higher the Z value, the more intense the clustering of high values. If the values above the average within the given distance are condensed, the value of Gi will be high, in case of the concentration of low values it will be low [Bálint, 2011]. The statistic contains a symmetric spatial weight matrix, the elements of which can take binary (0,1) values. The values of the elements within the distance (d) defined by us are 1, in all other cases they take the value 0.
According to this type of indicator, the given location is adjacent to itself, the value in the weight matrix is 1. The local version of the Getis – Ord statistic can be calculated using formula number 1:
Gi(d)
lj=iwij№xj ^=1^
where w ij is the symmetric spatial weight matrix, d is the distance, x is the spatial criterion and it is true that i = j . Clusters were created by distance-based weighting (15 km), and the number of wineries was indicated as the aggregation variable.
The hot-spot analysis of the number of wineries was performed using a deterministic modelling approach. In the framework of our research, we sought the answer to the question of the area affected by the dosimetric extent of the hot-spot wineries in the Danube wine region. The spatial extent of the winemaking hotspot of the Danube wine region was examined by interpolation of the Z values of the hotspots obtained on the point map. The interpolation procedure is widely used in the sciences dealing with spatial data [Meng, Liu, Borders, 2013].
Spatial interpolation is based on the hypothesis that points in space that are close to each other are more likely to have similar values than points that are far apart [Tobler, 1970]. The spatial extension of the hotspot area was also justified by two features of the spatial geometric arrangement of the studied area:
-
1) in the territory of the Danube wine region there are several settlements belonging to the enclave that do not belong to the territory of the wine region (Bugacpusztaháza, Dunatetétlen, Városföld, Újsolt, Dunaegyháza);
-
2) the spatial extent of the area delimited by the Danube wine region forms a concave polygon at several points.
To construct our model, we used the inverse distance weighted interpolation (IDW) method, where the weight changes in inverse proportion to the distance. The result of the interpolation is essentially the weighted arithmetic mean of the values of the surrounding points [Bartier, Keller, 1996]. By default, bilinear interpolation was used to calculate display pixels. The GIS representation was reported on a raster cartogram.
The spatial polarization of certain groups of the unemployed was evaluated with a Dual index, the differences of their spatial distribution with the Hoover index, and their spatial concentration were evaluated using the location quotient. These inequality indicators determine the extent of spatial differences regardless of the spatial location of the data.
The Dual Index (formula 2) is the ratio of the mean of the values above the mean of the entire distribution to the mean of the values below the mean of the entire distribution.
where X is the arithmetic mean of x i , x a is the arithmetic mean of x i values greater than X , and x m is the arithmetic mean of xi values less than X .
The Hoover index is a frequently used distribution-type indicator [Kiss, Németh, 2006]. In this study, the indicator was used to measure the spatial distribution of each group of unemployed and the total number of unemployed in the study area using formula 3.
lx-f l
^ , (3)
where x i and f i are the two distribution ratios for which it is true that i and Hfi = 100.
From the methodological procedures applicable during the examination of the spatial structure, the location quotient was selected, which can be well applied to the examination of the Hungarian regions. The selected statistical indicator expresses whether the proportion of the unemployed belonging to a given group in a given settlement is under-represented or over-represented compared to the county average of the given group. In the research, we mapped the groups with a dominant weight within the registered job seekers. The indicator was calculated on the basis of the number of registered unemployed in the categories by education and age group. The registered jobseekers were divided into three age groups, thus forming groups under 24 years of age, 25–54 years of age and over 55 years of age. According to education, we also distinguished three groups: those with primary, secondary and tertiary education. The values of the location quotient were interpreted according to the following scale: there is no concentration below 1, moderately concentrated between 1.00–1.25, moderately concentrated between 1.25–1.50 and strongly concentrated above 1.50 [Győri, Egri, 2020]. The indicator expresses the regional distribution of the selected criterion according to formula 4.
UNEi / UNE , where UNEi,j number of unemployed in group i in settlement j, UNEj number of unemployed in j settlements, UNEi number of unemployed in group i, UNE total number of unemployed.
Using the computed LQ values, a global Moran I statistical analysis was performed to explore the spatial correlation scheme using formula 5.
I M SiLlSysl^ijCyi-У)(У;—У) , (5)
, (5)
where n is the number of area units, y i and y j are the values of the examined variable in each area unit, У is the arithmetic mean of the examined indicator, A is the number of neighbourhood relationships, and the value of the coefficient δ ij is 1 if i and j are contiguous, otherwise 0. The n indicates the number of items [Tóth, 2014]. If I > -1/ n -1, then the autocorrelation relationship is positive, if I < -1/ n -1, then the autocorrelation relationship is negative. If I = -1/ n -1, there is no autocorrelation relationship between the individual territorial units [Egri, 2017]. The obtained I values should be standardized so that the distorting effects can be better filtered out [Kincses et al., 2013]. By standardizing the I value, the Z value is obtained. According to the basic assumption (null hypothesis), there is no spatial autocorrelation between the studied variables, their spatial arrangement is random.
In our study, we used queen neighbourhood weight matrices to operationalize neighbourhood relations with a permutation number of 999. Based on the obtained Global Moran I values; we identified the unemployed groups where we experienced clustering in territory.
To describe the spatial patterns, we used the local test function for spatial autocorrelation, the univariate Local Moran I method developed by Anselin in 1995. This method is suitable for detecting areas that are similar to or different from their neighbours [Tóth, 2014]. The Local Moran I was calculated using formula 6.
h,t = zi,tHi^ijzj,t , (6)
where zi,t and zj,t are the standardized values of the observation units at time t . For a univariate Local Moran, zi,t , and zj,t refer to the same database. Wij is the area weight matrix [Anselin, 1995]. The obtained result classifies the settlements into four groups:
-
1. High to high (HH): high value territorial units for which the neighbourhood also has a high value.
-
2. High-low (HL): units with a high value for which the neighbourhood has a low value.
-
3. Low-low (LL): low value area units where the neighbourhood also has a low value.
-
4. Low – high (LH): territorial units with a low value, in which case the neighbourhood has a high value [Tóth, 2014; Egri, 2017].
Spatial statistical analyses and the display of the results on cartograms were performed using ArcGIS 10.8 and Geoda 1.16 GIS software.
Results
The winemaking centre of the Danube wine region was identified by a spatial autocorrelation analysis of the spatial location of the wineries located in the area. Getis-Ord spatial autocorrelation analysis clearly showed a wine-making hot spot for settlements in the western areas of the horizontal centre line of Bács-Kiskun county. The 15 km dosimetric extent of the obtained Z values affected all the districts of the county in the eastern direction, while extending westwards beyond the border of the wine region to the administrative border area of the county (Fig. 2) 85.2% of all wineries in the Danube wine region are in the identified hotspot. Within the hotspot, we identified a centre area covering 12 settlements (Z-score > 10) in the area covered by the settlements of Kiskőrös – Soltvadkert – Kecel – Akasztó – Csengőd, where 80.17% of the hotspot wineries are grouped. The area of the excavated hotspot is 1495.2 km2, which is 13.31% of the area of the Danube wine region. The area of the centre zone within the hotspot is 804.31 km2, which is 7.16% of the wine region and 53.79% of the hotspot area.
Between 2014 and 2019, 71.75% of the wine farm development support funds for the Danube wine region went to the hotspot settlements, while 56.9% went to the central zone. Given that the expansion of employment related to the supported projects is expected to be most pronounced in this
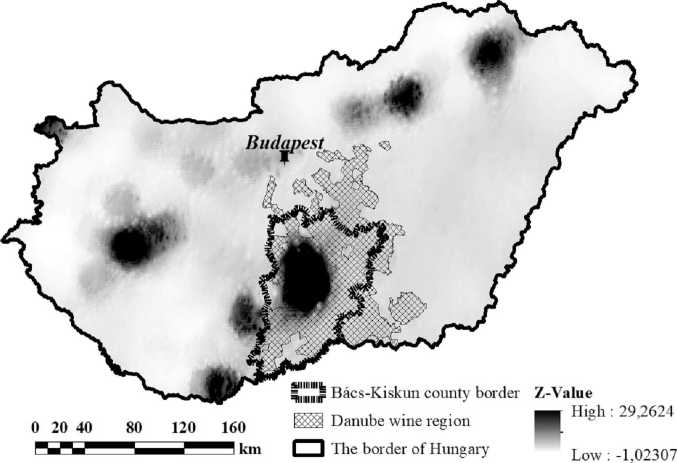
Fig. 2. Wineries hotspots in Hungary
Note. Source: Own calculating and editing based on PCGO data.
area, we extended our research on labour reserve to the area of the hotspot-affected districts, thus to Bács-Kiskun county. The county seat of Bács-Kiskun county is Kecskemét, and the second most populous city is Baja.
The permanent population of the examined county decreased by 2.06% between 2014 and 2019, by a total of 10 927 people. In the hotspot area, the population decline exceeded the county value, in the hotspot the population decline was 2.12%. The number of jobseekers decreased by 50.14% at the county level during the period under review, while it decreased to a lesser extent by 44.98% in the hotspot. In terms of age, the number of jobseekers aged 0–24 in the county decreased the most by 60.37%, followed by the number of jobseekers aged 25–54 by 55.89%, and finally the number of jobseekers over the age of 54 by 13.62%. In the hotspot area, the number of jobseekers aged 25–54 decreased by 61.08%, the number of jobseekers aged 0–24 by 55.46% and the number of jobseekers over 54 by 29.47%.
In terms of educational attainment, the number of primary and secondary jobseekers at the county level decreased by almost the same proportion, by 51.90% and 50.12%, respectively, while in the case of those with tertiary education it decreased by 29.39%. In the hotspot, the number of jobseekers with a primary education decreased by 58.47%, the number of those with a secondary education by 53.28%, and the number of people with a higher education by 35.53%.
In the examined period, the regional differences in the distribution of the unemployed in Bács-Kiskun county were revealed with the help of the Dual index and the Hoover index (Table 1).
Based on the values of the territorial inequality indicators, the territorial differences in the distribution of the unemployed increased in 5 cases out of 6 categories in the examined period. Only those over 55 years of age showed a slight decrease. In both years studied, the regional differences of the unemployed with higher education are the most significant. In 2019, 29.58% of graduate unemployed should have been redeployed to have an even territorial distribution. Territorially, the middle-aged group is the most balanced in 2019, with the Hoover index at just 4.15%. Taking all categories into account, the distribution of the unemployed with a middle-aged, secondary education is the most even.
Global Moran I statistics were also performed for the 2014 and 2019 settlement-level headcount data and concentration (LQ) of the unemployed. The obtained I, Z and significance (Sig.) Values as well as information on clustering are shown in Table 2. The autocorrelation performed on the raw headcount data did not give a significant value in any of the groups (p < 0.05), the results achieved in 2014 and 2019 did not indicate clustering for this indicator. The formulated null hypothesis was accepted for the spatial autocorrelation of the raw data, the spatial pattern of each group was random.
Spatial autocorrelation statistics performed on the LQ values of the unemployed calculated at the settlement level gave different results from the headcount data (Table 3). Global Moran I values in 2014 indicated clustering for three groups. The primary and secondary groups indicated clustering at a 1% confidence interval, while the under-24 age group indicated clustering at a 90% confidence interval. However, the latter was not considered because a p value above 5% was not considered significant in the study. For the other groups, the null hypothesis was accepted.
The spatial pattern of the unemployed groups was also examined with the local test function of the spatial autocorrelation, the Local Moran I statistics. We created a LISA map for the groups for which the following conditions were met:
-
1) the result of the Global Moran I statistics indicates the presence of clustering;
-
2) Z value is greater than 2;
3)the results obtained are significant at a minimum p < 0.05 level.
Table 1
Dual and Hoover indexes of unemployment categories
|
Groups |
Dual index |
Hoover index (%) |
||
|
2014 |
2019 |
2014 |
2019 |
|
|
Primary education |
6,85 |
8,73 |
10,47 |
11,75 |
|
Secondary education |
8,78 |
9,01 |
6,27 |
6,50 |
|
Higher education |
21,22 |
23,78 |
29,37 |
29,58 |
|
24 |
7,43 |
10,11 |
6,71 |
9,08 |
|
25–54 |
8,12 |
10,00 |
2,29 |
4,15 |
|
55 < |
7,44 |
7,42 |
9,21 |
9,14 |
Note. Source. Own calculation based on NES data.
Table 2
Global Moran I indices calculated on the number of unemployed
|
Groups |
Moran I |
P value |
Z-score |
Pattern |
|
2014 |
||||
|
24 |
-0,050 |
0,254 |
-1,139 |
Random |
|
25–54 |
-0,039 |
0,378 |
-0,881 |
Random |
|
55 |
-0,061 |
0,163 |
-1,395 |
Random |
|
Primary education |
-0,028 |
0,663 |
-0,435 |
Random |
|
Secondary education |
-0,077 |
0,101 |
-1,644 |
Random |
|
Higher education |
-0,036 |
0,299 |
-1,038 |
Random |
|
2019 |
||||
|
24 |
-0,055 |
0,245 |
-1,163 |
Random |
|
25–54 |
-0,068 |
0,141 |
-1,473 |
Random |
|
55 |
-0,075 |
0,110 |
-1,597 |
Random |
|
Primary education |
-0,060 |
0,232 |
-1,196 |
Random |
|
Secondary education |
0,069 |
0,136 |
-1,489 |
Random |
|
Higher education |
-0,042 |
0,301 |
-1,034 |
Random |
Note. Source. Own calculation based on NES data.
Table 3
Global Moran I indices calculated on the LQ values of the unemployed
|
Groups |
Moran I |
P value |
Z-score |
Pattern |
|
2014 |
||||
|
< 24 |
0,089 |
0,080 |
1,751 |
Clustered |
|
25–54 |
-0,075 |
0,232 |
-1,194 |
Random |
|
55 |
0,062 |
0,202 |
1,274 |
Random |
|
Primary education |
0,144 |
0,006 |
2,734 |
Clustered |
|
Secondary education |
0,136 |
0,009 |
2,599 |
Clustered |
|
Higher education |
0,009 |
0,755 |
0,312 |
Random |
|
2019 |
||||
|
< 24 |
0,092 |
0,069 |
1,816 |
Clustered |
|
25–54 |
0,103 |
0,044 |
2,012 |
Clustered |
|
55 |
0,101 |
0,032 |
2,136 |
Clustered |
|
Primary education |
0,120 |
0,021 |
2,309 |
Clustered |
|
Secondary education |
0,105 |
0,041 |
2,038 |
Clustered |
|
Higher education |
0,102 |
0,047 |
1,984 |
Clustered |
Note. Source. Own calculation based on NES data.
In 2014, the territorial pattern of the concentration of those with primary education showed a high grouping value covering 7 settlements close to the southern agglomeration zone of Budapest. The grouping appeared in the Kunszentmiklós district, which is in contact with the winemaking hotspot. In addition, we identified a Low-Low cluster covering three settlements in the city of Baja and its catchment area. High-Low outliers appeared in the wider catchment area of the city. No spatial grouping was identified within the 25 km radius of the winemaking hotspot (Fig. 3).
In the case of jobseekers with a primary education, the High-High cluster formed at the northern border of the county did not change significantly by 2019, and another large-scale High-High cluster appeared in the settlements of the county east of Kiskunhalas. A Low-Low cluster appeared in the centre area of the winemaking hotspot as well as in the southern border areas of the hotspot. The larger Low-Low cluster measured in 2014 around Baja narrowed sharply. Overall, it can be stated that during the period under review, the high territorial concentration of jobseekers with a primary education moved away from the winemaking hotspot by 12 km.
The low clustering of those with secondary education will appear inversely in territory in 2014 compared to primary education. In the northern part of the county a Low-Low cluster was detected, while in the vicinity of Baja a High-High cluster was detected. No clustering of the concentration values of the studied group could be measured in the winemaking hotspot. The clustering of the concentration of secondary school students increased in the examined interval, the number of the affected settlements increased. In the winemaking hotspot in 2019, we identified two new High-High settlements. The inverse appearance related to the territorial grouping of jobseekers with a primary education is also true for the 2019 clusters of the concentration of the unemployed with a secondary education (Fig. 4).
By autocorrelation analysis of the territorial concentration of job seekers in the 25–54 age group, one of the most important cohorts from the labour market point of view, in 2019 we detected High-High clustering in the detected hotspot area and its 15 km catchment area. High-High clustering occurred south and southeast of the horizontal centreline of the hotspot. This clustering covers 12 settlements, of which seven are located in the hotspot, while the other settlements are located within 20 km of the eastern boundary of the hotspot. For settlements north of the wine region hotspot north of the horizontal centreline, 1 Low-Low cluster
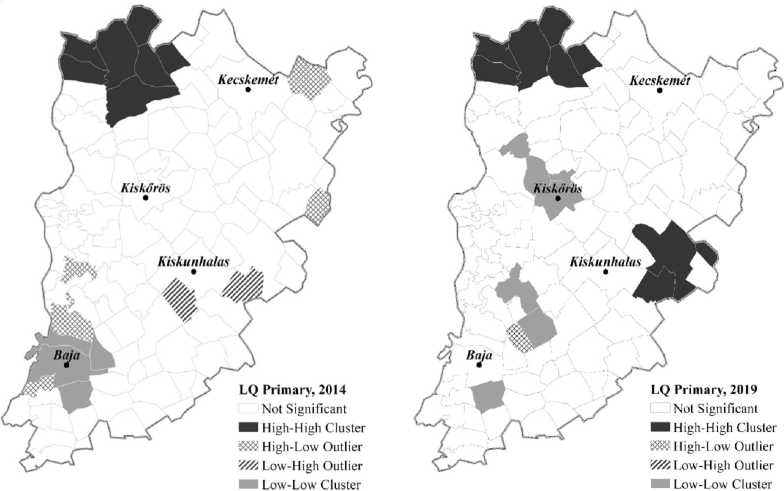
Fig. 3. LISA maps – based on LQ values of primary education 2014 and 2019
Note . Source: Own editing.
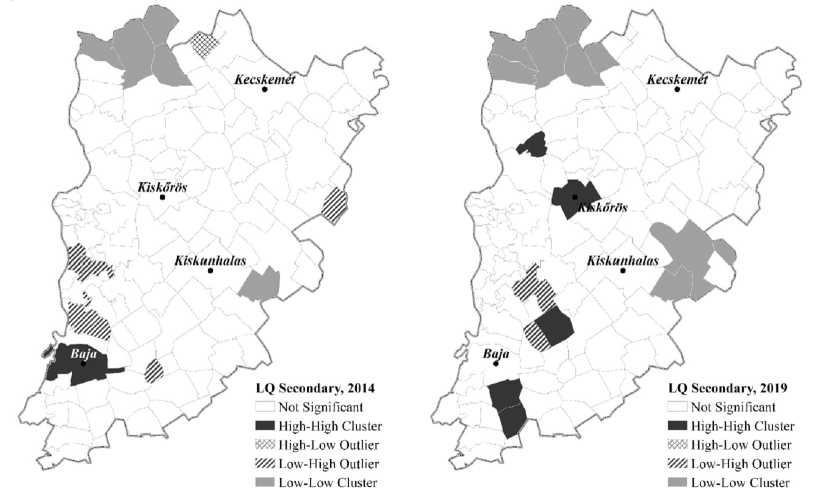
Fig. 4. LISA maps – based on LQ values of secondary education 2014 and 2019 Note. Source: Own editing.
and 1 Low-High outlier appeared within the 15 km catchment area (Fig. 5).
The clustering of the under-representation of the labour market-vulnerable age group over 55 occurred in the southern part of the hotspot. Their low-low cluster affects 7 settlements, including the town of Kiskunhalas. We identified small-scale High-High clusters in the southern border settlements of the county and in the settlements north of Baja. In the agglomeration of the county seat (Kecskemét) no significant clustering of the examined group was identified, only two settlements qualified as High-Low outliers. The concentration of unemployed people at risk was higher than average in these settlements, while it was lower than average in neighbouring settlements. The spatial pattern of the concentration of jobseekers belonging to the vulnerable age group appears inversely with the middle-aged in the studied area. In settlements where the concentration of middle-aged people was high, the concentration of the at-risk age group was lower.
Conclusion
In the research area demarcated by the extension of the winemaking centre area of the Danube wine region, in Bács-Kiskun county, the number of jobseekers decreased significantly between 2014 and 2019, similarly to the national average. The number of jobseekers under the age of 24 decreased the most in the study area, followed by the 25–54 age group. From this, we can conclude that returning the over-55 age group to the primary labour market is the biggest challenge. In Hungary, the high immobility, which can also be traced back to the historical past, characterizes the older age groups to this day. Unlike in Western countries, the willingness to mobilize in Hungary in the age group over 55 is rather low. Higher adaptability and greater mobility of younger age groups improve their labour market position.
In terms of educational attainment, the largest decrease was in the number of jobseekers with a maximum primary education. This may be related to an overall increase in educational attainment.
The number of unemployed decreased to a different extent within each group. As a result, existing territorial inequalities have increased, and new ones have emerged. Regional inequality indicators calculated on the number of unemployed (Dual index, Hoover index) confirmed the increase of territorial differences in almost all groups. Only those group of job seekers over 55 years old showed a slight improvement. The most significant regional differences were identified in the group of unemployed with higher education. Contributing to the special situation of people with higher education is the fact that their share within the unemployed is the lowest, and that they are typically concentrated in larger cities or cities with higher education institutions.
During the autocorrelation study of the settlement-level headcount data of the unemployed
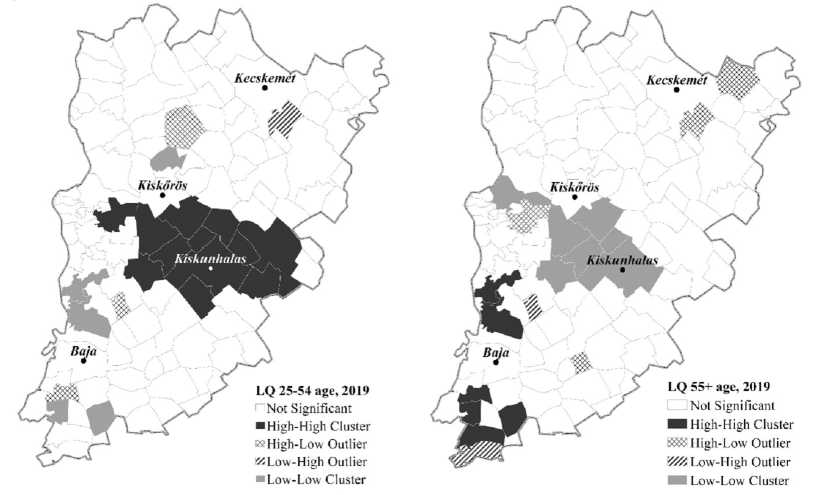
Fig. 5. LISA maps – based on LQ values of 25-54 and 55+ age groups, 2019 Note . Source: Own editing.
groups, no clusters were identified in Bács-Kiskun county. Spatial autocorrelation for the concentration of each group expressed in terms of location quotient confirmed the presence of clustering in several cases. The spatial pattern of the concentration of the unemployed groups was also examined with the local test function of the spatial autocorrelation in order to reveal the settlements that contributed the most to the value of the Global Moran I statistics. The prepared statistics also confirmed the increase of territorial differences, as well as the inverse correlations between the concentrations of each age group.
From the employer’s point of view, the presence of the available potential workforce appears as a comparative advantage in the region, however, the declining number of job seekers and increasing employment may pose a long-term challenge to farmers. The above-average concentration of one of the most important age groups in terms of the labour reserve contingent is located just close to the hotspot, so their accessibility is ensured.
References Spatial research of the labour reserve in the winery center of the Danube wine region (2014-2019)
- Anselin L., 1995. Local Indicators of Spatial Association – LISA. Geographical Analysis, vol. 27 (2), pp. 93-115. DOI: https://doi.org/10.1111/j.1538-4632.1995.tb00338.x.
- Bálint L., 2011. A születéskor várható élettartam nemek szerinti térbeli különbségei. Területi Statisztika, no. 51 (4), pp. 386-404. URL: http://www.ksh.hu/docs/hun/xftp/terstat/2011/04/balint.pdf.
- Bartier P.M., Keller C.P., 1996. Multivariate Interpolation to Incorporate Thematic Surface Data Using Invesre Distance Weighting (IDW). Computers and Geosciences, vol. 22, pp. 795-799.
- Egri Z., 2017. Magyarország városai közötti egészségegyenlőtlenségek. Területi Statisztika, vol. 57 (5), pp. 537-575. DOI: 10.15196/TS570504.
- Gál P., 2020. A földrajzi árujelzők szerepe a magyar borpiacon. Statisztikai szemle, vol. 98 (3), pp. 242-267. DOI: 10.20311/stat2020.3.hu0242.
- Getis-J. K., Getis A., 1996. Local Spatial Autocorrelation Statistics: Distributional Issues and an Application. Geographical Analysism, vol. 27, no. 4, pp. 286-306. DOI: https://doi.org/10.1111/j.1538-4632.1995.tb00912.x.
- Győri T., Egri Z., 2020. A munkanélküliek – mint potenciális munkaerő-tartalék – térszerkezetének vizsgálata Békés megyében. Studia Mundi – Economica, no. 7 (2), pp. 2-17. DOI: 10.18531/Studia.Mundi.2020. 07.02.2-17.
- Hajdú D., 2020. A munkanélküliség és felnőttképzés területi eloszlása az Észak-magyarországi régióban. Északmagyarországi stratégiai füzetek, no. 17 (2), pp. 62-69. DOI: 10.32976/stratfuz.2020.14.
- Járdány K., 2021. A Duna borrégió szőlészeti és borászati helyzetének vizsgálata a magyar szőlő-bor ágazatban. Studia Mundi – Economica, no. 8 (1), pp. 49-64. DOI: 10.18531/Studia.Mundi.2021.08.01.49-64.
- Juhász B., 2020. A Vajdasági Gazdaságfejlesztési Program előzményei, megvalósulása és eredményei. Studia Mundi – Economica, no. 7 (1), pp. 12-25. DOI: 10.18531/Studia.Mundi.2021.08.01.49-64.
- Káposzta J., 2016. Regionális összefüggések a vidékgazdaság fejlesztésében. Studia Mundi – Economica, no. 3 (1), pp. 52-61. DOI: 10.18531/Studia.Mundi.2016.03.01.52-61.
- Keszthelyi K., 2019. Az Új Magyarország Vidékfejlesztési Program területi hatásai. Studia Mundi – Economica, no. 6 (3), pp. 29-41. DOI: 10.18531/Studia.Mundi.2019.06.03.29-41.
- Kincses Á., Valkó G., Bóday P., Lengyel Gy., 2013. Szomszédsági hatások a magyar mezőgazdaságban. Területi Statisztika, no. 53 (2), pp. 157-168. URL: http://www.ksh.hu/docs/hun/xftp/terstat/2013/02/ts2013_02_05.pdf?lang=hu.
- Kispál G., 2017. Examination of Adapting the Contractual System in the Hungarian Wine Sector. Annals of the Polish Association of Agricultural and Agribusiness Economists, no. 19 (2), pp. 108-113. DOI: 10.22004/ag.econ.293501.
- Kiss J.P., Németh N., 2006. Fejlettség és egyenlőtlenségek – Magyarország megyéinek és kistérségeinek esete. Budapest, “Ěagyar Tudományos Akadémia Közgazdaságtudományi Intézet” Publ. 40 p. URL: http://www.econ.core.hu/doc/bwp/bwp/bwp0608. pdf.
- Meloni G., Swinnen J., 2013. The Political Economy of European Wine Regulations. Journal of Wine Economics, no. 8 (3), pp. 244-284. DOI: 10.1017/jwe.2013.33.
- Meng Q., Liu Z., Borders B.E., 2013. Assessment of Regression Kriging for Spatial Interpolation – Comparisons of Seven GIS Interpolation Methods. Cartography and Geographic Information Science, vol. 40, no. 1, pp. 28-39. DOI: https://doi.org/10.1080/15230406.2013.762138.
- Sidlovits D., 2008. Vertikális koordináció a szőlő- és borágazatban. PhD értekezés. Budapest, Budapesti Corvinus Egyetem Interdiszciplináris Doktori Iskola Publ. 163 p.
- Tobler W.R., 1970. A Computer Movie Simulating Urban Growth in the Detroit Region. Economic Geography, no. 46, pp. 234-240.
- Tóth G., 2014. Térinformatika a gyakorlatban közgazdászoknak. Miskolc, Miskolci Egyetemi
- Kiadó Publ. 107 p. URL: https://gtk.uni-miskolc.hu/files/6405/Terinfo.pdf.
